Volatility may be due to ramp up in the equity markets in the days and weeks to come, writes Michael Kramer, founder of Mott Capital Management, as signs of stress pile up beneath the surface.
The Volatility Index [VIX] has been relatively calm, trading between 20 and 35 since the end of 2021, and has been unable to reach a final blow off top to signal a bottoming process for stocks. However, since the beginning of October, equity markets have rallied sharply as investors begin to again dream of a dovish pivot from the US Federal Reserve. These dreams have come in response to the Bank of England buying bonds over the short term to stabilise the gilt market, while the Reserve Bank of Australia decided to raise rates by 25 basis points (bps) instead of 50 bps at its latest meeting.
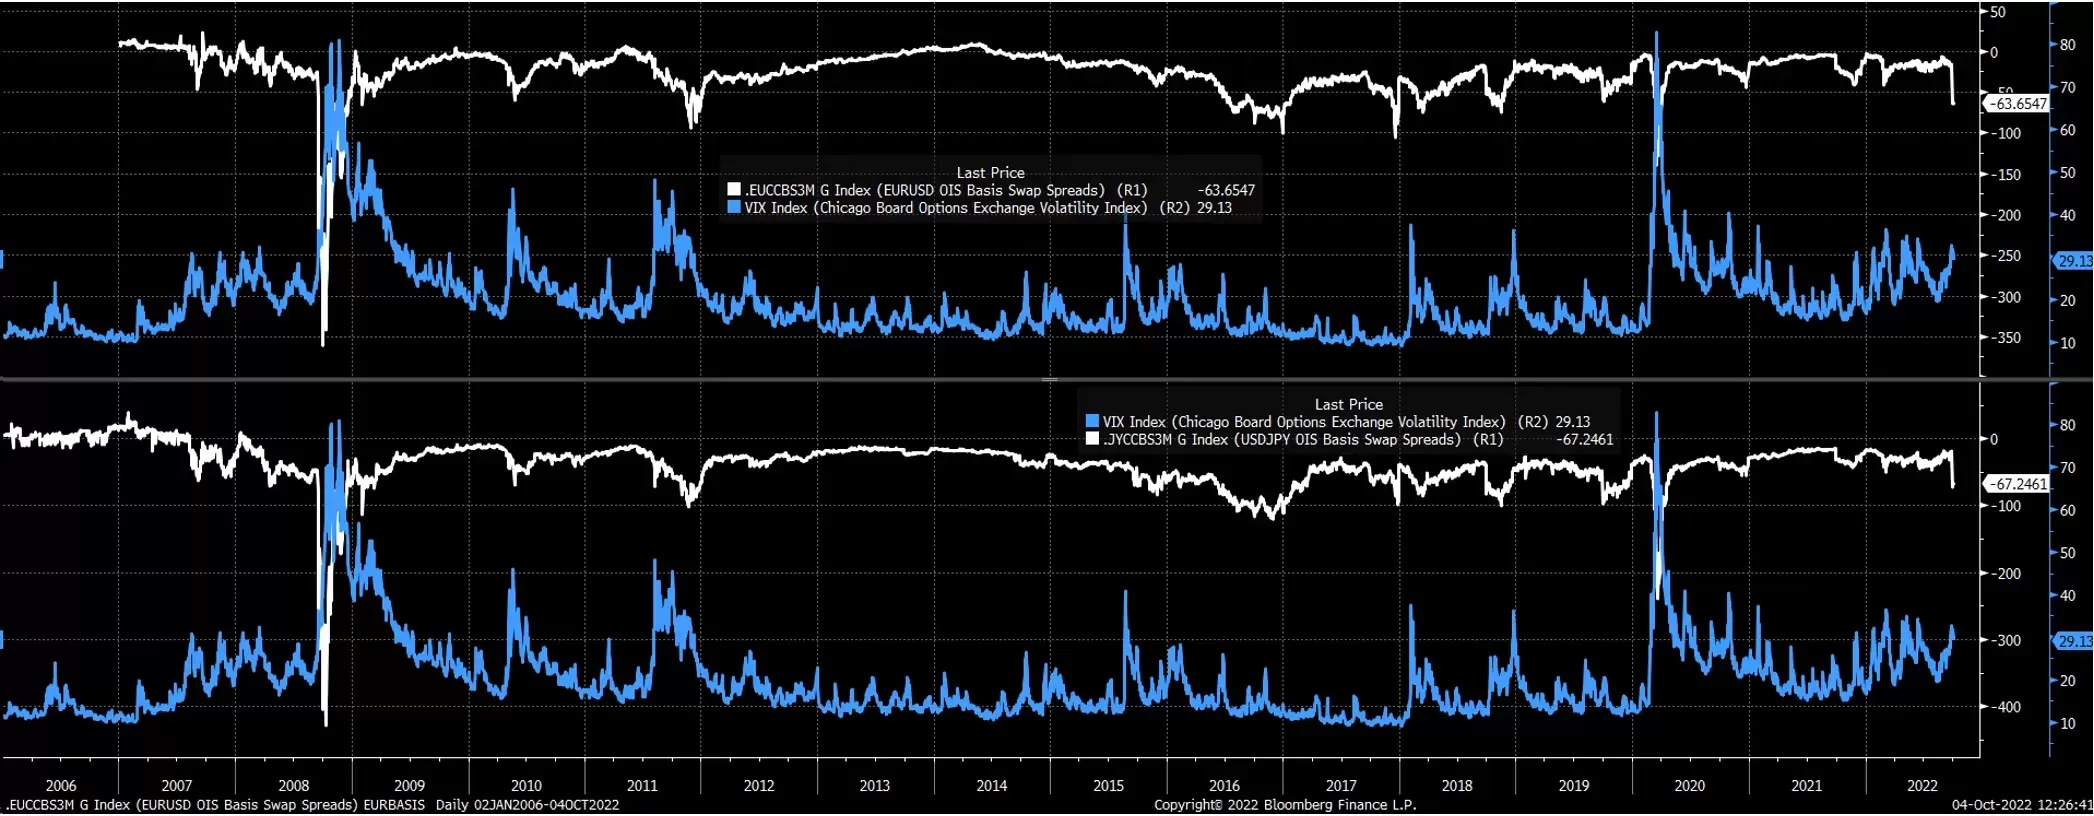
Despite the excitement with the S&P 500 jumping, the VIX hasn't fallen much. While the S&P 500 has rallied around 5% since the start of October, the VIX has only moved to 29 from 31. There could be a good reason why the VIX has stayed elevated, and it might be due to some levels of stress forming in the market. For example, 3-month euro and yen basis swaps have fallen to their lowest levels in some time, while the Markit CDX HY spread has climbed to its highest level since March 2020.
Additionally, the FRA OIS spread, which measures the difference between the 3-month Libor rate and Fed Funds rate, has spiked too. All of these indicators are acting as reasonable liquidity measures. Typically, when stress forms in these markets, volatility in equities tends to follow.
(Quant-Insight)
Bond market volatility
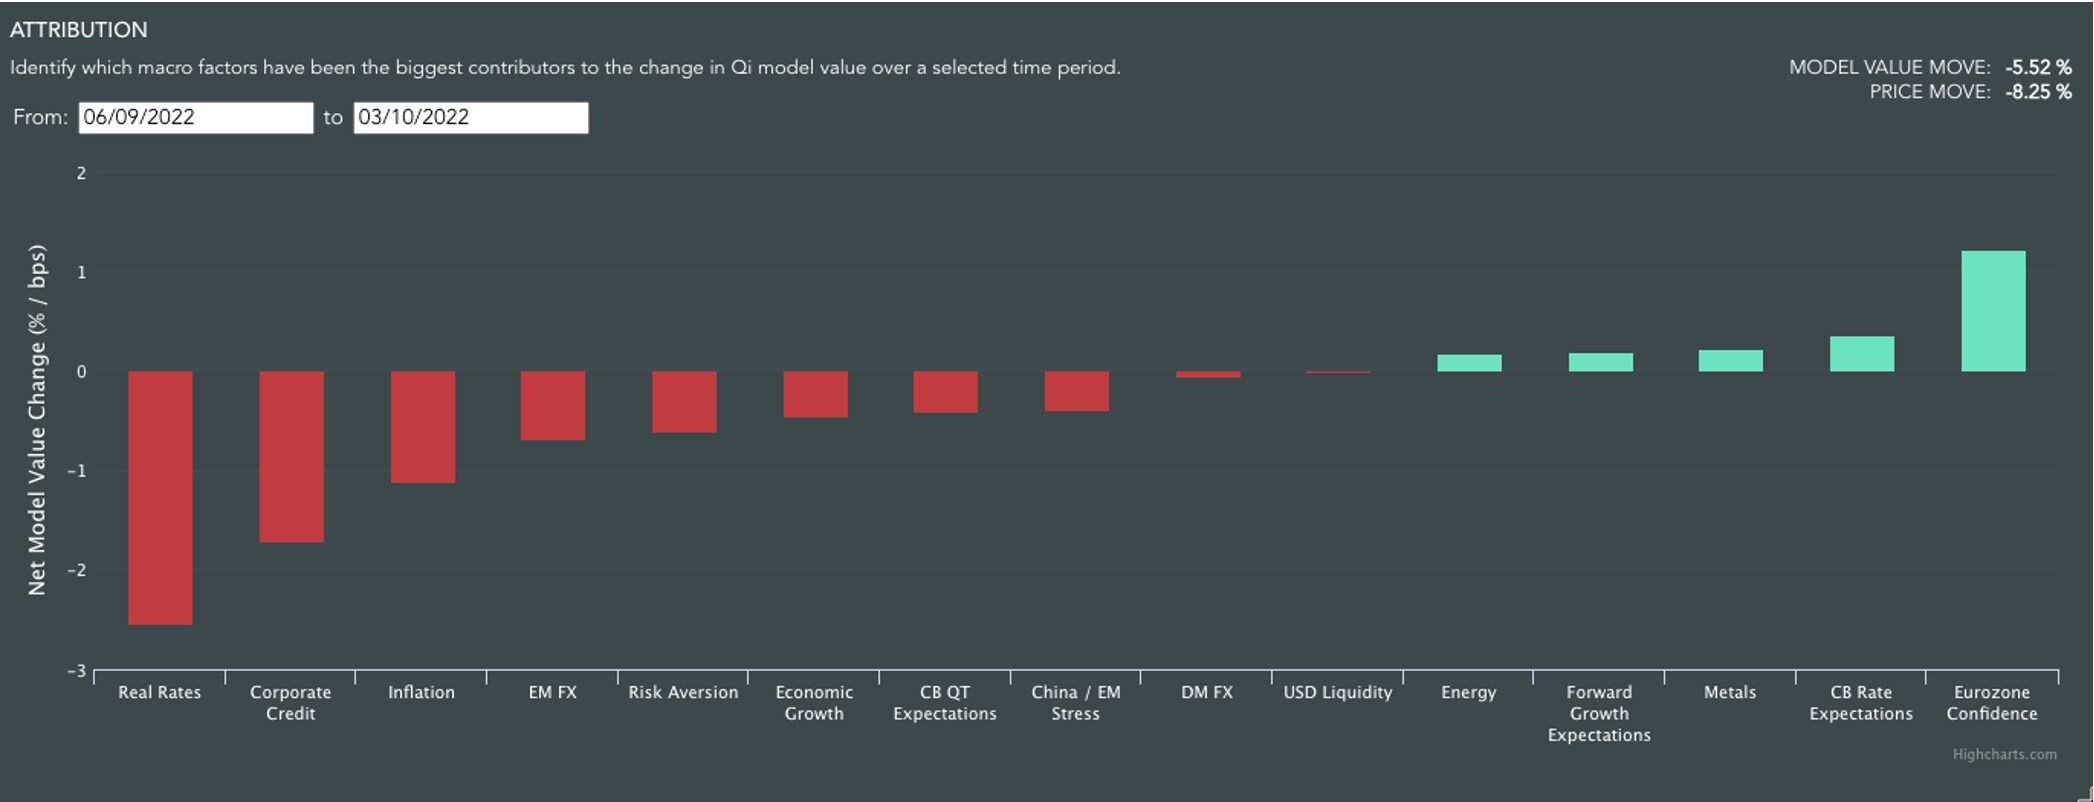
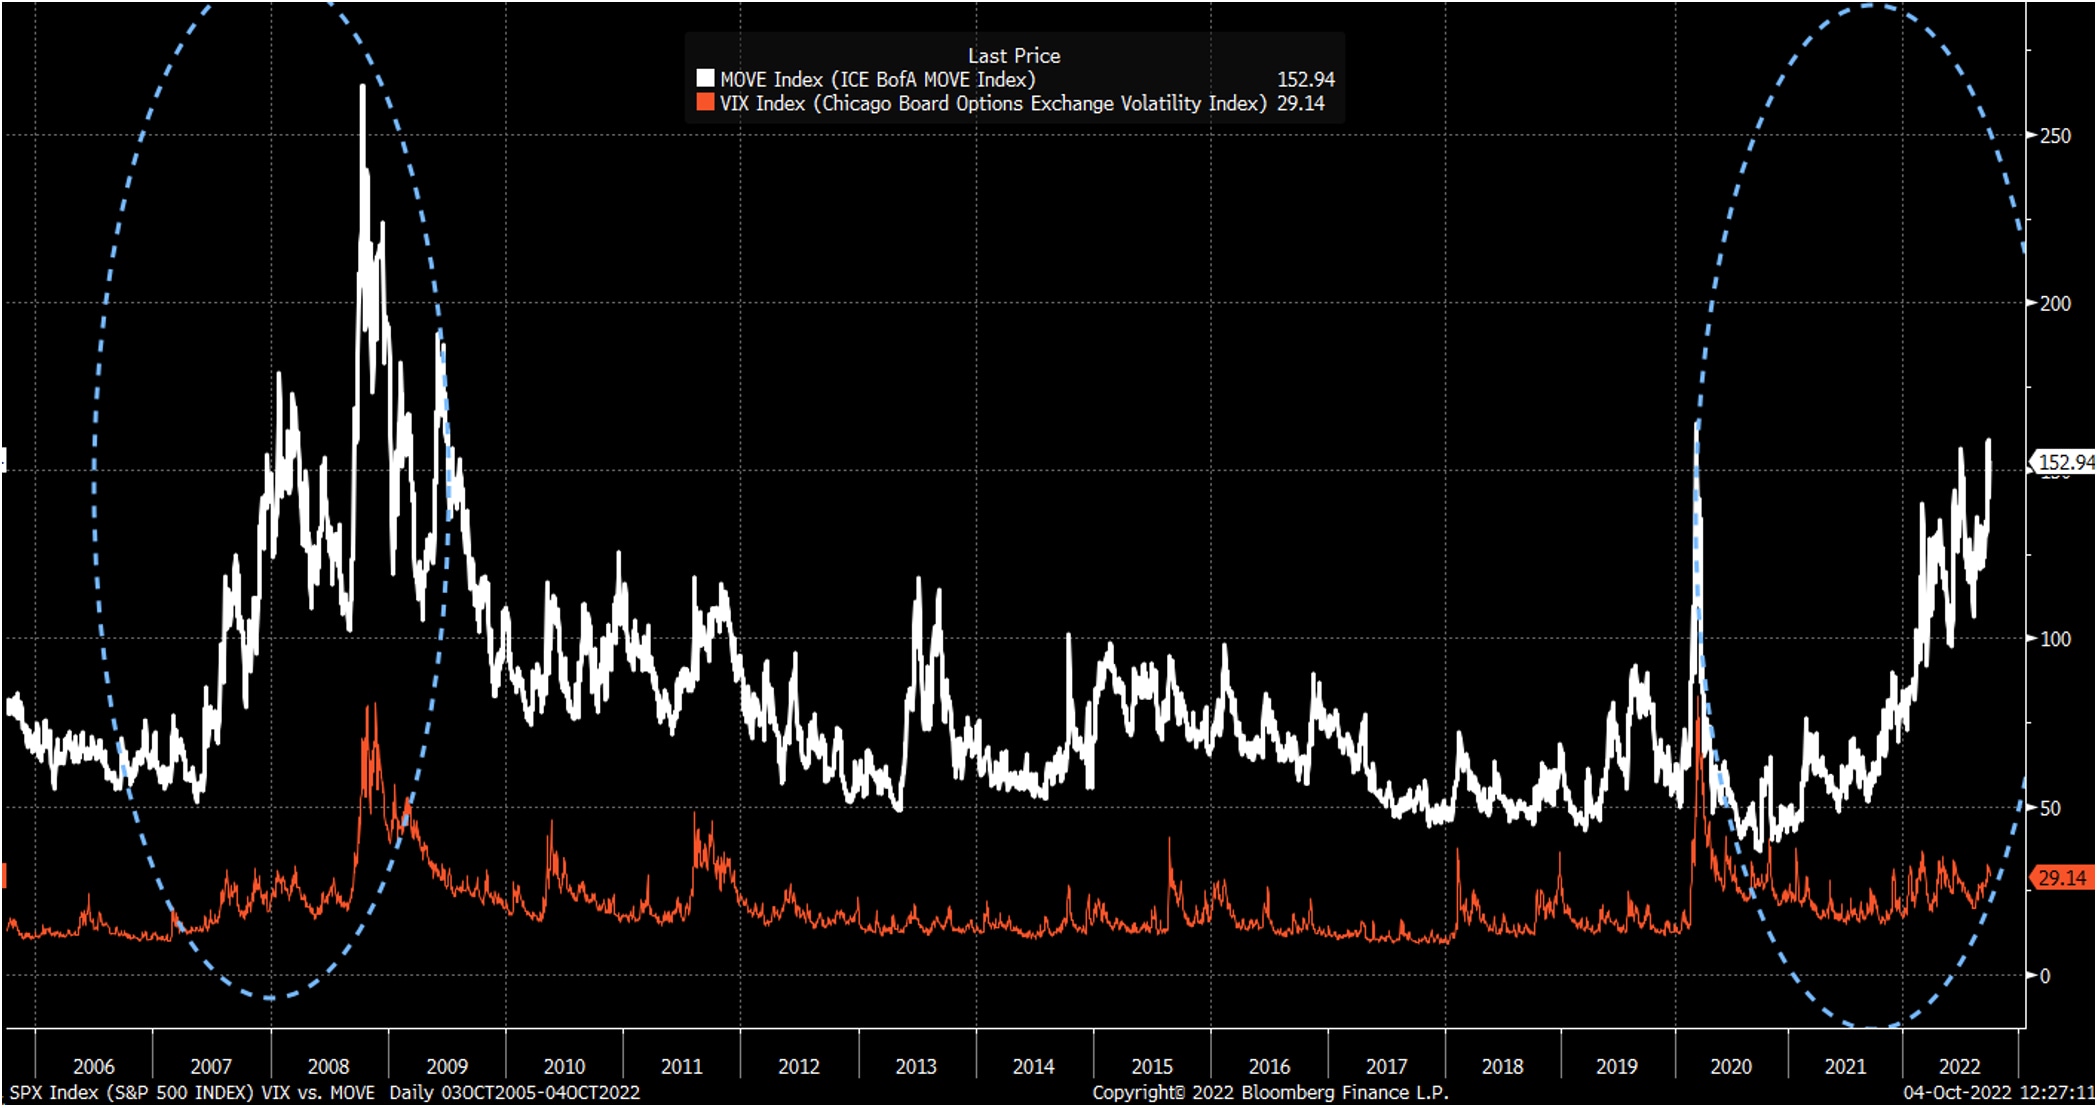
Data from Quant Insight shows that real rates and corporate credit have been two of the most significant negative influences on the S&P 500 in 2022, and if one thing is clear, volatility in the bond market is extremely high. The ICE BofA [Move] index, which measures bond market volatility, has surged higher in 2022, while the VIX has been largely left behind. Interestingly, in 2008, a similar occurrence took place before the VIX finally moved sharply higher. Of course, it doesn't mean the VIX has to move higher, but the fact that bond market volatility has been so high, while equity market volatility has remained calm, doesn't make much sense.
(Bloomberg)
Currency market stress
Additionally, when euro and yen basis swaps tend to see spikes lower, those spikes are often around the same time implied volatility for equity markets rises. This relationship could be due to broader market stress, and a lack of liquidity in overall financial markets.
(Bloomberg)
Credit spreads widen
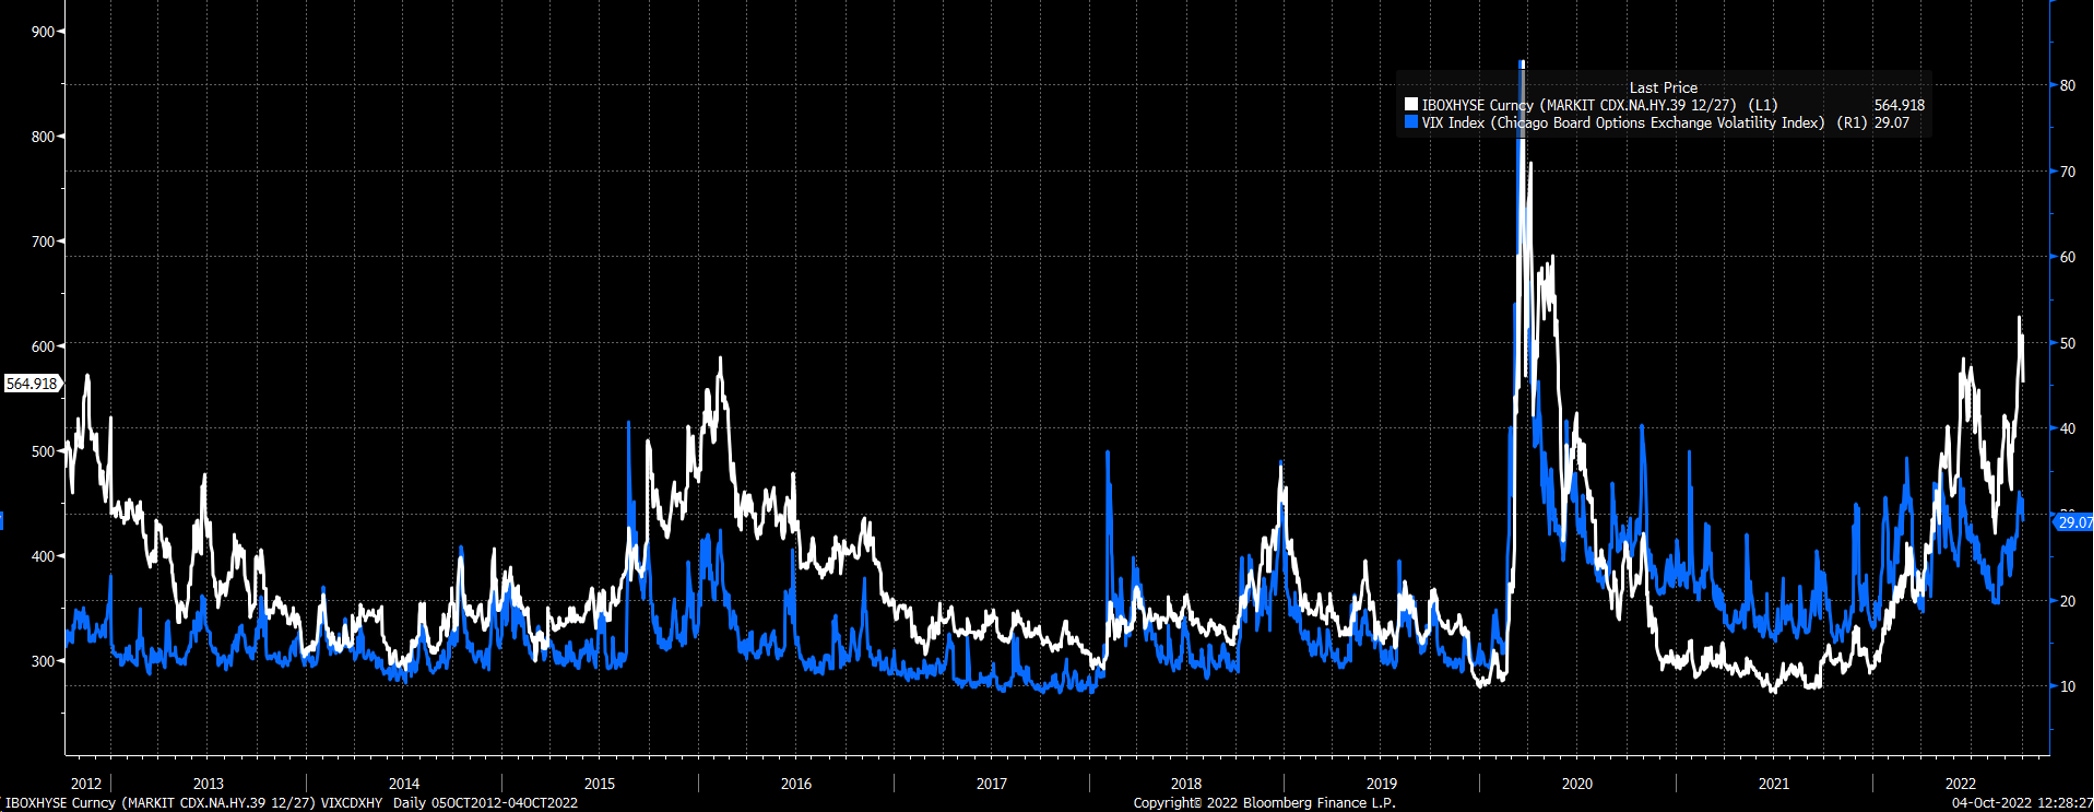
The Markit CDX High Yield spread has also moved up to around 600 recently, and historically changes in the spread are associated with rising and falling levels of implied volatility. Going back to 2012, when the CDX spread increases, it tends to be accompanied by a VIX that moves higher, such as in 2015, 2016, 2018, and 2020.
Noticeably different here is that when there is real stress in the system, and investors are genuinely shunning risk-taking, the CDX spread will rise, and the VIX will rise with it. However, in January 2018, when the VIX was exploding higher, the CDX spread was not rising; a sign that while equity markets were struggling, bond markets were not. This could help a trader or investor identify the difference between an ordinary equity market correction, and perhaps something fundamentally different.
(Bloomberg)
All the signs of stress in the bond and currency markets seem to be happening just as stocks are bouncing hard off their lows. This could make one wonder if the rally to start October is just another ‘head fake’ by markets, as investors are again being duped into thinking a Fed pivot is coming, when it’s not.
Indeed, the credit and overnight funding markets are flashing bright yellow lights of caution, while stocks ignore the signals. This could mean markets are getting very close to another big bout of volatility, and a stock market drop.
Charts used with the permission of Bloomberg Finance LP. This report contains independent commentary to be used for informational and educational purposes only. Michael Kramer is a member and investment adviser representative with Mott Capital Management. Mr. Kramer is not affiliated with this company and does not serve on the board of any related company that issued this stock. All opinions and analyses presented by Michael Kramer in this analysis or market report are solely Michael Kramer's views. Readers should not treat any opinion, viewpoint, or prediction expressed by Michael Kramer as a specific solicitation or recommendation to buy or sell a particular security or follow a particular strategy. Michael Kramer's analyses are based upon information and independent research that he considers reliable, but neither Michael Kramer nor Mott Capital Management guarantees its completeness or accuracy, and it should not be relied upon as such. Michael Kramer is not under any obligation to update or correct any information presented in his analyses. Mr. Kramer's statements, guidance, and opinions are subject to change without notice. Past performance is not indicative of future results. Neither Michael Kramer nor Mott Capital Management guarantees any specific outcome or profit. You should be aware of the real risk of loss in following any strategy or investment commentary presented in this analysis. Strategies or investments discussed may fluctuate in price or value. Investments or strategies mentioned in this analysis may not be suitable for you. This material does not consider your particular investment objectives, financial situation, or needs and is not intended as a recommendation appropriate for you. You must make an independent decision regarding investments or strategies in this analysis. Upon request, the advisor will provide a list of all recommendations made during the past twelve months. Before acting on information in this analysis, you should consider whether it is suitable for your circumstances and strongly consider seeking advice from your own financial or investment adviser to determine the suitability of any investment.
Disclaimer: CMC Markets is an order execution-only service. The material (whether or not it states any opinions) is for general information purposes only, and does not take into account your personal circumstances or objectives. Nothing in this material is (or should be considered to be) financial, investment or other advice on which reliance should be placed. No opinion given in the material constitutes a recommendation by CMC Markets or the author that any particular investment, security, transaction or investment strategy is suitable for any specific person. The material has not been prepared in accordance with legal requirements designed to promote the independence of investment research. Although we are not specifically prevented from dealing before providing this material, we do not seek to take advantage of the material prior to its dissemination.


