In the blink of an eye, we are in the last month of 2023, which is a perfect time to review on the performance of the US stock markets over the year.
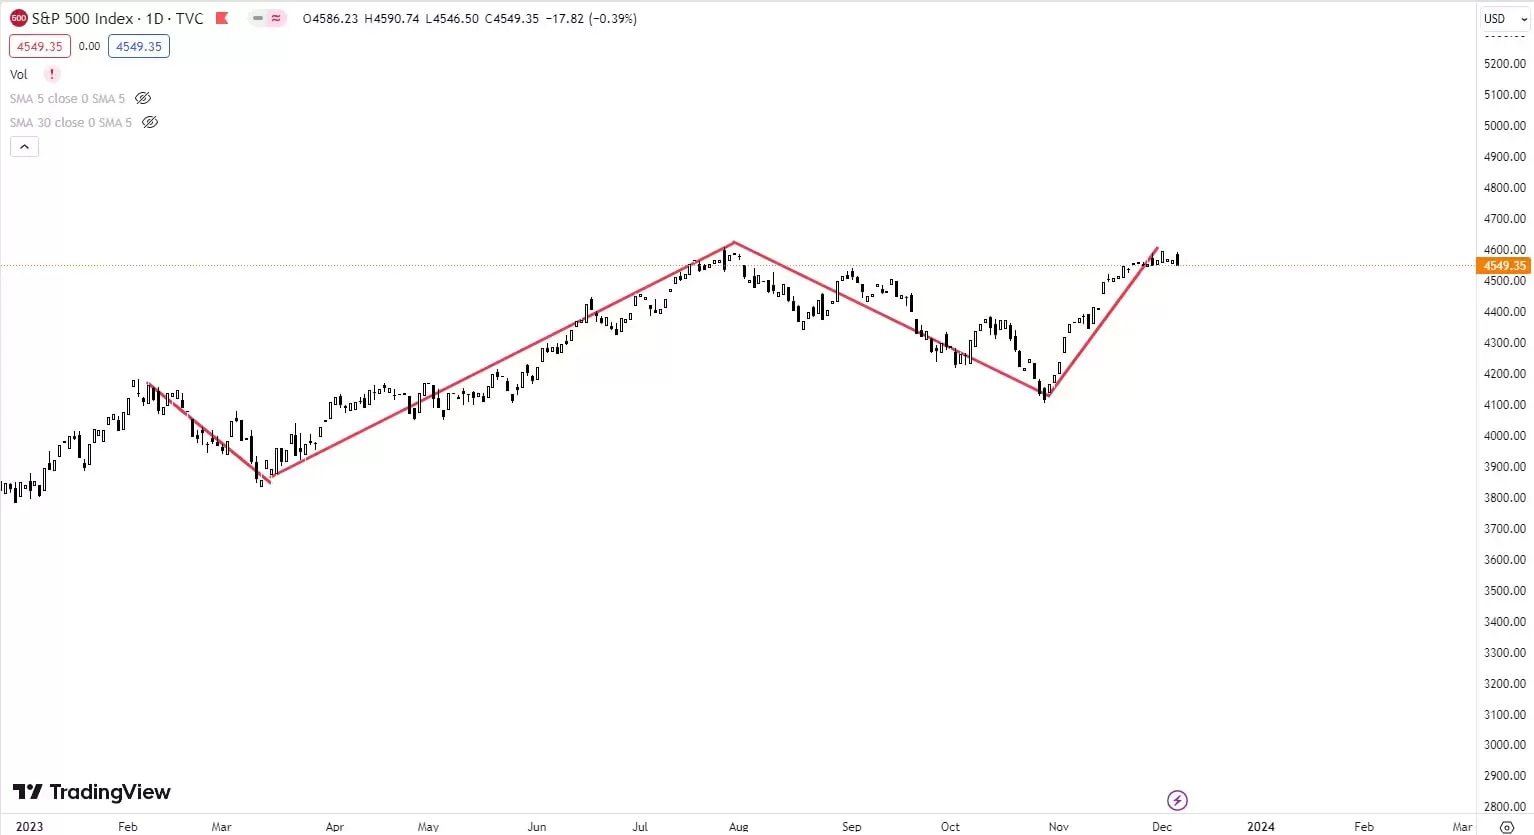
In March, there was a brief decline triggered by a regional banking sector crisis following the collapse of Silicon Valley Bank (SVB). The Fed was quick to act, guaranteeing deposits and stemming any ripple effects across the banking system in echoes of the past during the 2008 Financial Crisis.
Following SVB’s collapse, US markets posted a strong relief rally thereafter till the end of July. The upward trend in stock prices during this period boils down to a simple reason: interest in artificial intelligence (AI).
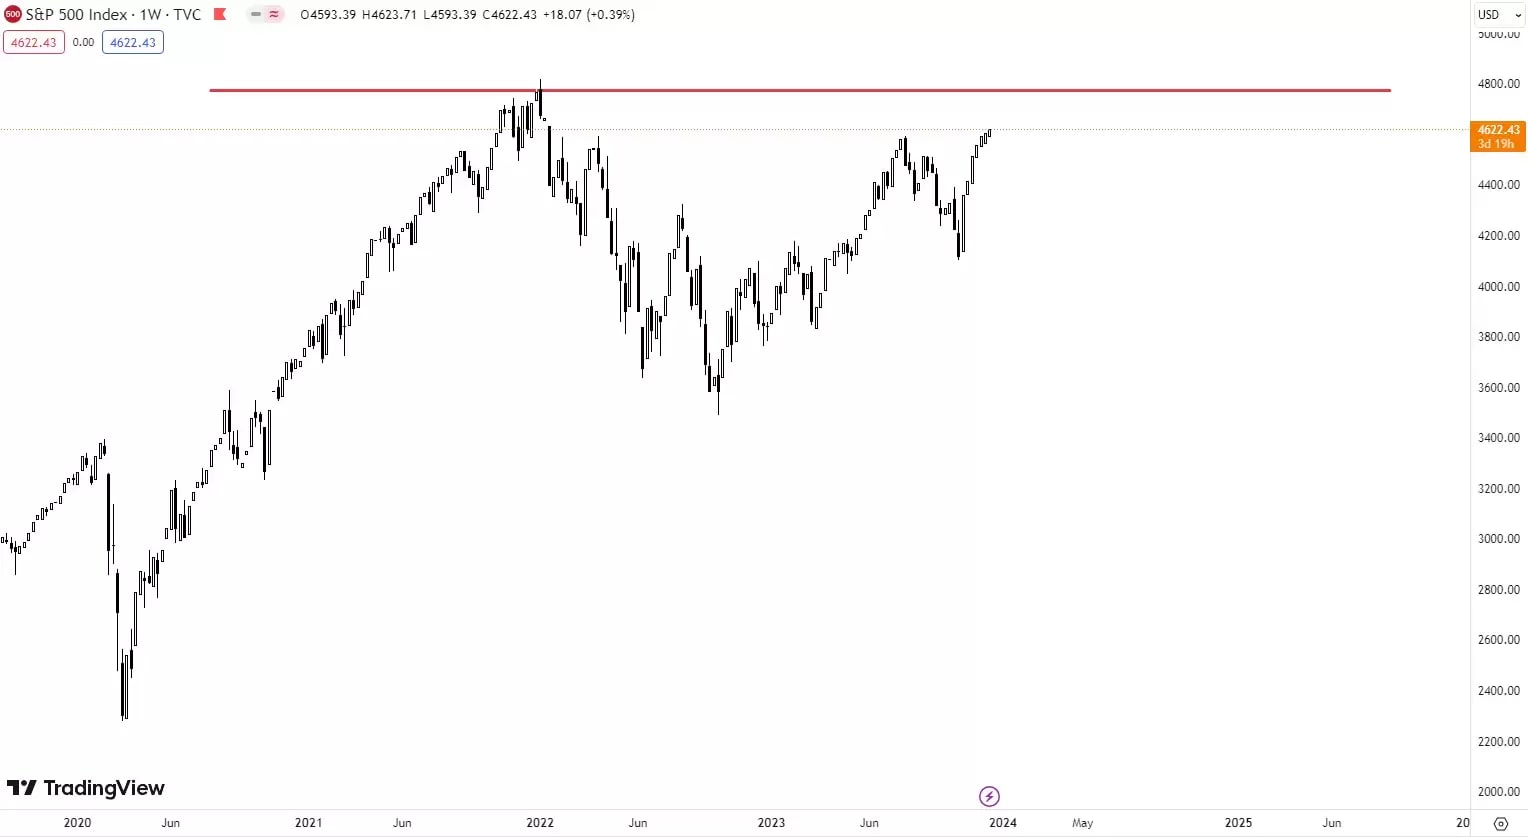
You can see in the chart below for the S&P500 the March period decline following a strong run of gains until August:
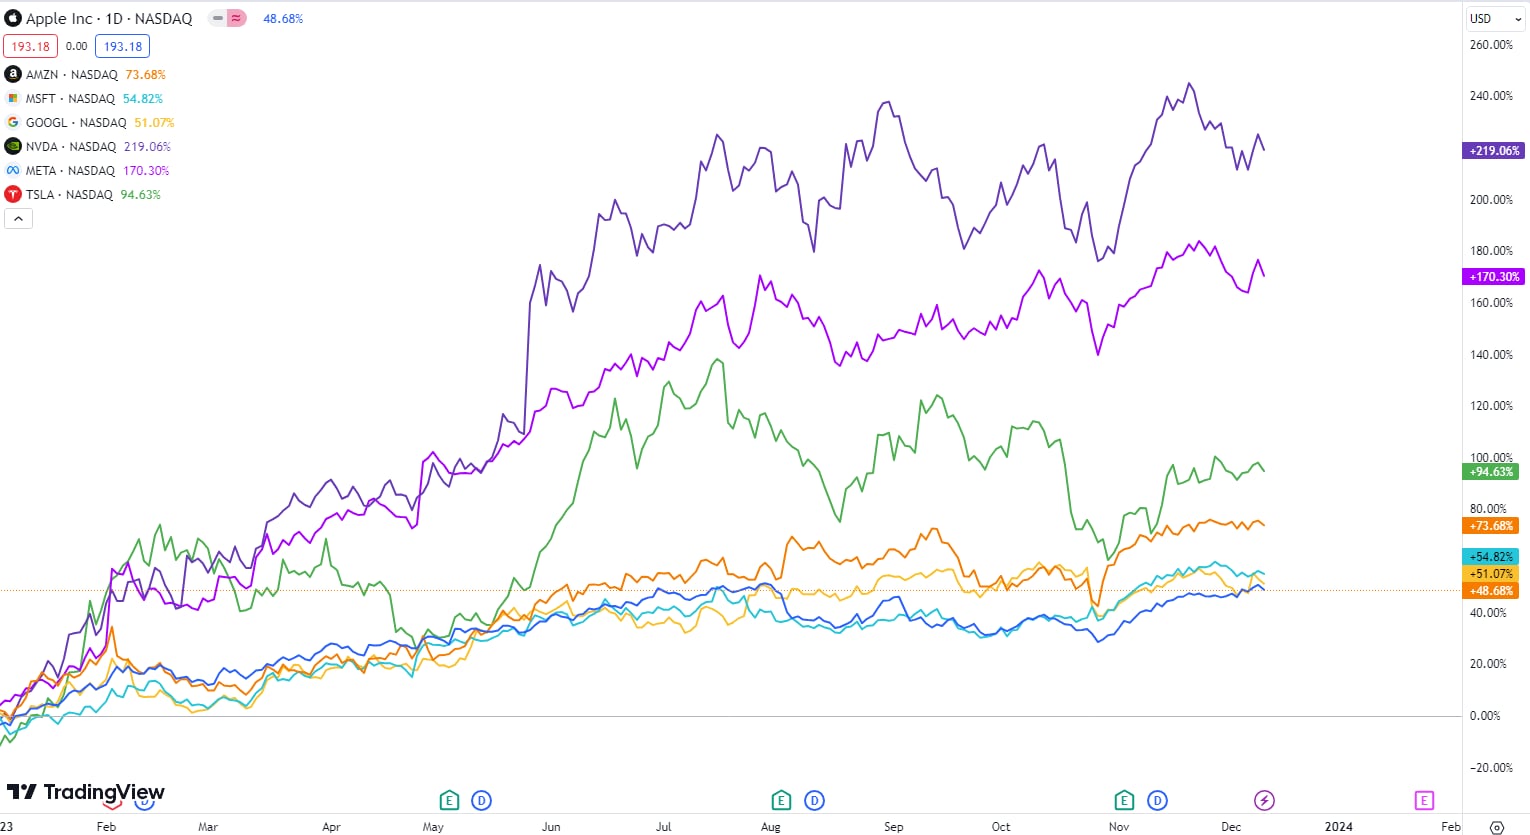
Dubbed the ‘Big Seven’ - Apple Alphabet, Meta, Microsoft, NVIDIA, Amazon, and Tesla were responsible for significant gains on Wall Street. It was these seven companies, whose increasing narrative within the world of AI, which helped push indices like the Nasdaq to a 42% increase YTD increase (January to December 2023).
As of December 12th 2023:
- NVIDIA’s stock price has skyrocketed by 219%.
- Meta recorded a 170% rise YTD in 2023 as it restored profitability.
- A rapid increase in sales propped by price cuts contributed to the 95% YTD growth in Tesla’s stock price this year.
- Amazon also reported strong revenues, thanks to the robust spending data in the US, and its stock price went up by 74% as a result.
- Other tech stocks, such as Microsoft and Google, also climbed by around 50% due to the launch of their respective generative AI tools.
- However, this disruptive growth is not echoed in Apple’s stock price since it lags behind other tech players in the AI space.
These gains are in stark contrast to another key trend of 2023; inflation. The Fed went hard and early in hiking rates resulting in the US experiencing a decline in inflation as the headline CPI fell from 6.4% year on year in January to 3% in June. A resilient economic front, coupled with strong consumer spending, a robust labor market, and strong US company earnings, all pointed to the talked about “soft landing” in the US.
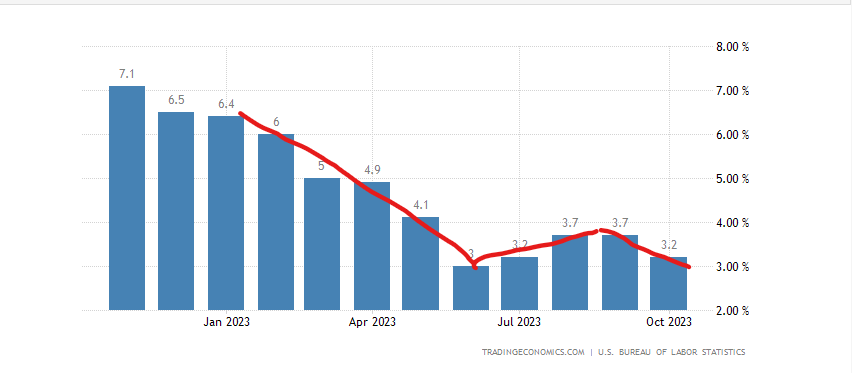
US headline CPI MoM. Source: TradingEconomics as of 7 December.
However, inflation bounced back in the third quarter due to rising energy prices, encouraging the Fed to remain hawkish on “higher-for-longer” rates. This rhetoric in the mid-year resulted in the US ten-year Treasury yield surging to 5%, sending stock markets down. As shown in the chart above, the S&P500 fell by more than 10% from the July high of above 4,600 to just above 4,100 in late October
Against the backdrop of a resurgence in the government bond yields, the Fed softened its hawkish tone on its rate hike path but kept the door open for more rate hikes in November. Their current narrative explains that “tighter financial and credit conditions for households and businesses are likely to weigh on economic activity, hiring, and inflation.”
In response to the Fed’s dovish tweak in rhetoric, markets priced an end of the hiking cycle and possible rate cuts starting from mid-2024. This expectation sent the US government bond yields sharply down, with the ten-year Treasury yield plunging to 4.2%, while risk-on sentiment boosted the US stock markets, with the three US benchmark indices, hitting their year-high levels.
How will the US stock markets perform in 2024?
The FOMC acknowledged at the Fed meeting on November 1 that the tightening financial policies adopted recently had put downward pressure on economic activity and inflation, which might offset the need to raise rates again. Fed Chair Jerome Powell also noted that growth above potential could not warrant further rate rises.
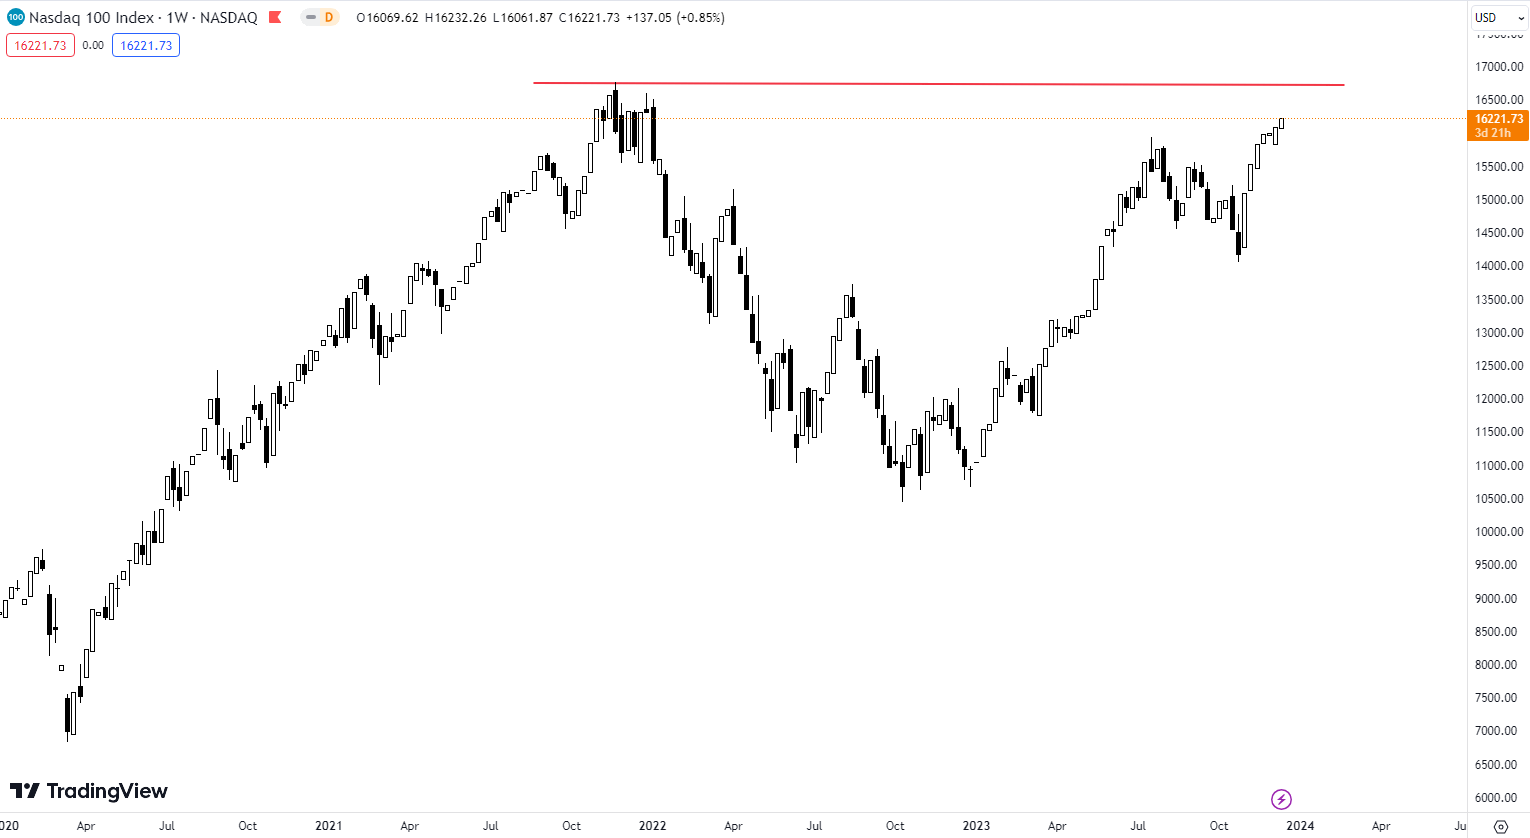
In response to the dovish signals released by the Federal Reserve, the market generally expected the end of this rate-hike cycle and the possibility of rate cuts at some point in 2024. This prompted declines across the US bond yields, while the US stock market saw an exponential rise as Nasdaq 100. The index has hit a new high since January 2022, only less than 4% shy of its record high. Additionally, the S&P 500 has surpassed the 4,600 mark, while Dow Jones only has less than 2% to grow before it hits an all-time high.
An analysis of sector trends saw that increases are primarily contributed by the communication services (36.38%), technology (52.56%), and non-essential consumer sectors (47.65%), while other sectors such as utilities, real estate and essential consumer goods, have demonstrated average performance due to economic and inflationary pressures.
Currently, the market is predicting the Federal Reserve will cut interest rates in mid-2024, overlooking the risk that it may maintain higher interest rates for longer and a longer balance sheet reduction cycle. The total assets and liabilities still stand at 7.8 trillion dollars now, which is far higher than the pre-pandemic level.
The comparison of the S&P 500 Index and the S&P 500 Equal Weight Index ETF (RSP) shows a clear divergence in their trends: the S&P 500 Index continues to climb with an increase of 18.5% YTD as of 6 December 2023, while the RSP experiences overall fluctuation, climbing only 7% over the same period.
The RSP shares the same mix of component stocks as the S&P 500 Index, but each company is given a fixed weight, which reflects the average performance of other stocks this year due to the smaller impact of the "Big Seven" tech stocks. The RSP is likely to bear the brunt when the upward trend of the "Big Seven" slows or lowers if there are changes in economic direction or a general slowdown in the future.
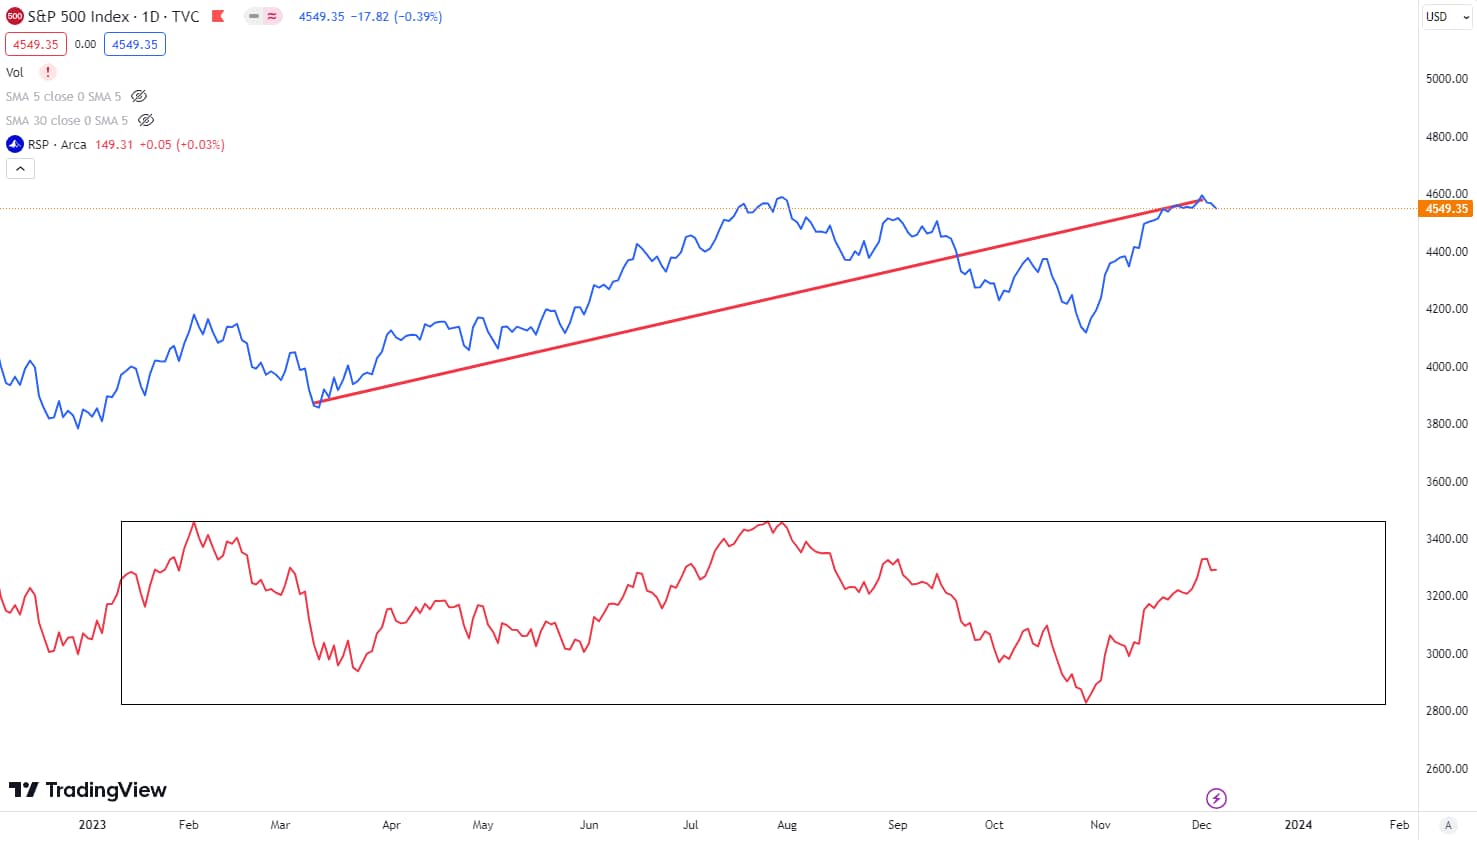
S&P 500 Index (blue) vs S&P 500 Equal Weight ETF (red). Source: Tradingview, CMC Markets 7 December 2023.
Will the “Big Seven” maintain their momentum in 2024?
Despite the impressive performance in 2023, the Big Seven could be challenged by sizable risks in 2024. NVIDIA could suffer severe setbacks in its data center revenue in the fourth quarter of 2023 due to new US chip curbs imposed on China. The company's third-quarter financial report showed that nearly 80% of its revenue came from data center products, with 25% generated in China. Despite management claims that NVIDIA’s sales growth in other regions will offset the decline in China, the extent of the impact of these policies remains uncertain. Additionally, NVIDIA’s CEO, Jensen Huang, sold his shares in early September when the stock price was around US$500.
Tesla's stock price soared to nearly US$300 in July but has slowed down in recent months, mainly caused by a slowdown in delivery volumes reported in the third quarter. Q4 earnings released early in 2024 will continue to indicate where the direction could go for Tesla over 2024.
According to Tesla’s CEO Elon Musk, the company is set to achieve the delivery target of 1.8 million vehicles in 2023. However, its rapid growth in the first three quarters was mainly driven by price reductions, which have eaten into the gross margin. To hit the 1.8 million vehicle target, Tesla needs to deliver over 470,000 vehicles in the fourth quarter, which is higher than any single quarter in the previous three.
In addition to this, Musk has signalled Tesla will face more sales challenges in a global environment of high-interest rates, which could weigh on its stock price.
Whilst beating expectations in quarterly earnings reports, Apple's stock price has performed modestly this year. It remains fairly subdued in talking about any AI development compared to the rest of the Big Seven. Apple continues to face direct competition in the handset market but its services division, which includes subscriptions like iCloud, soared 16% YoY.
Across the rest of the Big Seven, macroeconomic headwinds in the environment of high-interest rates and decreasing consumer spending could impact performance. Amazon faces slowing increases due to a drop in excess savings among US consumers and challenges in student loan repayments. Meta's metaverse division has stagnated in a loss-making state, and it remains uncertain whether the growth rate of its active users is sustainable. The growth of Google and Microsoft's cloud services is a direct driver of their future stock prices, while Google's cloud business has already shown signs of faltering growth.
The Fed’s rhetoric and economic indicators remain crucial
The current stock market rally is due to expectations for rates to start being cut with predictions starting as soon as mid-2024 as US economic data signalled weakness in some parts. Despite the stronger-than-expected job data for November, the labor market trajectory will likely see a slowdown in 2024 following increasing cost-cutting measures by businesses.
The Fed’s aggressive rate hikes impacted manufacturing activities the most, with the PMI extending a 12 consecutive month contraction in November. October retail sales fell 0.1% month on month, contracting for the first time since March, while the household saving rate dipped to 3.8% in October from an average of 5% in Q2.
However, the US stock markets rallied in projecting a Fed’s pivot in its hiking cycle rather than responding to an actual commencement of a rate cut cycle. In history, equity markets usually experienced a crash when the Fed had to cut the interest rates in response to a crisis. These examples can be observed in the last few recessions, including the Dot-com bubble in 2000, the GFC in 2008, and the pandemic in 2020.
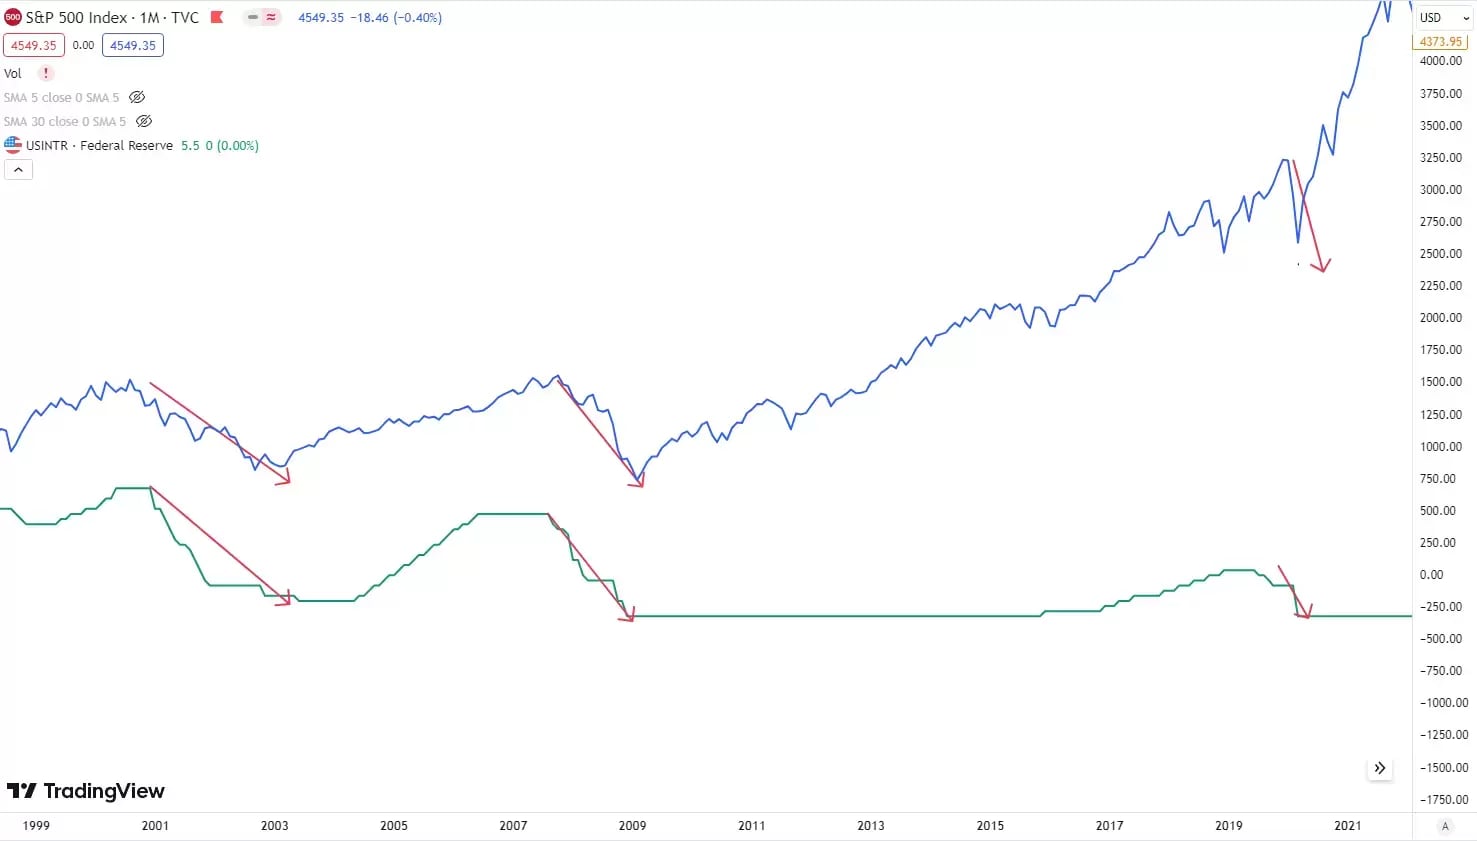
Despite signs of weakness in parts of the economy, the Federal Reserve appears to highlight economic resilience, while maintaining the restrictive policy. Economic indicators such as employment, CPI and PMI remain crucial to the Fed when making further monetary decisions through 2024. Only then could we get a clearer understanding of how long “higher for longer” rates are.
Disclaimer: CMC Markets is an order execution-only service. The material (whether or not it states any opinions) is for general information purposes only, and does not take into account your personal circumstances or objectives. Nothing in this material is (or should be considered to be) financial, investment or other advice on which reliance should be placed. No opinion given in the material constitutes a recommendation by CMC Markets or the author that any particular investment, security, transaction or investment strategy is suitable for any specific person. The material has not been prepared in accordance with legal requirements designed to promote the independence of investment research. Although we are not specifically prevented from dealing before providing this material, we do not seek to take advantage of the material prior to its dissemination.


