Australia’s #1 share trading platform with $0 brokerage on US, UK, Canadian, and Japanese markets. Access 40,000+ stocks and ETFs on our desktop platform and mobile app.
Let’s start trading.
Australia’s #1 share trading platform with $0 brokerage on US, UK, Canadian, and Japanese markets. Access 40,000+ stocks and ETFs on our desktop platform and mobile app.
Let’s start trading.

Winner 2011-2026
Broker of the Year
Canstar
Winner 2024-2026
Best for Portfolio Insights
WeMoney
Winner 2026
Best Share Trading Platform
Finder
Winner 2024
Online Share Trading - Casual US Investor
Mozo
From ANZ to BHP, invest in ASX-listed shares. Plus, get $0 brokerage on your first buy of each Aussie stock under $1,000, each day.*
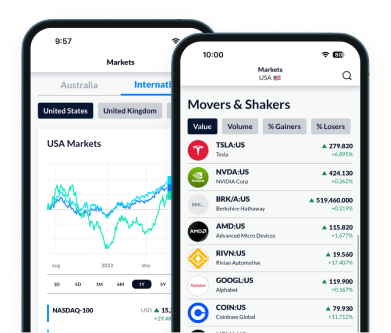
With 15 international markets on offer, invest in your favourite global stocks, from Apple to NVIDIA.
With over 40,000 investment opportunities and multiple ways to trade with options and warrants, we really are your one-stop investment platform.
*Excludes margin loan settled trades.
Stay on the pulse with TipRanks analysis, Morningstar insights and ESG ratings.
Invest in Aussie and international stocks, ETFs and more - all from one account.
Review, model and explore price movements to your heart’s content with TradingView charts.
Sync with Sharesight for user-friendly tax and portfolio reporting.
Guide your portfolio with performance snapshots, price predictions, and detailed analysis - thanks to Morningstar insights.
ESG Risk Ratings showcase environmental, social and governance risk levels - letting you invest with confidence and a clear conscience.

Model, compare, and analyse your position with our advanced charting package, powered by TradingView. Access 7 chart types with 200+ technical indicators and drawing tools, allowing for advanced modelling and down-to-the-minute analysis.

Gain investing inspiration with thematic stock and ETF watchlists, your source for curated investment ideas in our mobile trading app. Keep an eye on key stocks and ETFs, from big tech and booming industries to emerging economies and ESG themes.

Join 1 million+ Australians who are already investing better with CMC Invest, named Canstar’s Broker of the Year 16 times. Whether you’re a new or seasoned investor, our intuitive tools make share trading a breeze. Move ahead of the market and unlock your financial potential today.

Give the next generation a head start by helping them build real wealth for the future. Whether you’re a parent, grandparent, family member or friend, it’s a straightforward way to invest in your child’s future and teach them how wealth really grows.


Our Sharesight partnership allows you to track share splits, dividends and keep up-to-date with the tax implications on your holdings. Track 10 holdings for free, or upgrade to a paid Sharesight plan for larger portfolios.

Choose from five portfolio subscriptions, covering Aussie and US markets. You’ll be guided through creating a portfolio that follows your chosen strategy. The team will help keep your portfolio in-line with market movements.
Whether you’re new to share trading or sharpening your skills, our resources help you succeed.
Whether you’re new to share trading or sharpening your skills, our resources help you succeed.
Understand the key terms used in share trading to help you navigate the CMC Invest platform and global markets confidently.
The improved CMC Invest platform has new features to enhance your trading experience. This guide will help investors to set their platform settings and understand key account information
Dividends are paid directly to your cash account on the payment date.
Once you’ve logged into the desktop platform go to Tools > Morningstar Research. Where available, you'll find Morningstar research and reports integrated into the stock overview page.
Once logged into the desktop platform you can access News and insights under the Insights drop down. For the mobile application it’s under More > CMC News & Analysis.
Yes, you can link an existing margin loan from your lending provider.
The most convenient way to deposit funds into your cash account is via direct deposit using your BSB and account number. These details are available in the desktop platform under Account > Account Funding. For the mobile app navigate to More > Balance and Transfers > Deposit Funds.
Once you open a CMC Invest account, we’ll create an ANZ cash account for you which will be directly linked to your Invest account. This account is for trading and settlement purposes only and enables you to trade online using any of the CMC Invest platforms.
Invest in Aussie shares, international shares, ETFs, options and more all from your CMC Invest account.
Invest in over 30,000 international stocks – all from our single trading platform. Plus, get started with $0 brokerage on all stocks from the US, UK, Canada and Japan*.
Our powerful trading platform gives you the edge you’ll need to stay ahead of the markets with Morningstar analysis, TradingView charting and more.
*FX spreads apply

We've partnered with Sharesight for portfolio tracking and performance analysis, giving you a clearer view of your returns and overall investment performance. Some advanced function such as tax report may incur charges. Please refer to Sharesight’s pricing page for details.
Visit our CMC Invest help centre for answers to our most frequently asked questions including account and password set up, brokerage fees and share transfers.