Spread bets and CFDs are complex instruments and come with a high risk of losing money rapidly due to leverage. 69% of retail investor accounts lose money when spread betting and/or trading CFDs with this provider. You should consider whether you understand how spread bets and CFDs work and whether you can afford to take the high risk of losing your money.

What is a bull market and what have been the biggest in history?

The terms “bull market” and “bear market​” are seen everywhere in the world of finance, but what do they mean? In this article, we explore what constitutes a bull and bear market, some distinguishing characteristics, and how a trader might position themselves within these different environments.

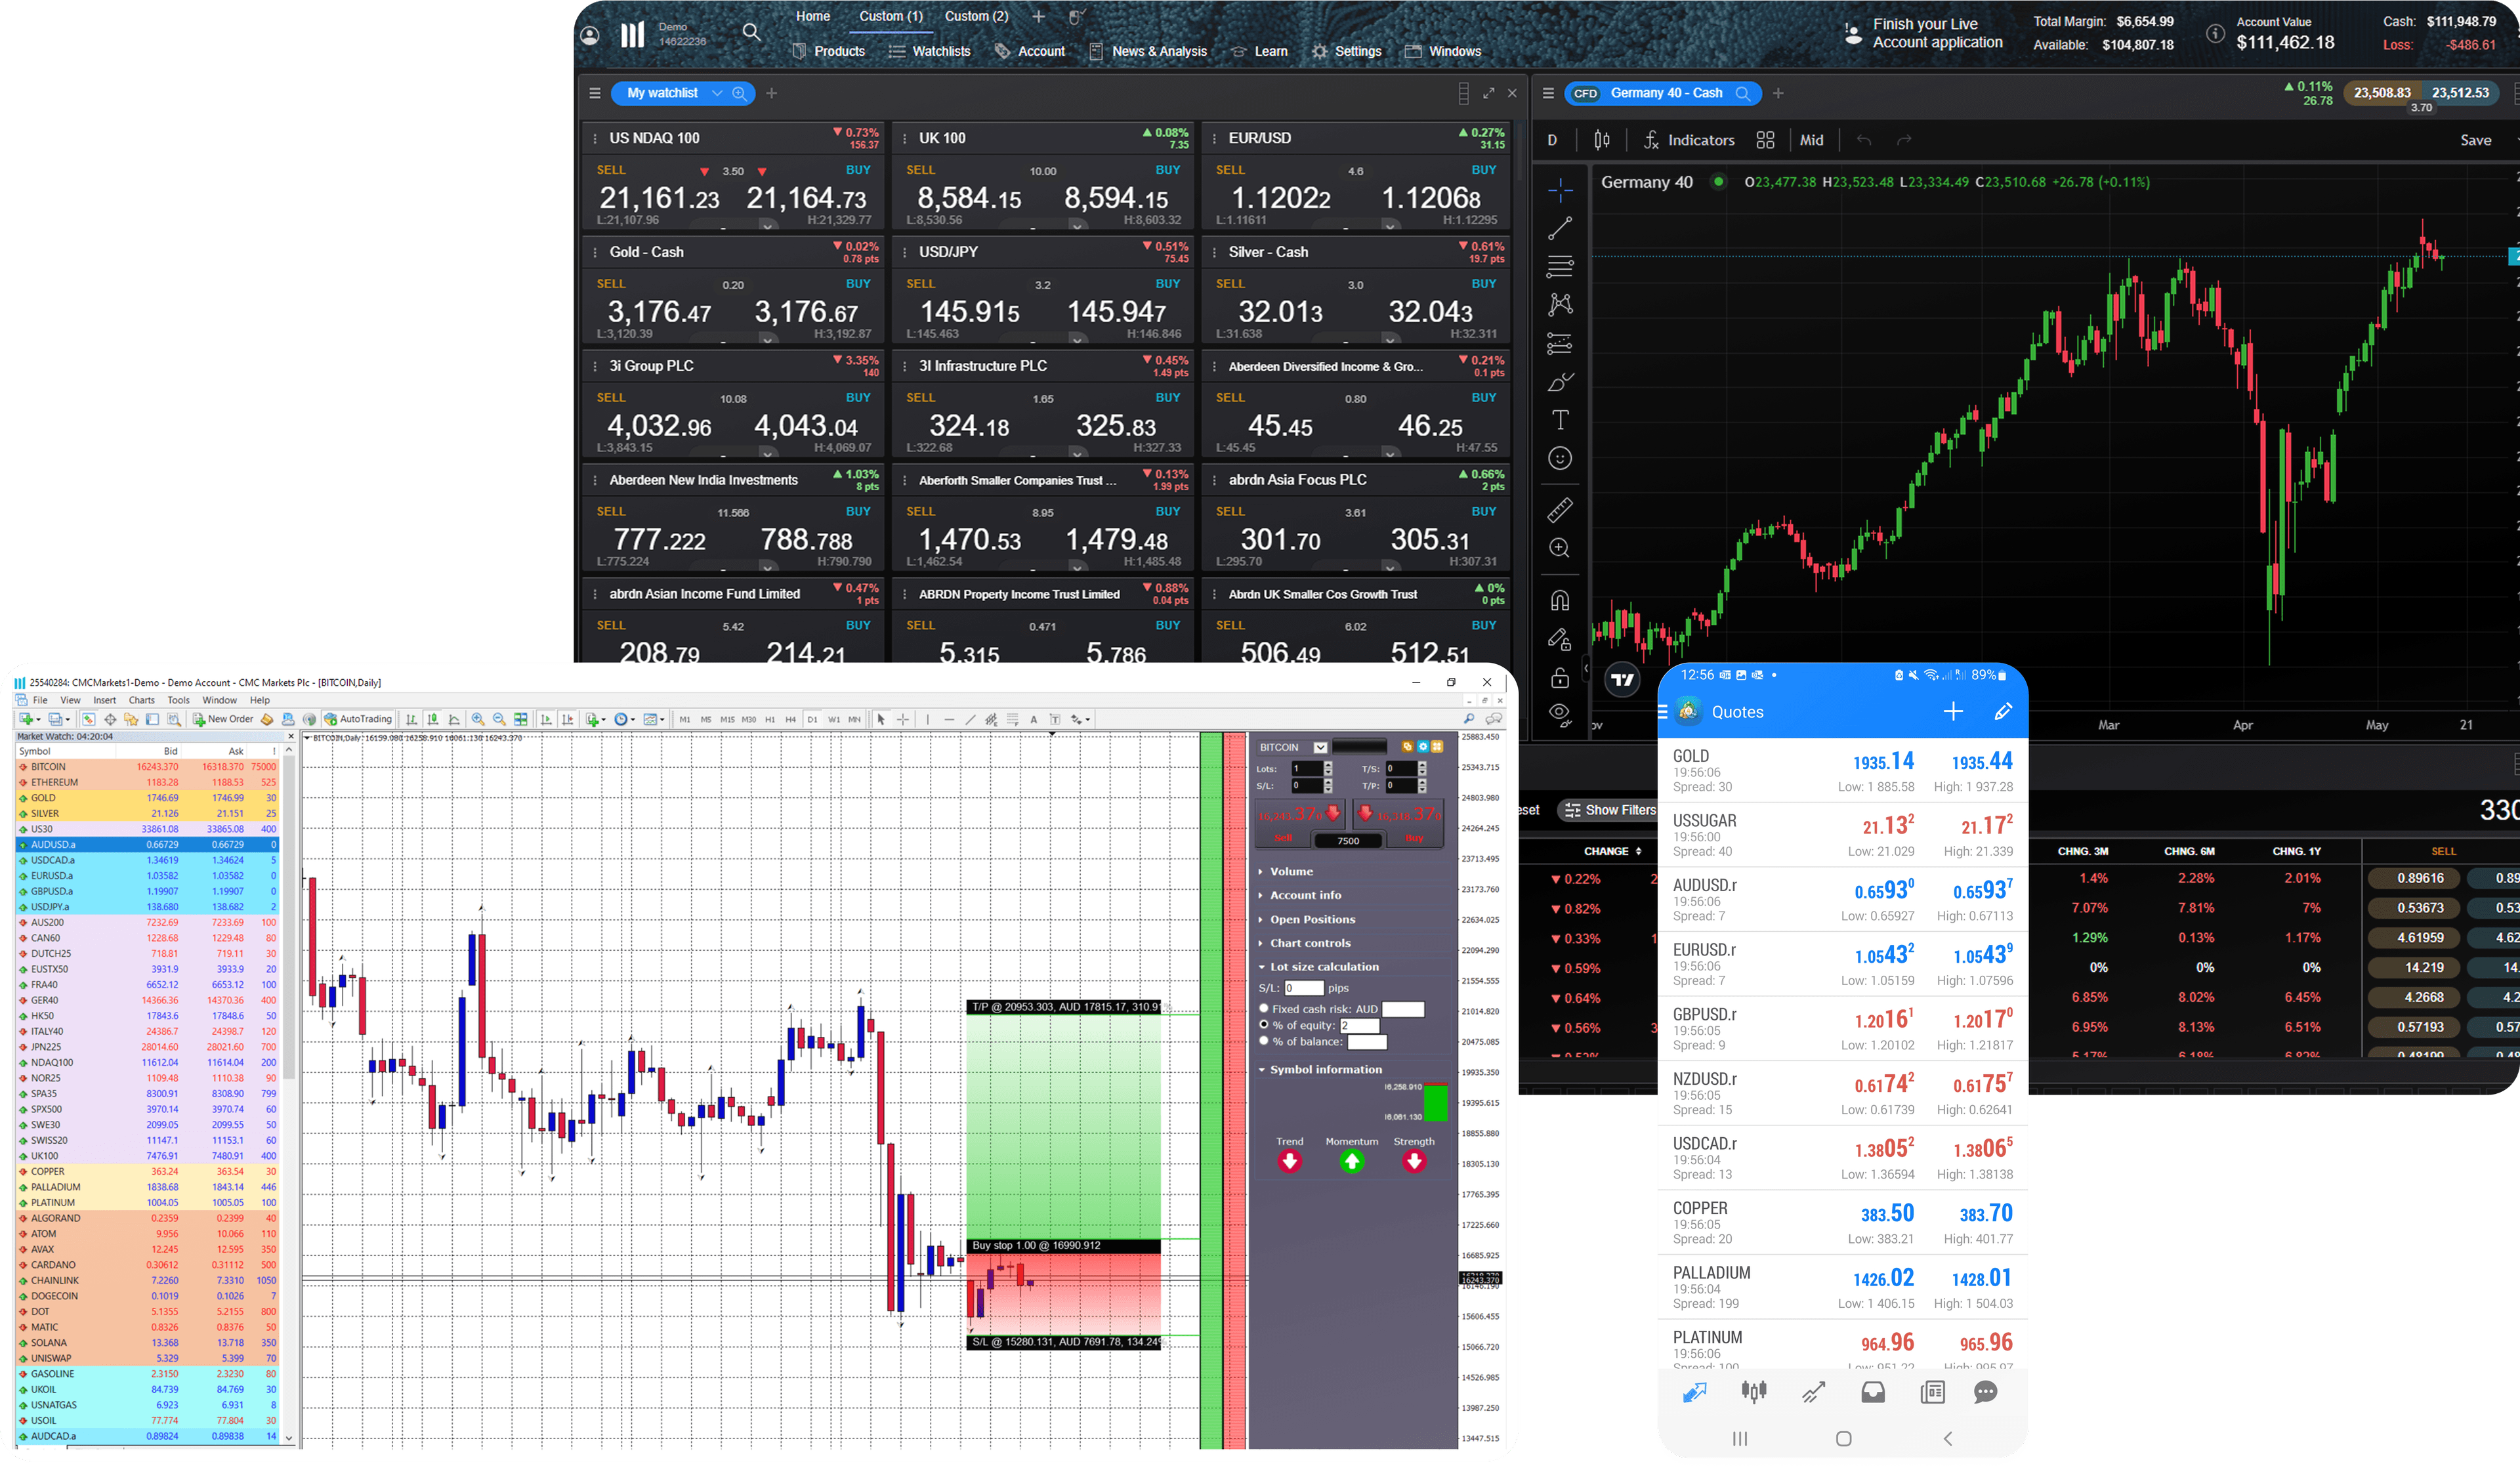
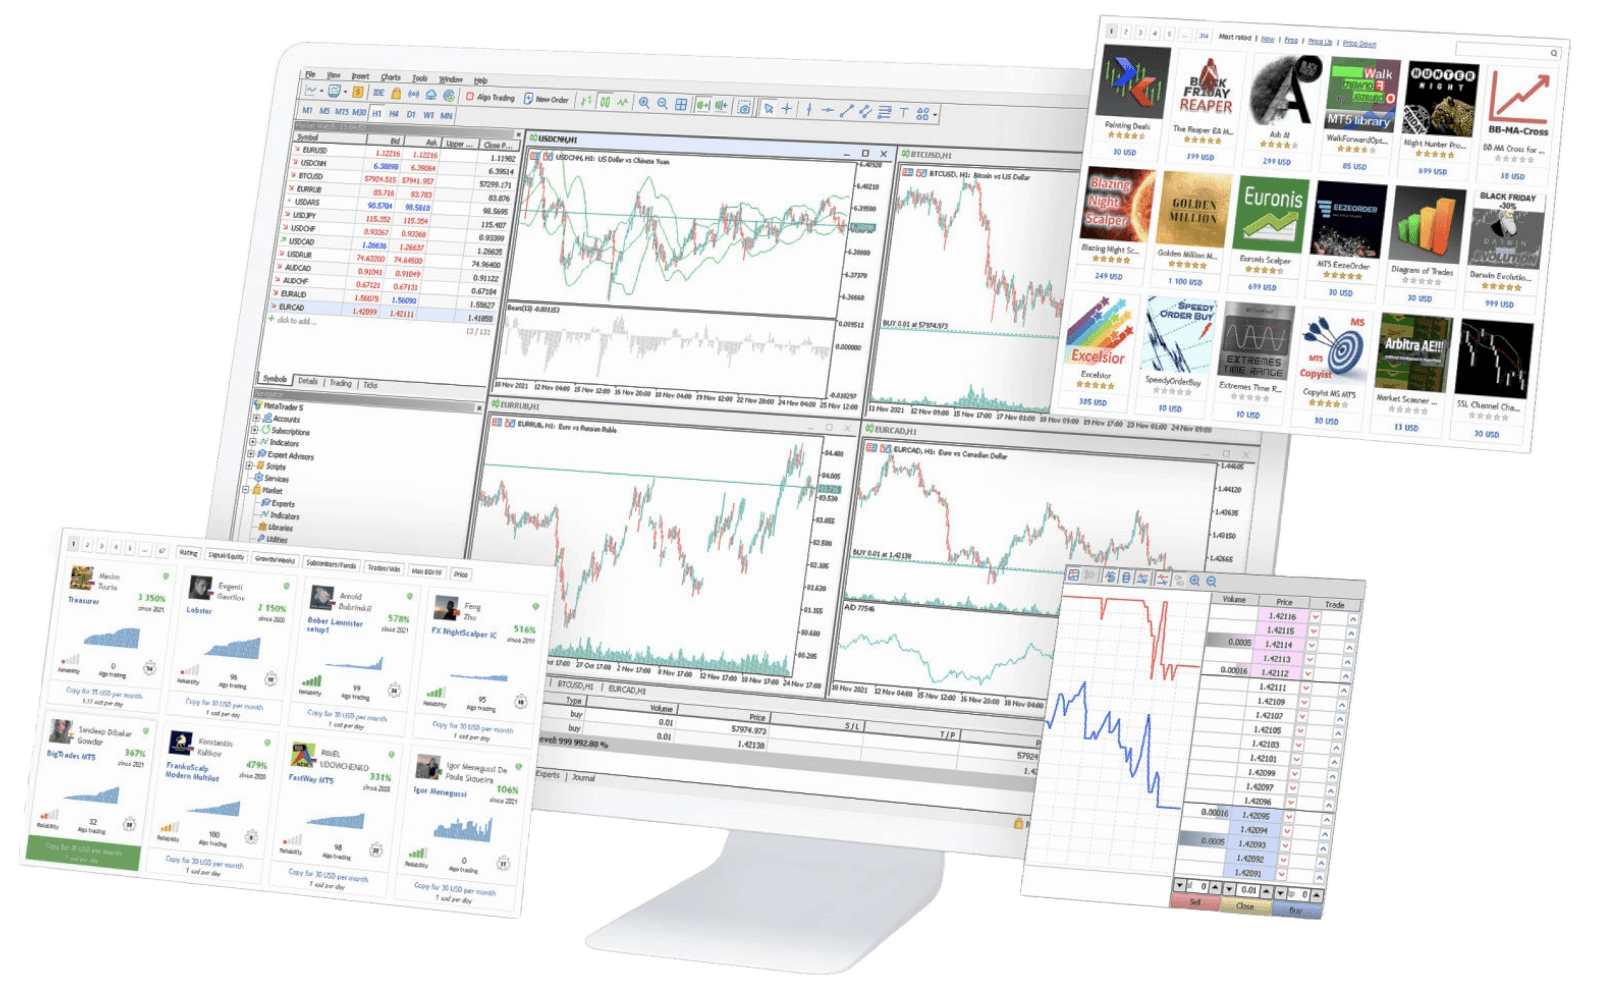
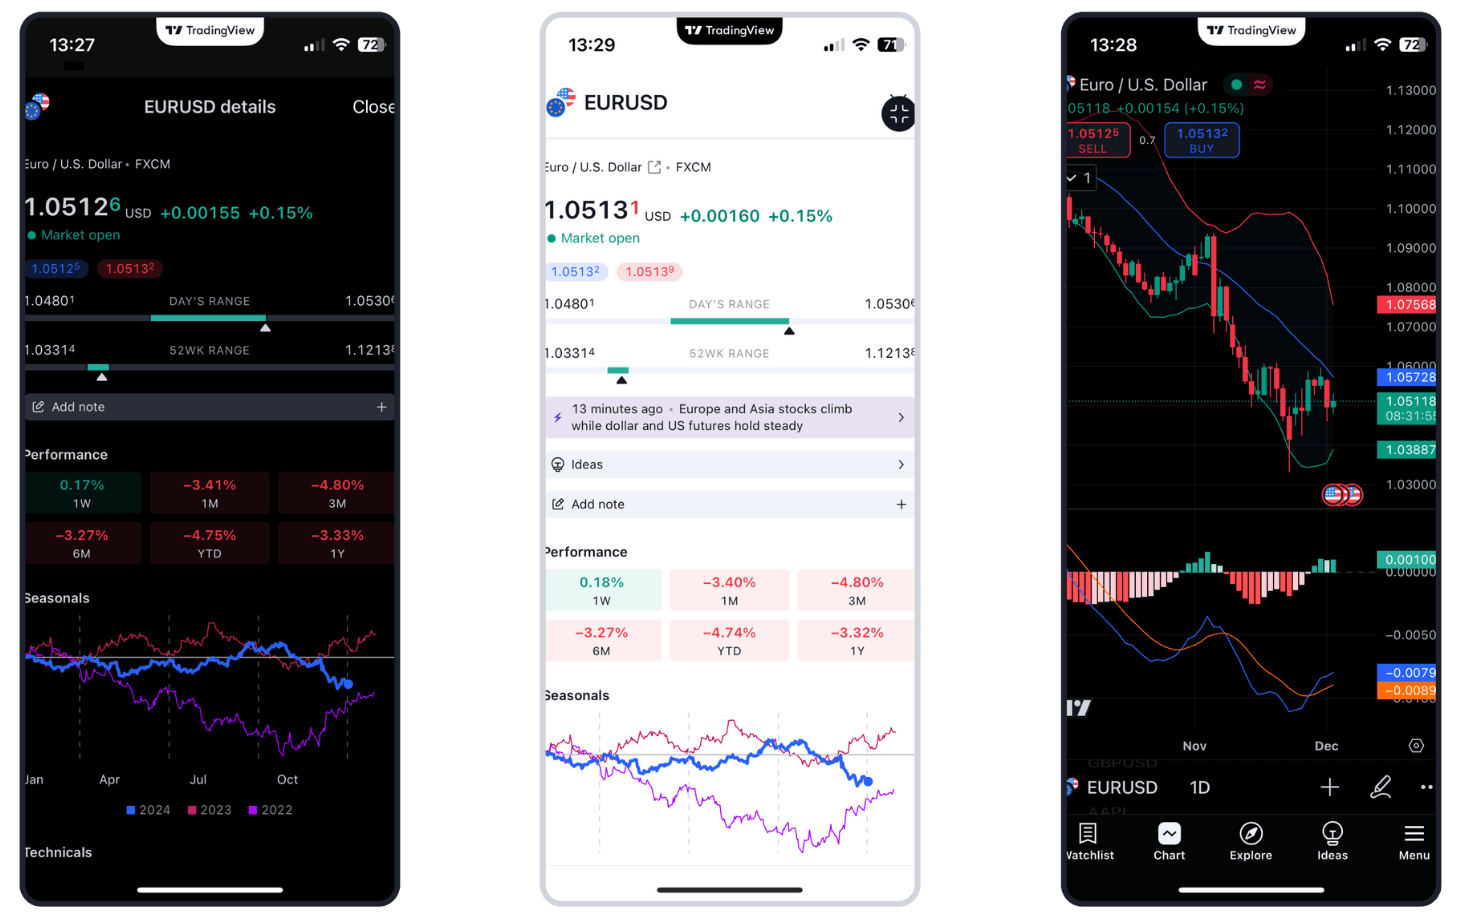
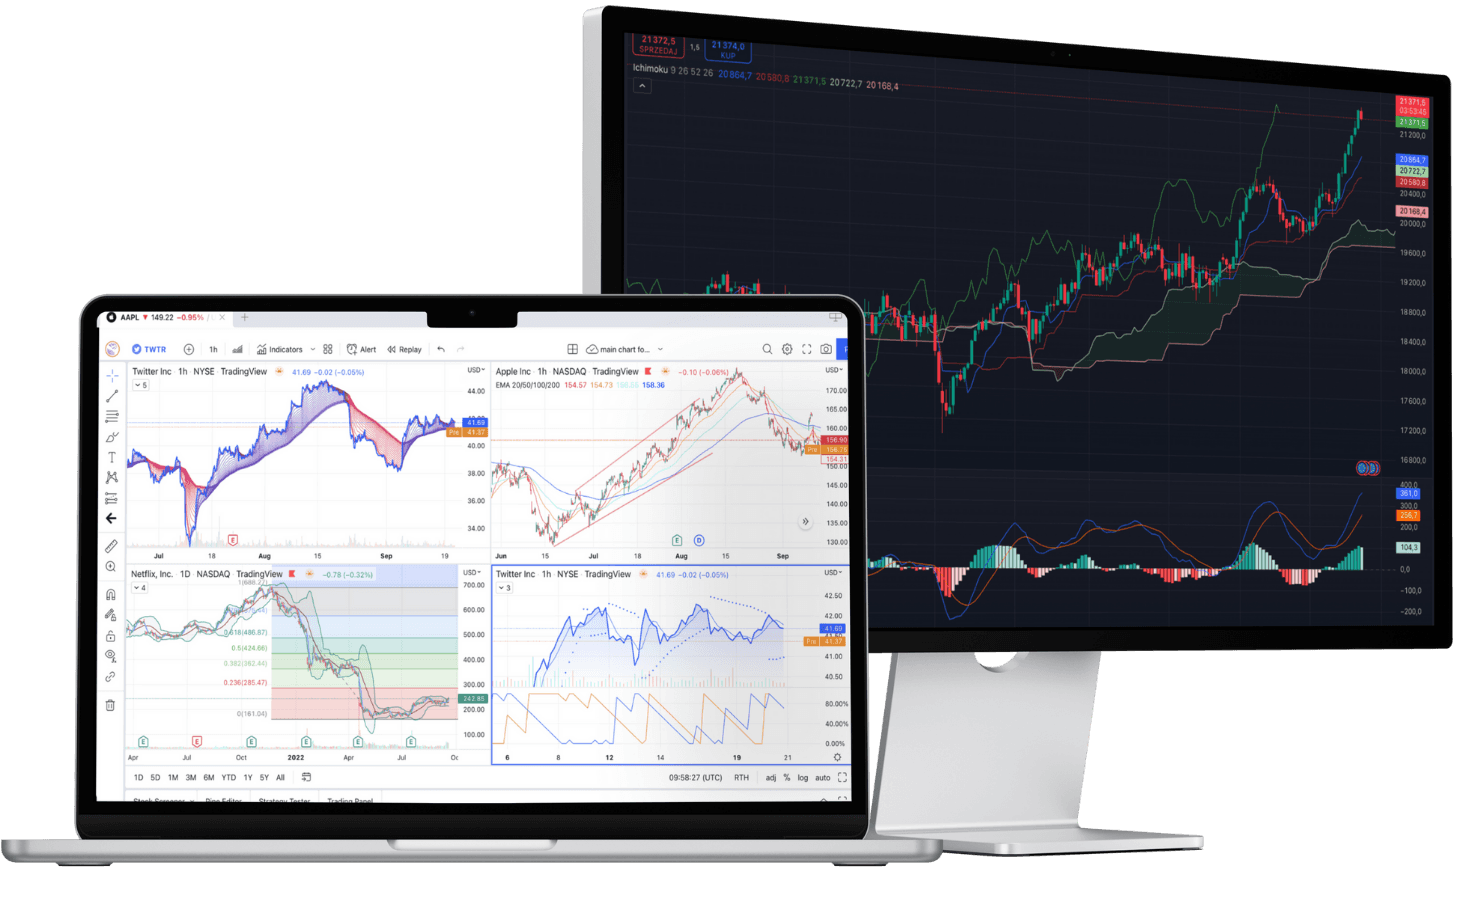
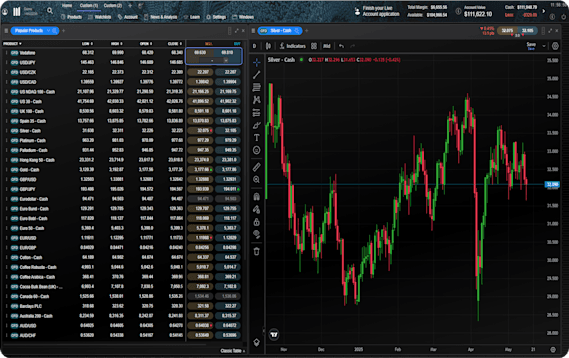
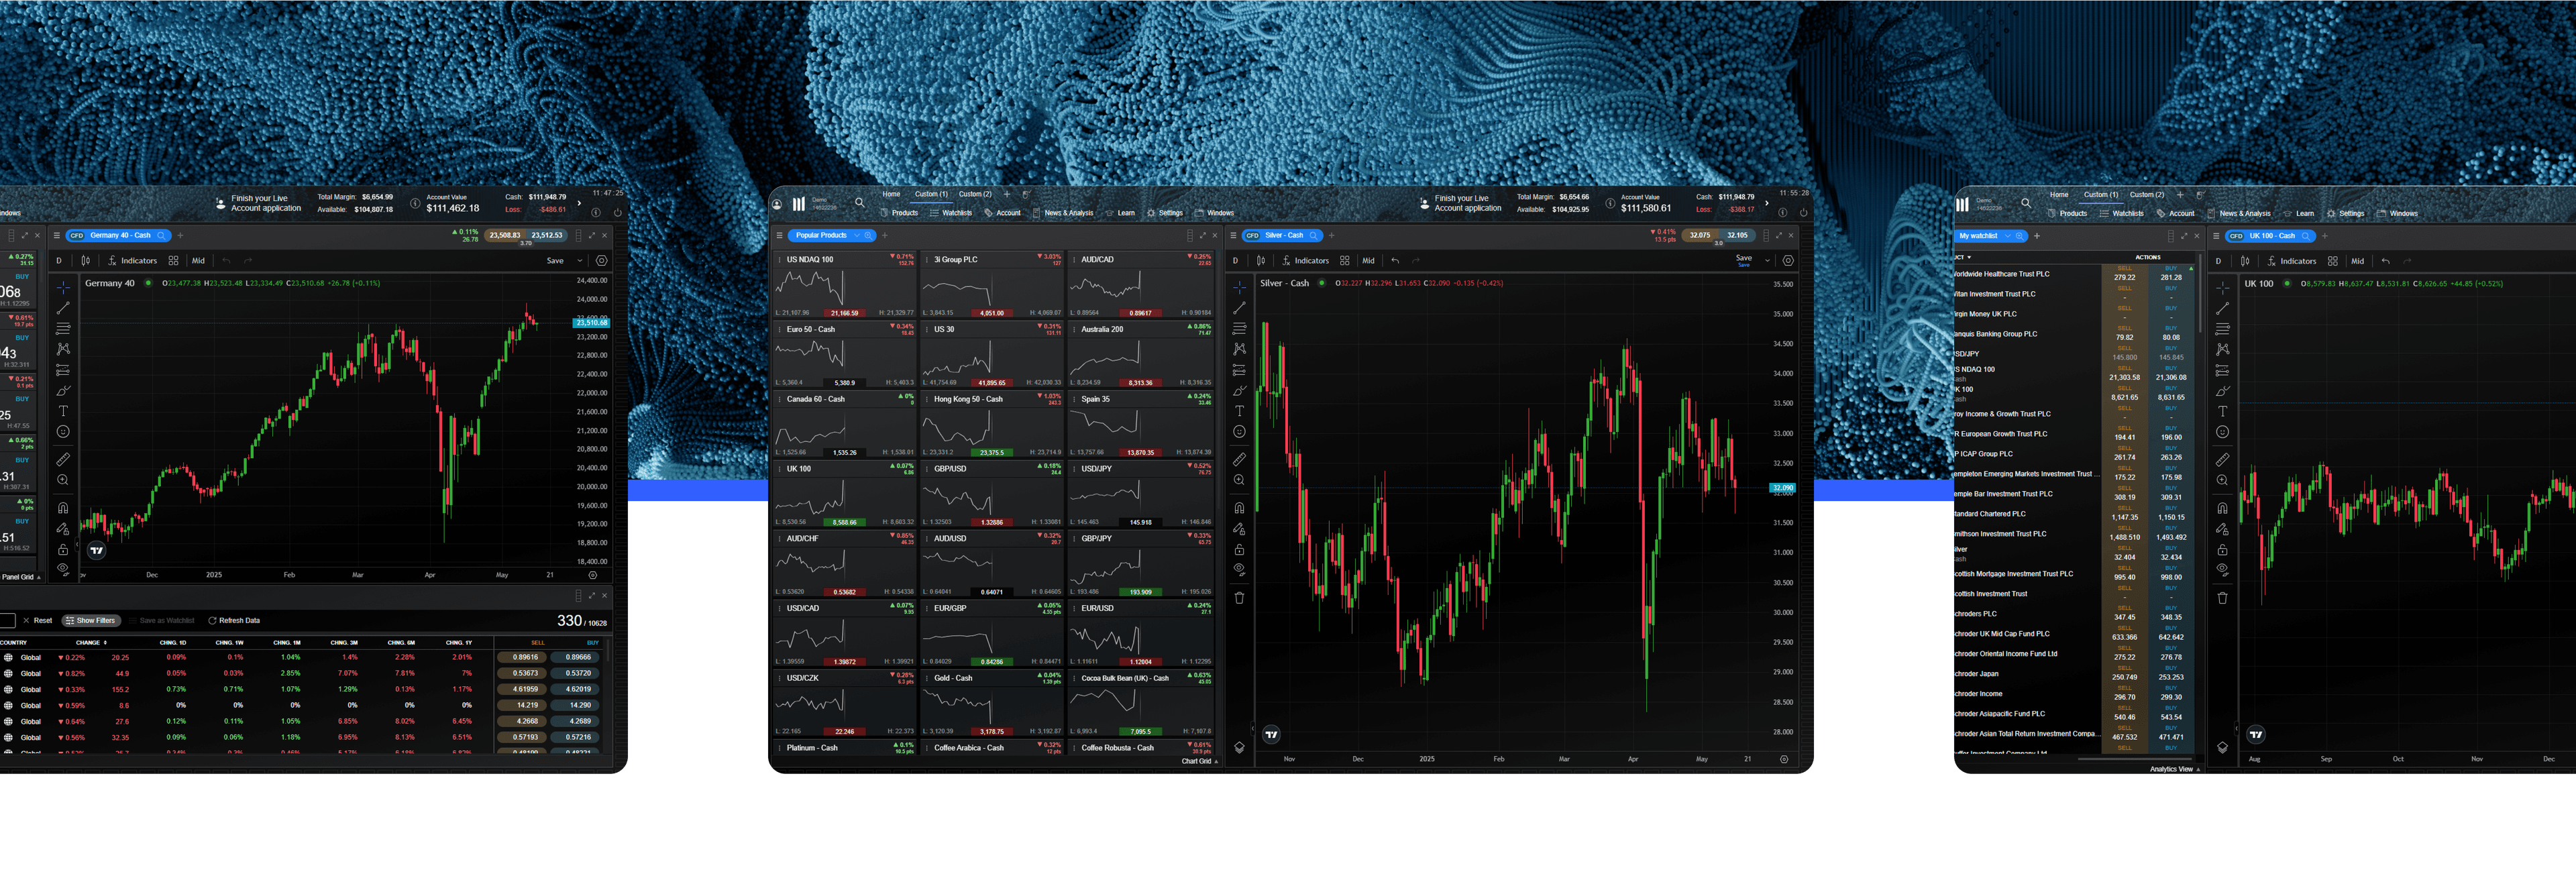
See inside our platform

Get tight spreads, no hidden fees and access to 12,000 instruments.

What is a bull market?

The phrase “bull market” can describe markets in any kind of securities, but typically refers to stock markets. The main characteristic of a bull market is where price in a market trends upwards over an extended period of time — whether months or years. This long-term price movement is known as the secular trend.

Positive trends are driven by high investor confidence in the security to deliver returns. In the case of stock markets, it means investors believe that companies will generate profits and pay dividends. Therefore, bull markets usually coincide with strong periods for their relevant economies, characterised by rising economic indicators such as gross domestic product (GDP) and employment figures.

Bull markets begin and end with bear markets. A bear market is characterised by a 20% fall following a peak. Therefore, it is only possible to identify the end of a bull market retrospectively.

Why is it called a bull or bear market?

It’s uncertain where these names originated. Some commentators believe they derive from the way in which these specific animals confront opponents: bulls push their horns upwards, while bears swipe their paws downwards, reflecting the respective secular trends in each market. Others believe bull refers the New York Stock Exchange’s construction on the site of a 17th century Dutch cattle market.

The phrase “bear market” was thought of by etymologists in reference to a proverb warning against selling “the bear’s skin before one has caught the bear,” symbolising brokers selling borrowed stock whose value they expect to fall (for example, short-selling). Bulls, meanwhile, are thought to symbolise purchases expected to increase in value.

How can we tell if we’re in a bull market?

There is no official definition of a bull market. Generally, though, a bull market is considered a period of time in which prices rally 20% or more following their near-term trough. Bull markets also feature high demand for a security (the share market, for example) relative to supply, as more investors look to purchase and hold assets in the expectation of profits. Market commentary tends to be optimistic in tone, with investor confidence rising.

How can you tell if a bull market has ended?

Bull markets are said to end when prices fall 20% from their near-term peak. Investors and analysts therefore cannot know when a bull market will end until after the event.

This 20% fall signals the onset of a bear market. These typically accompany recessions, falling investor confidence, reduced corporate profits and rising unemployment, which are also traits of a market crash​.

There are many factors that can cause bull markets to end. Five outlined by Kiplinger are:

  • High inflation
  • Rising interest rates
  • Geopolitical instability
  • Recession
  • Overvaluation

For example, the Nasdaq Composite was hugely overvalued at the end of the dot-com bubble in 1999, which proceeded the crash in 2000.

Psychological stages that drive a bull market

Fund manager John Templeton said that “bull markets are born on pessimism, grow on scepticism, mature on optimism and die on euphoria.”

Since bull markets begin with price increases from a trough, they immediately follow bear markets, when pessimism is highest. Templeton believed “the time of maximum pessimism is the best time to buy, and the time of maximum optimism is the best time to sell.” Templeton bought $100 worth of each of the cheapest stocks available to him at the outset of the Second World War, which delivered average returns of 400% over the next four years. During this phase, also known as accumulation, early adopters exploit low stock prices to acquire cheap assets.

Scepticism: As prices rise, scepticism and talk of false recovery or false breakouts are abound. Following a bear market, many investors are wary of being stung. As prices rally, indicators such as employment lag help to sustain sceptical investor sentiment​​ while the early majority join the market.

Optimism: This scepticism eventually matures into optimism once the late majority are convinced of the bull run’s authenticity. This can, however, take years. The post-crisis bull run, from the end of the 2008 global financial crisis until the coronavirus pandemic, was the longest bull market in history but was shrouded in scepticism for most of its duration.

During the optimistic stage, positive market sentiment lifts prices by increasing demand for securities. Investors are confident their investments will yield returns, so will pay (and demand) higher prices for them.

Euphoria: This emerges when investors are so overconfident in the ability of securities to generate returns that prices inflate disproportionately. This over exuberant euphoria leads to a crowded trade where there are few buyers left, and in turn results in an eventual decline in prices where early investors take profits. This is also referred to as an economic bubble​​. This leads to pessimism, a rush for the exits and a restarting of the bull/bear cycle.

Trade on a bull market with us

What is the average length of a bull market?

According to market research firm InvesTech Research, the average length of bull markets since 1932 has been 3.8 years. However, there can be significant variation. The S&P 500’s longest bull market lasted 11 years, from 2009 to 2020, while its shortest, beginning in October 1966, lasted just over two.

Bull markets generally last longer than bear markets, and gains in bull markets usually outweigh losses in bear markets.

Biggest bull markets in history

1. The post financial crisis bull run

The global financial crisis of 2008 was, at the time, the most severe market crash since the Great Depression. Out of its ashes was born the longest bull market in history.

Between March 2009 and the same month 11 years later, the S&P 500 gained over 400.5% at a CAGR (compound annual growth rate) of 16%. This growth rate is relatively low compared to other bull runs, thanks to lingering scepticism following the financial crisis which may, ironically, have elongated the run by staving off euphoria. The run ended in March 2020 when the coronavirus pandemic ravaged global markets.

2. The Roaring 1990s

The 1990s saw the largest total gain of any bull market in S&P 500 history, with the index gaining 417.0% in just over 113 months. With the end of the Cold War in 1991 and the onset of the digital era, the US entered its longest period of uninterrupted growth in market history.

Euphoria around internet stocks led to the dot-com bubble, with Federal Reserve chairman Alan Greenspan referring to the wild investments in the sector as “irrational exuberance.” This bubble burst in March 2000. By October 2002, the S&P 500 fell 49%.

3. Post-war boom

In the post-war years, US president Eisenhower balanced the US federal budget, and consumerism proliferated. Americans purchased more goods, particularly cars and televisions, and had more children, leading to what is called the Baby Boom.

The S&P 500 gained 266% between June 1949 and August 1956, at a CAGR of 20%, before Eisenhower’s heart attack and the Soviet Union’s invasion of Hungary curtailed post-war optimism.

4. The Reagan era

While the Reagan-era bull run was shorter-lived than, say, the expansion during the 1970s under US president Richard Nixon, it delivered huge returns on the S&P 500. In just over five years, from August 1982, the index gained 229%, at a CAGR of 27% — a faster growth rate than any bull run since the Second World War.

President Reagan’s fiscal policy, known as Reagonomics, hinged on the Economic Recovery Tax Act (ERTA), which reduced marginal tax rates in order to incentivise production. This stimulation of economic activity is known as supply-side economics. The run ended suddenly on 19 October 1987, known as Black Monday, when the Dow Jones Industrial Average fell 22.6% in a day.

What is the bond bull market?

All the above bull markets are stock market runs. However, history’s longest bull market was in US treasury bonds, ending in March 2021 after 40 years of increasing bond prices.

Many of the stock runs in the meantime resulted from the strong performance of the bond market​​. High bond prices mean low bond yields. This in itself may incentivise investors to explore other financial markets (like stock markets), but the effect is magnified because low bond yields mean low interest rates. This means that money is cheap to borrow, providing more capital to fund investments in stocks.

Despite having withstood the dot-com bubble and the global financial crisis in its run since the early 1980s, the Bloomberg Barclays Long Treasury Total Return Index fell 22% between March 2020 and March 2021, entering a bear market, due to the impact of the coronavirus pandemic.

Strategies for trading during a bull market

‘Buy’ and ‘hold’ strategy

Optimism and investor confidence accompanying bull markets permit a buy and hold strategy: purchasing a stock and holding it, potentially to sell later once its price has increased. Purchasing (or shorting) stocks depending on the direction their price is trending is known as trend-following​​, or trend trading.

A buy and hold/trend following strategy involves purchasing additional shares as stock prices rise. This approach increases investors’ risk exposure over time.

Retracement additions (buying the dip​)

Bull market prices trend upwards in the long term, but individual securities’ prices will rise and fall throughout, even if the overall trendline is upwards. A short period of falling prices for a security is known as a retracement. A fall of 10% or more is called a market correction​​.

Many investors decide to purchase shares during retracements, assuming that the bull market will continue, and the price will increase in the future, thus giving the purchaser an expected discount on the shares.

Full swing trading

Swing trading is a medium-term strategy using short-selling and other active investment strategies to maximise returns over short time periods. Read our full guide on swing trading​​.

FAQ

Bull versus bear market: what is the difference?

Stock prices tend to increase in bull markets and fall in bear markets, where each begins with a 20% increase/fall from a near-term trough/peak. Learn more about trading in a bear market.

What can the yield curve tell us about a bull market?

The US bond yield curve is used by investors as a predictor of inflation and the overall health of the economy. A steepening yield curve generally indicates a prosperous economy and a buoyant stock market. An inverted yield curve is a sign of an upcoming recession. Learn how to invest in bonds​.

How do I trade a bull market?

Trading via derivatives such as spread bets and CFDs on assets that you expect to increase in value is the simplest way to trade a bull market. Both short and long-term strategies can be practised on our trading platform, so open an account​ to get started using our products.

How do interest rates affect bull markets?

Low interest rates mean that borrowing is cheap, which allows greater investment and fuels bull markets.

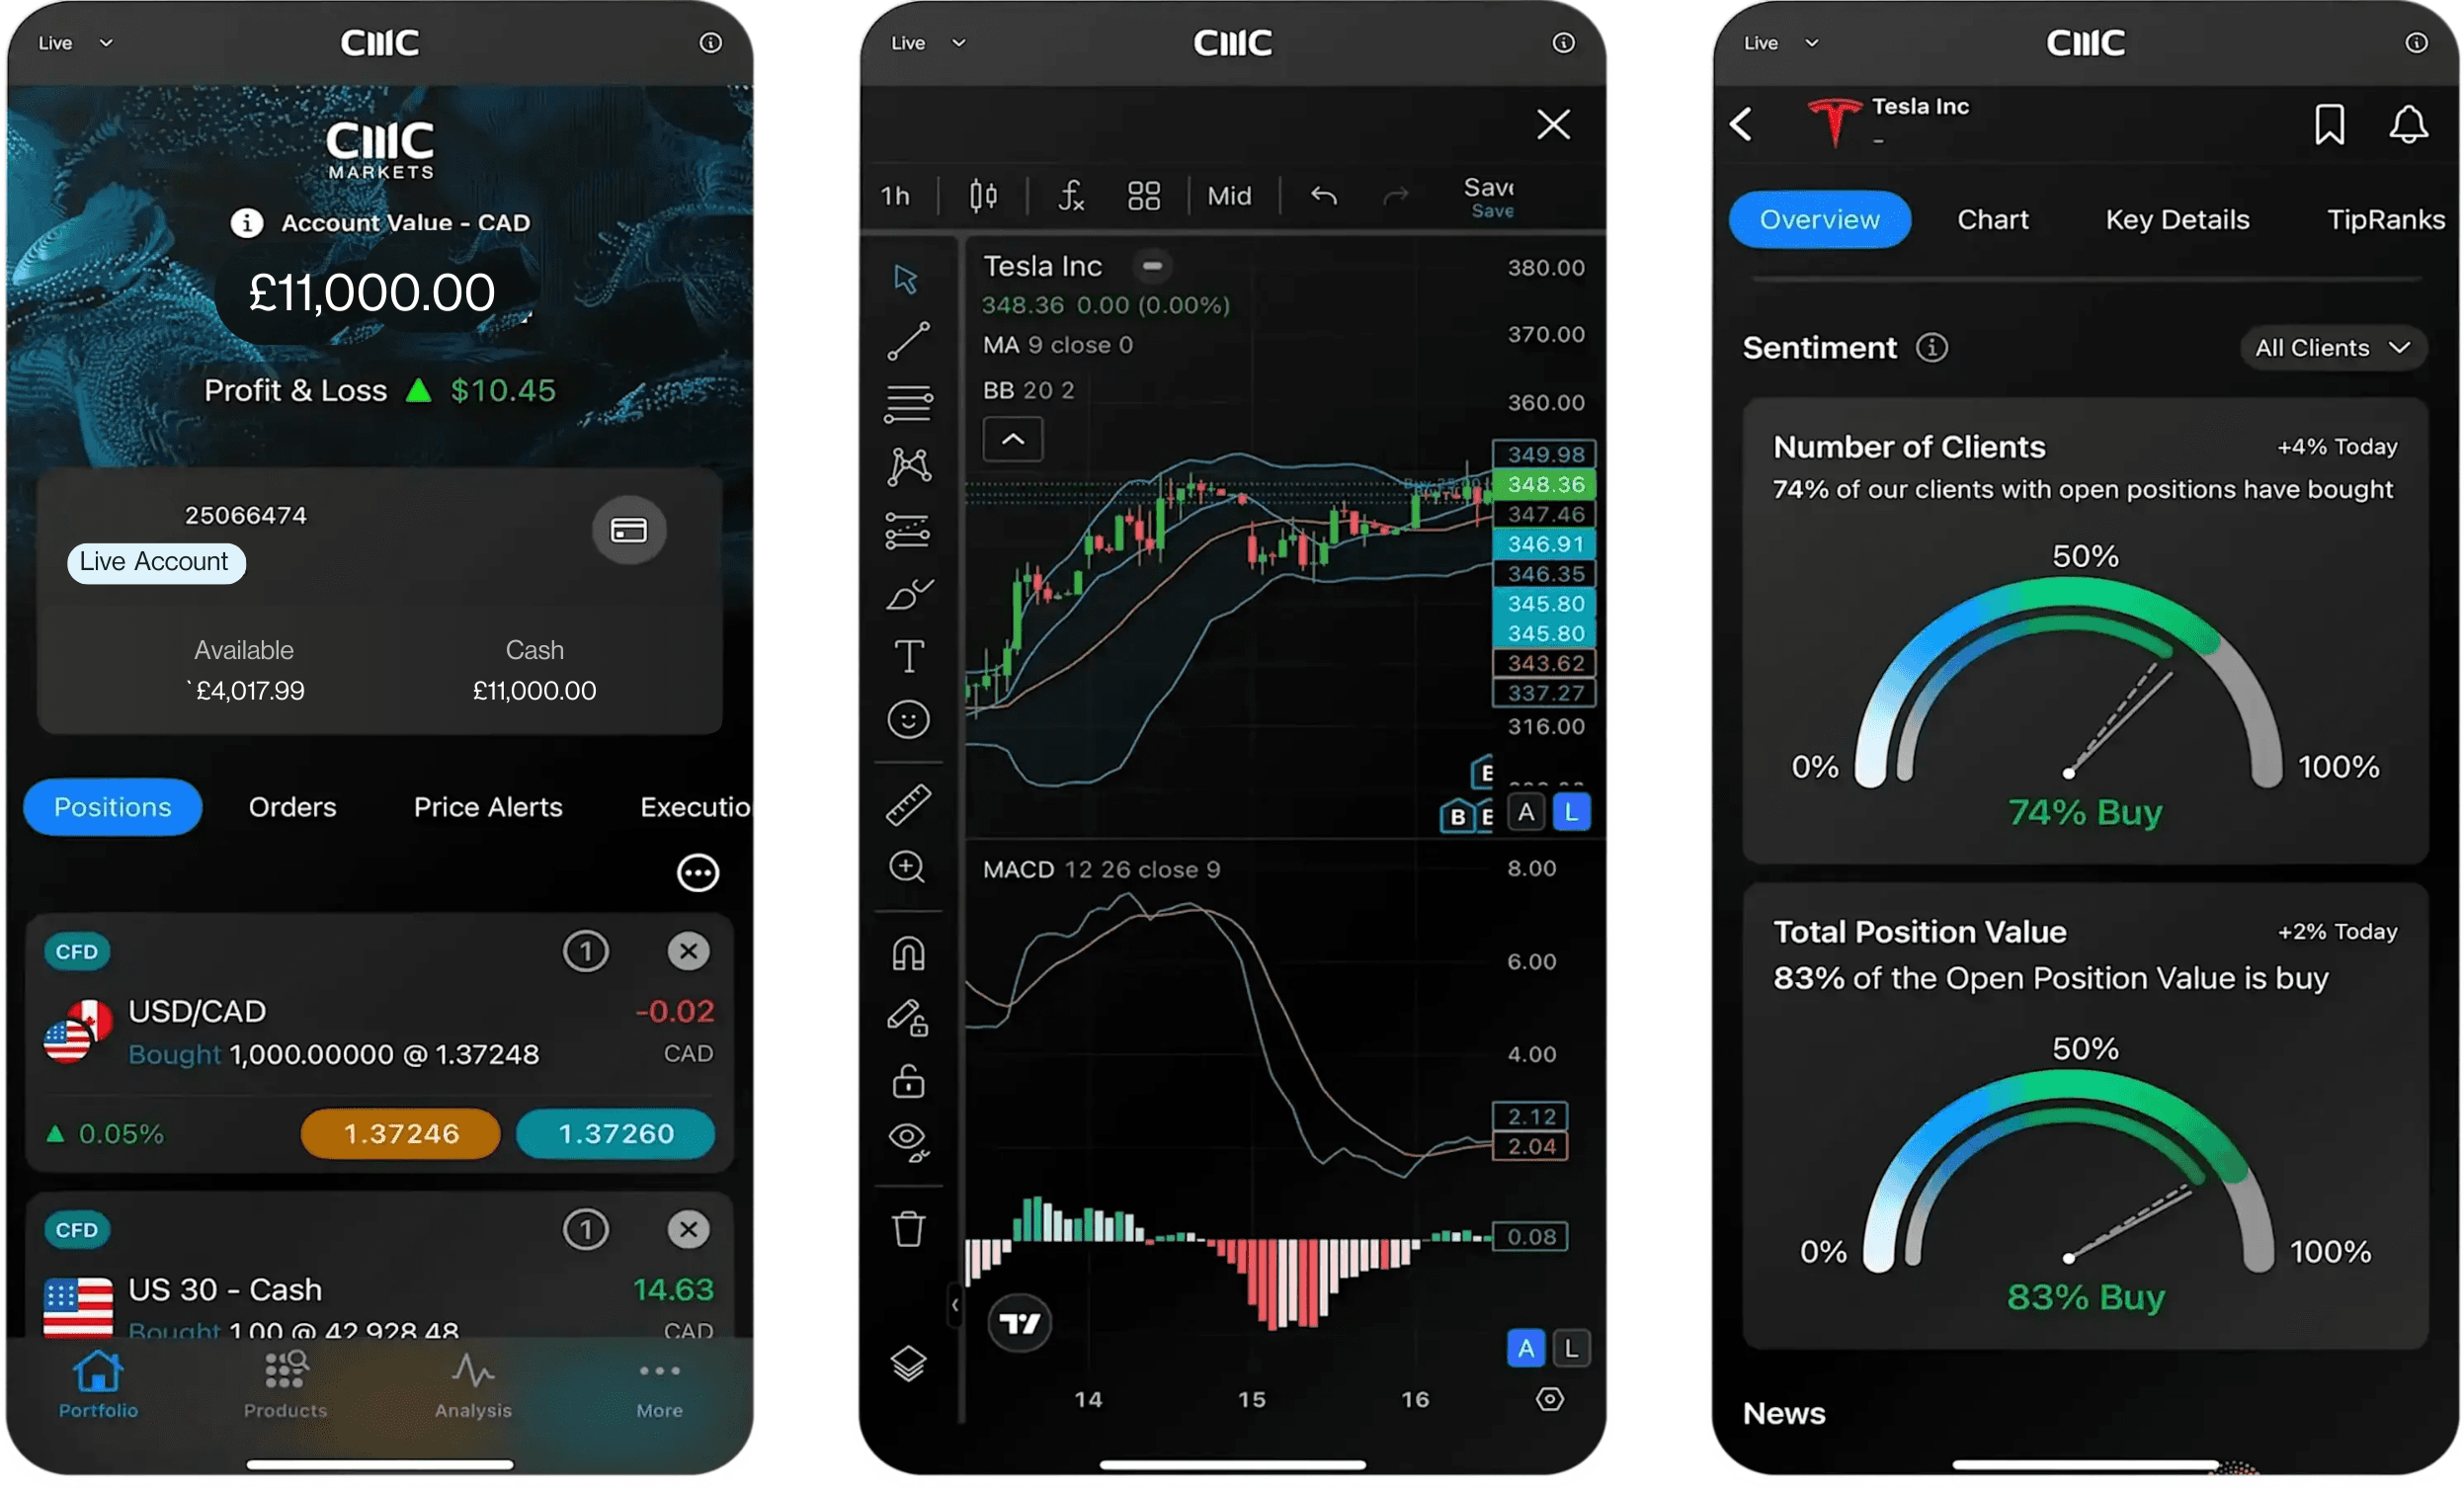
Trade bull markets on the go

Seamlessly open and close trades, track your progress and set up alerts

Disclaimer: CMC Markets is an execution-only service provider. The material (whether or not it states any opinions) is for general information purposes only, and does not take into account your personal circumstances or objectives. Nothing in this material is (or should be considered to be) financial, investment or other advice on which reliance should be placed. No opinion given in the material constitutes a recommendation by CMC Markets or the author that any particular investment, security, transaction or investment strategy is suitable for any specific person. The material has not been prepared in accordance with legal requirements designed to promote the independence of investment research. Although we are not specifically prevented from dealing before providing this material, we do not seek to take advantage of the material prior to its dissemination.