Spread bets and CFDs are complex instruments and come with a high risk of losing money rapidly due to leverage. 71% of retail investor accounts lose money when spread betting and/or trading CFDs with this provider. You should consider whether you understand how spread bets and CFDs work and whether you can afford to take the high risk of losing your money.

What is a stock market bubble and how do I trade it?

Stock market bubbles happen when stocks continue climbing in price, eventually becoming overvalued. Learn from stock market bubbles of the past, why they can be unpredictable and understand what characterises a highly speculative financial market.

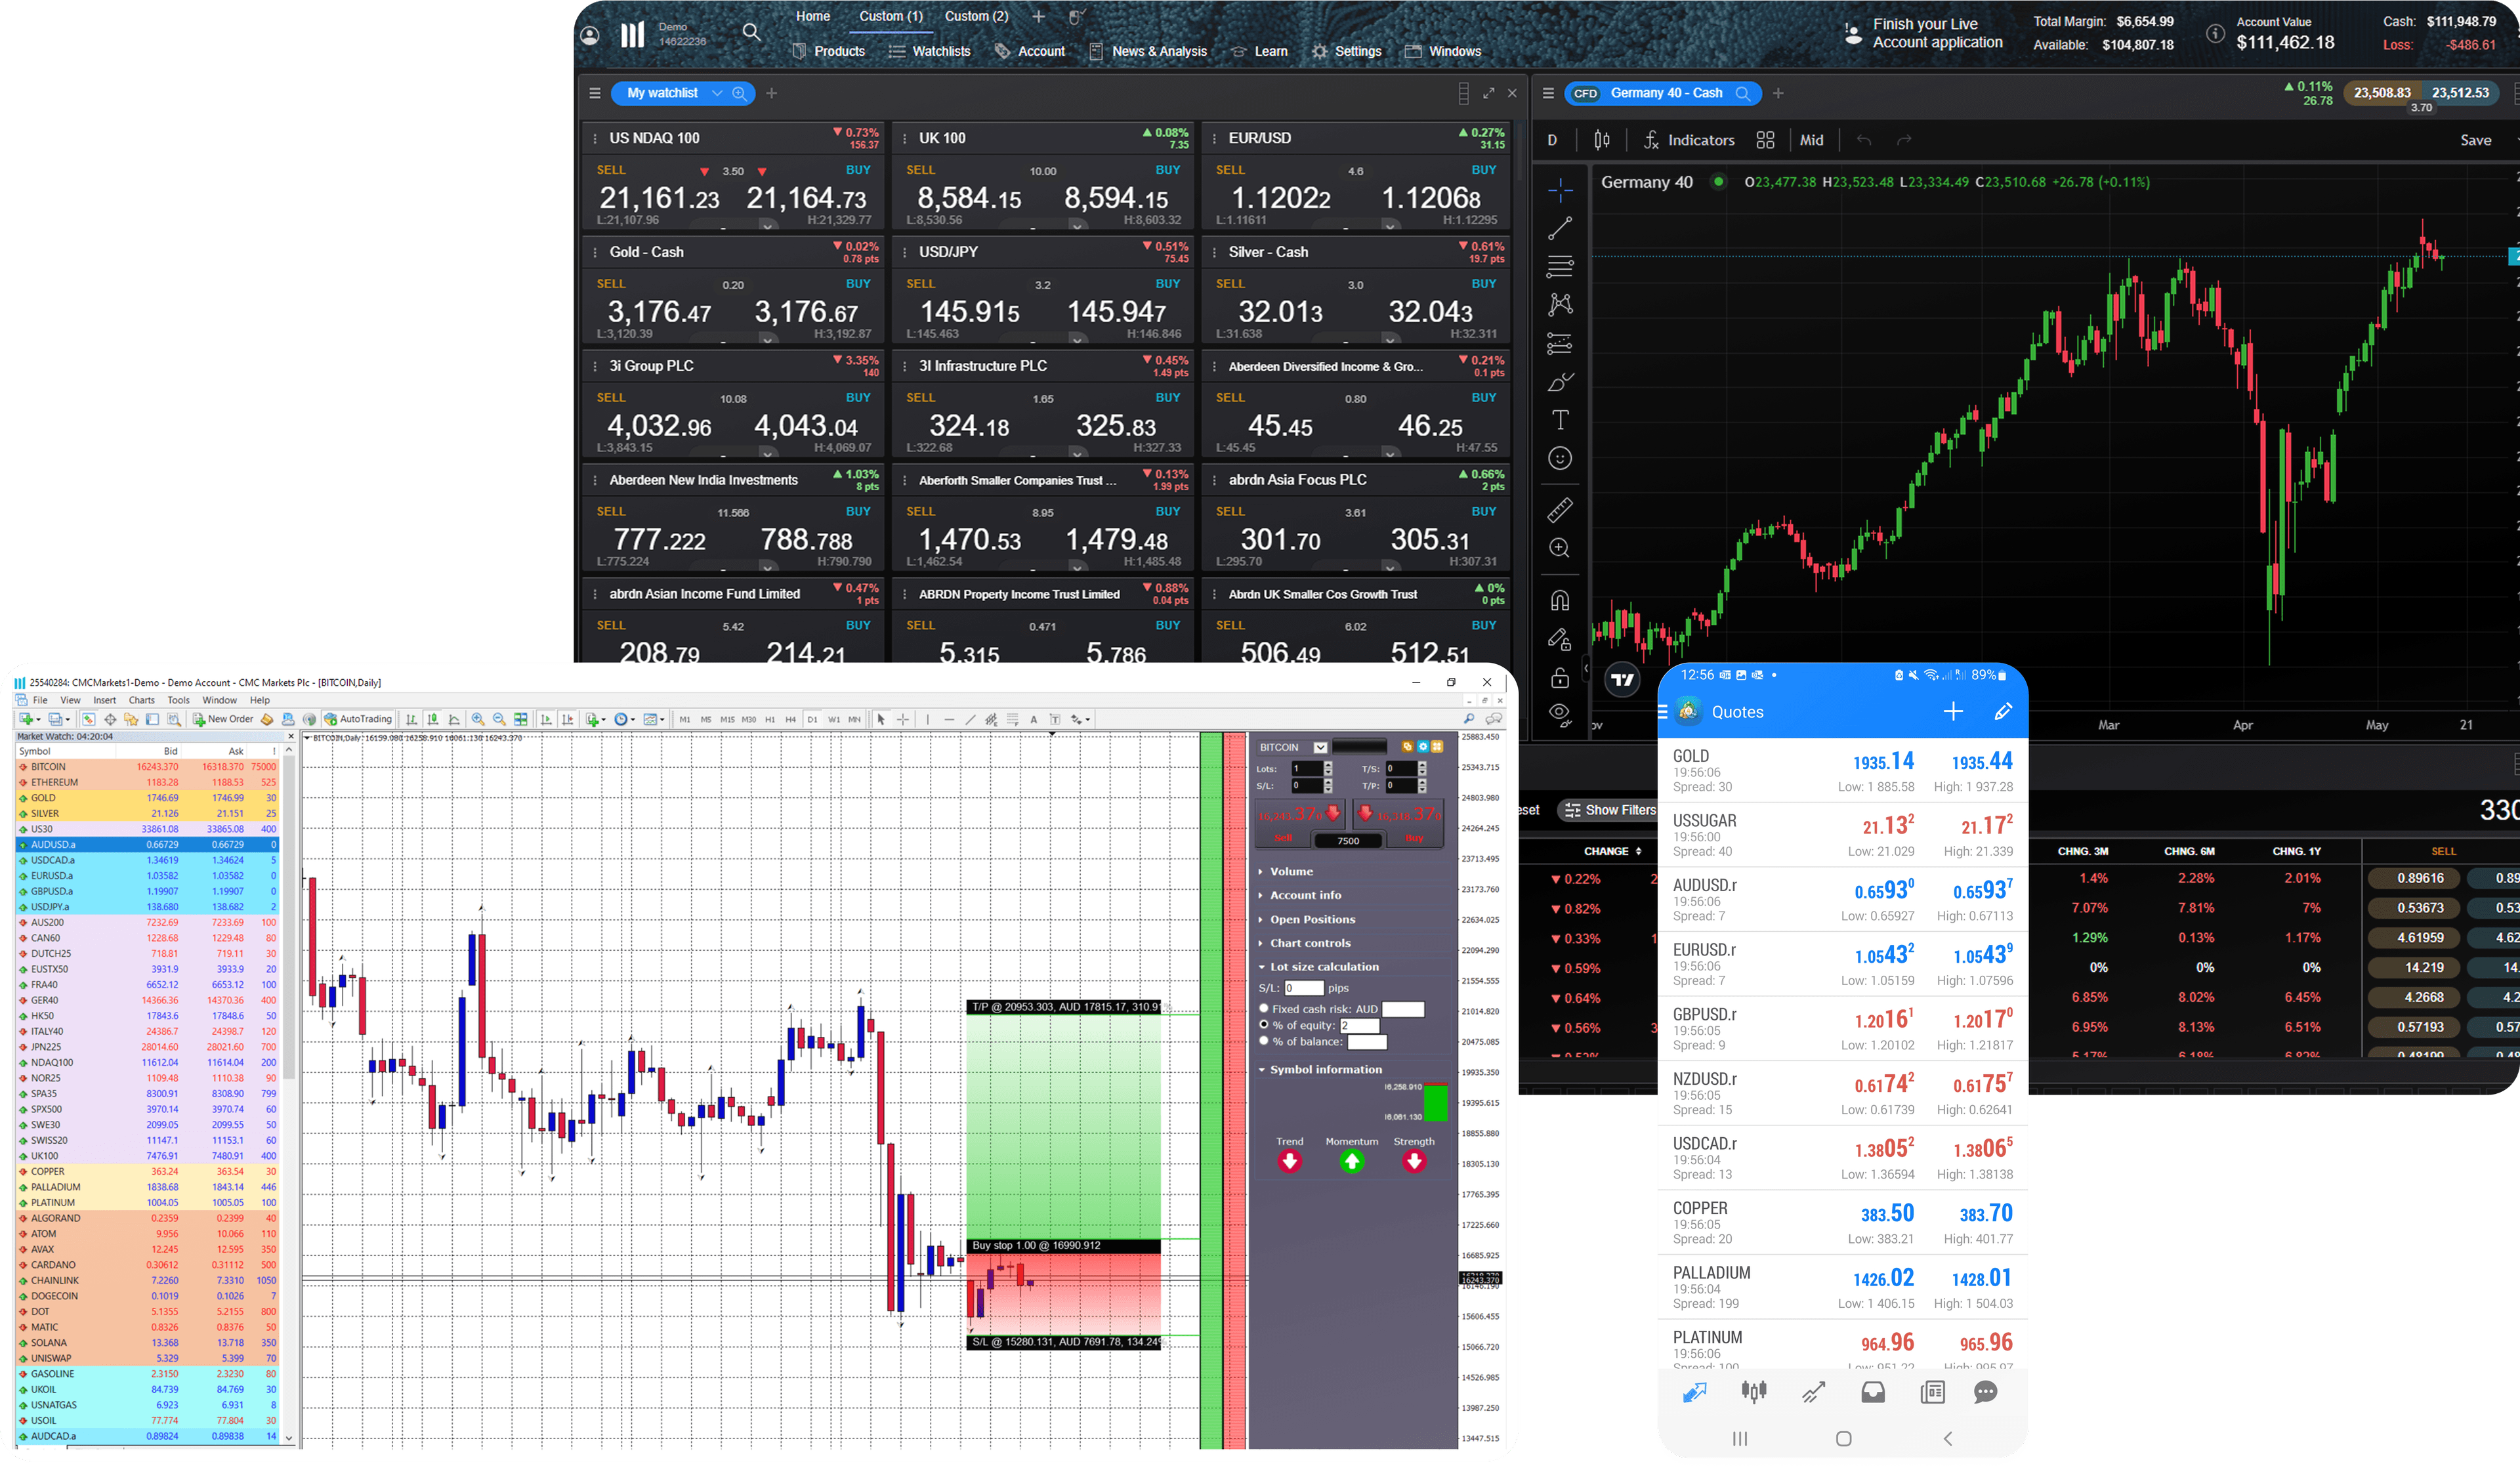
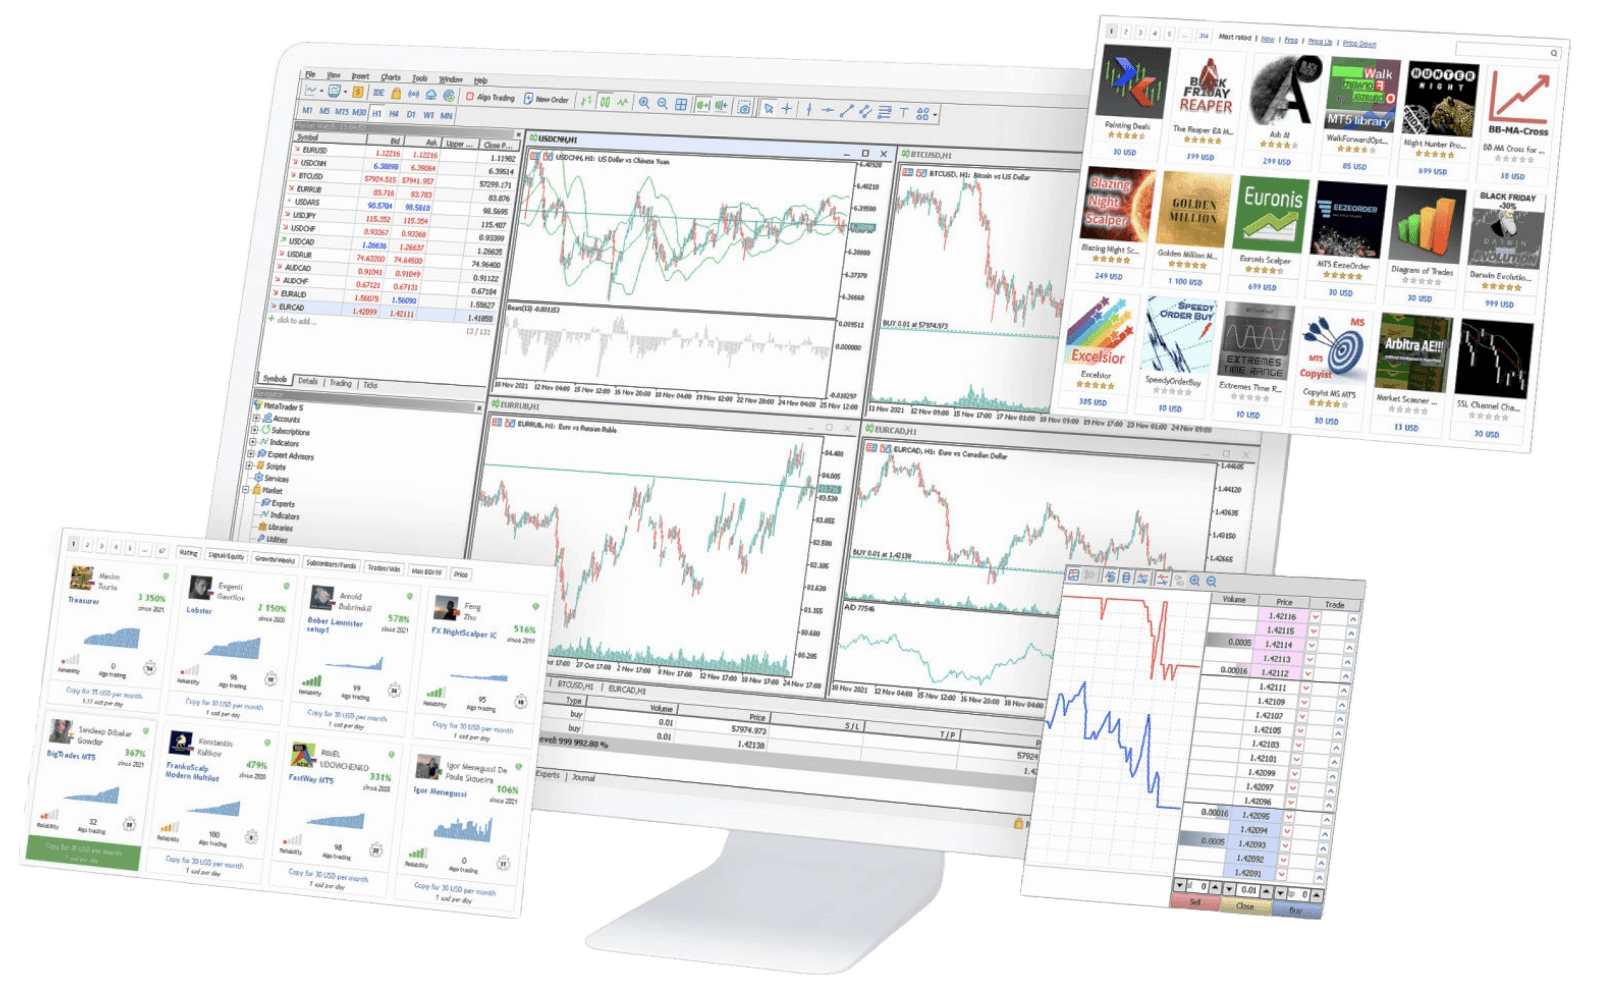
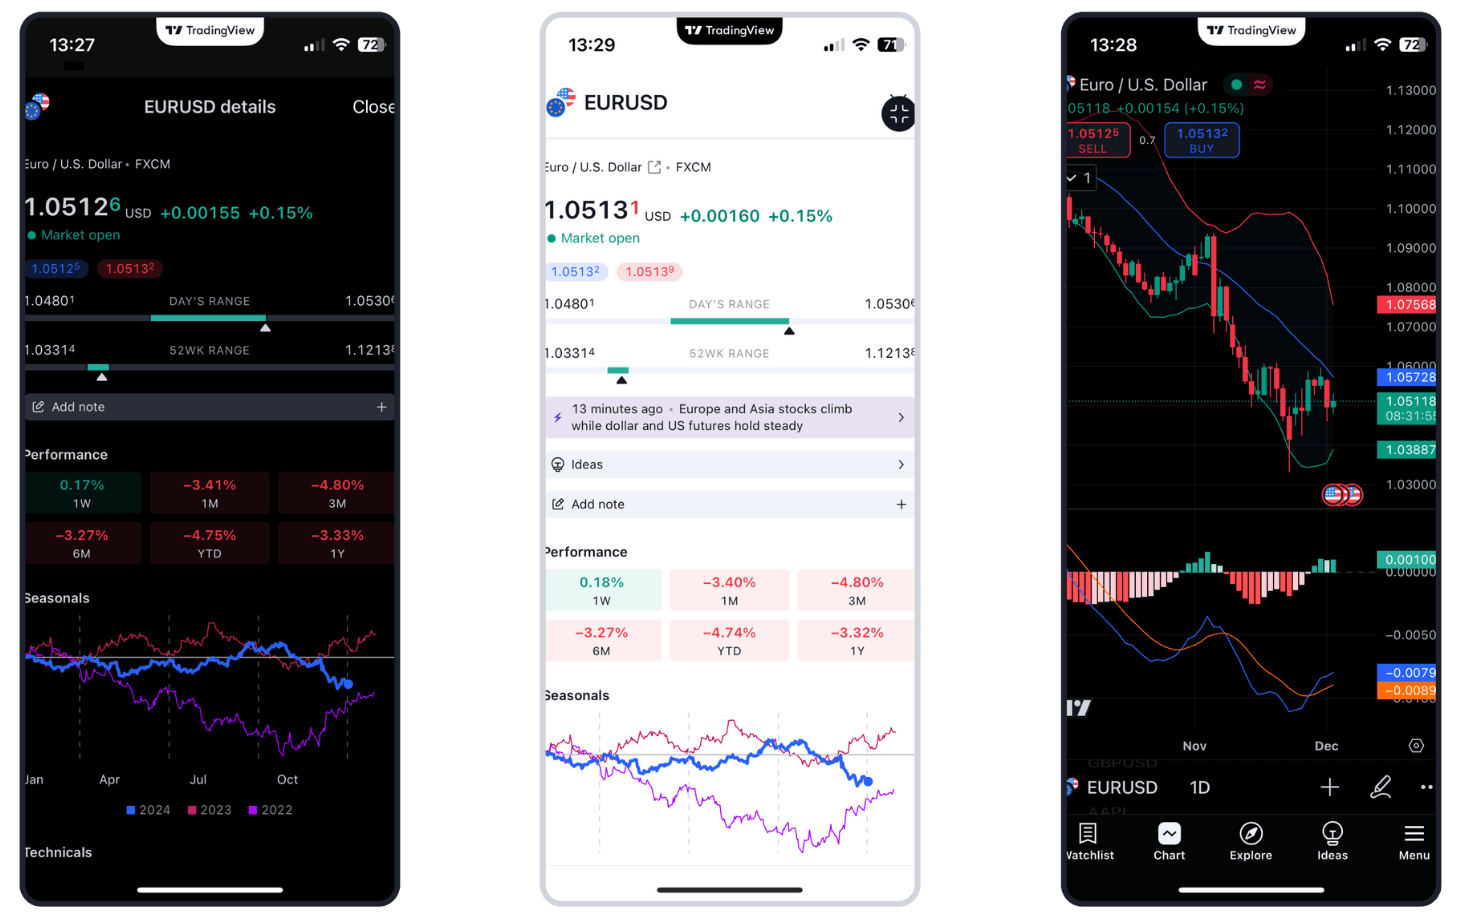
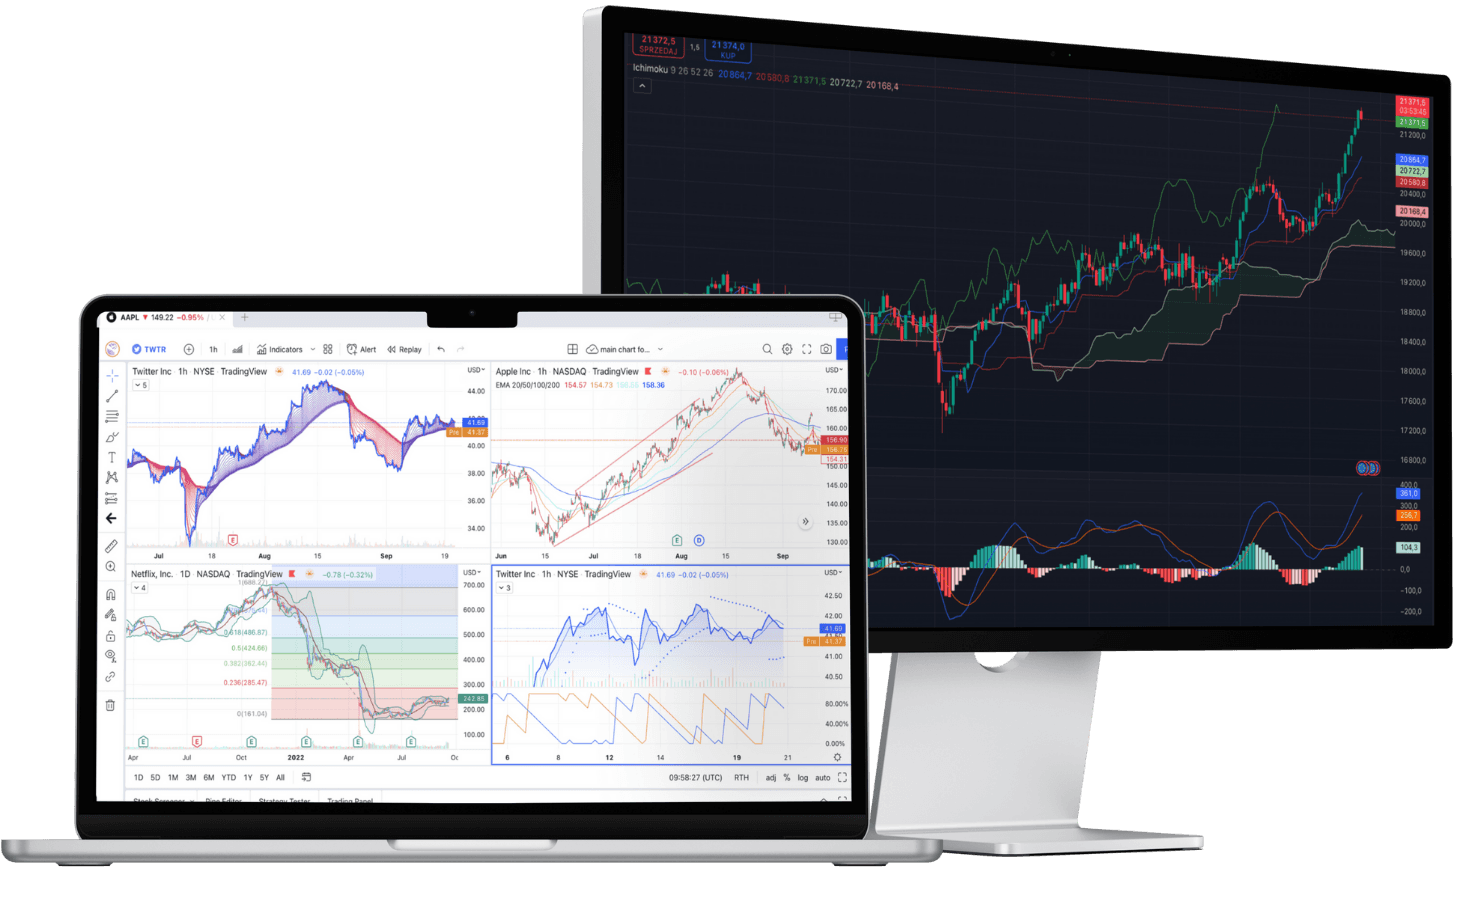
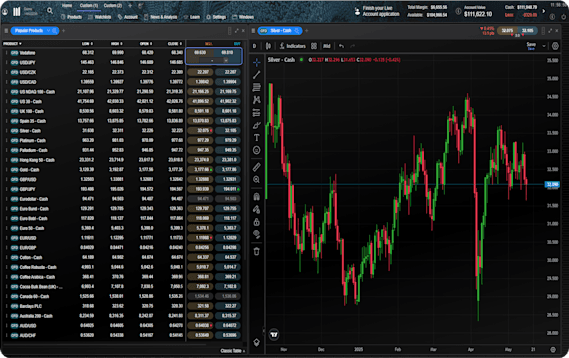
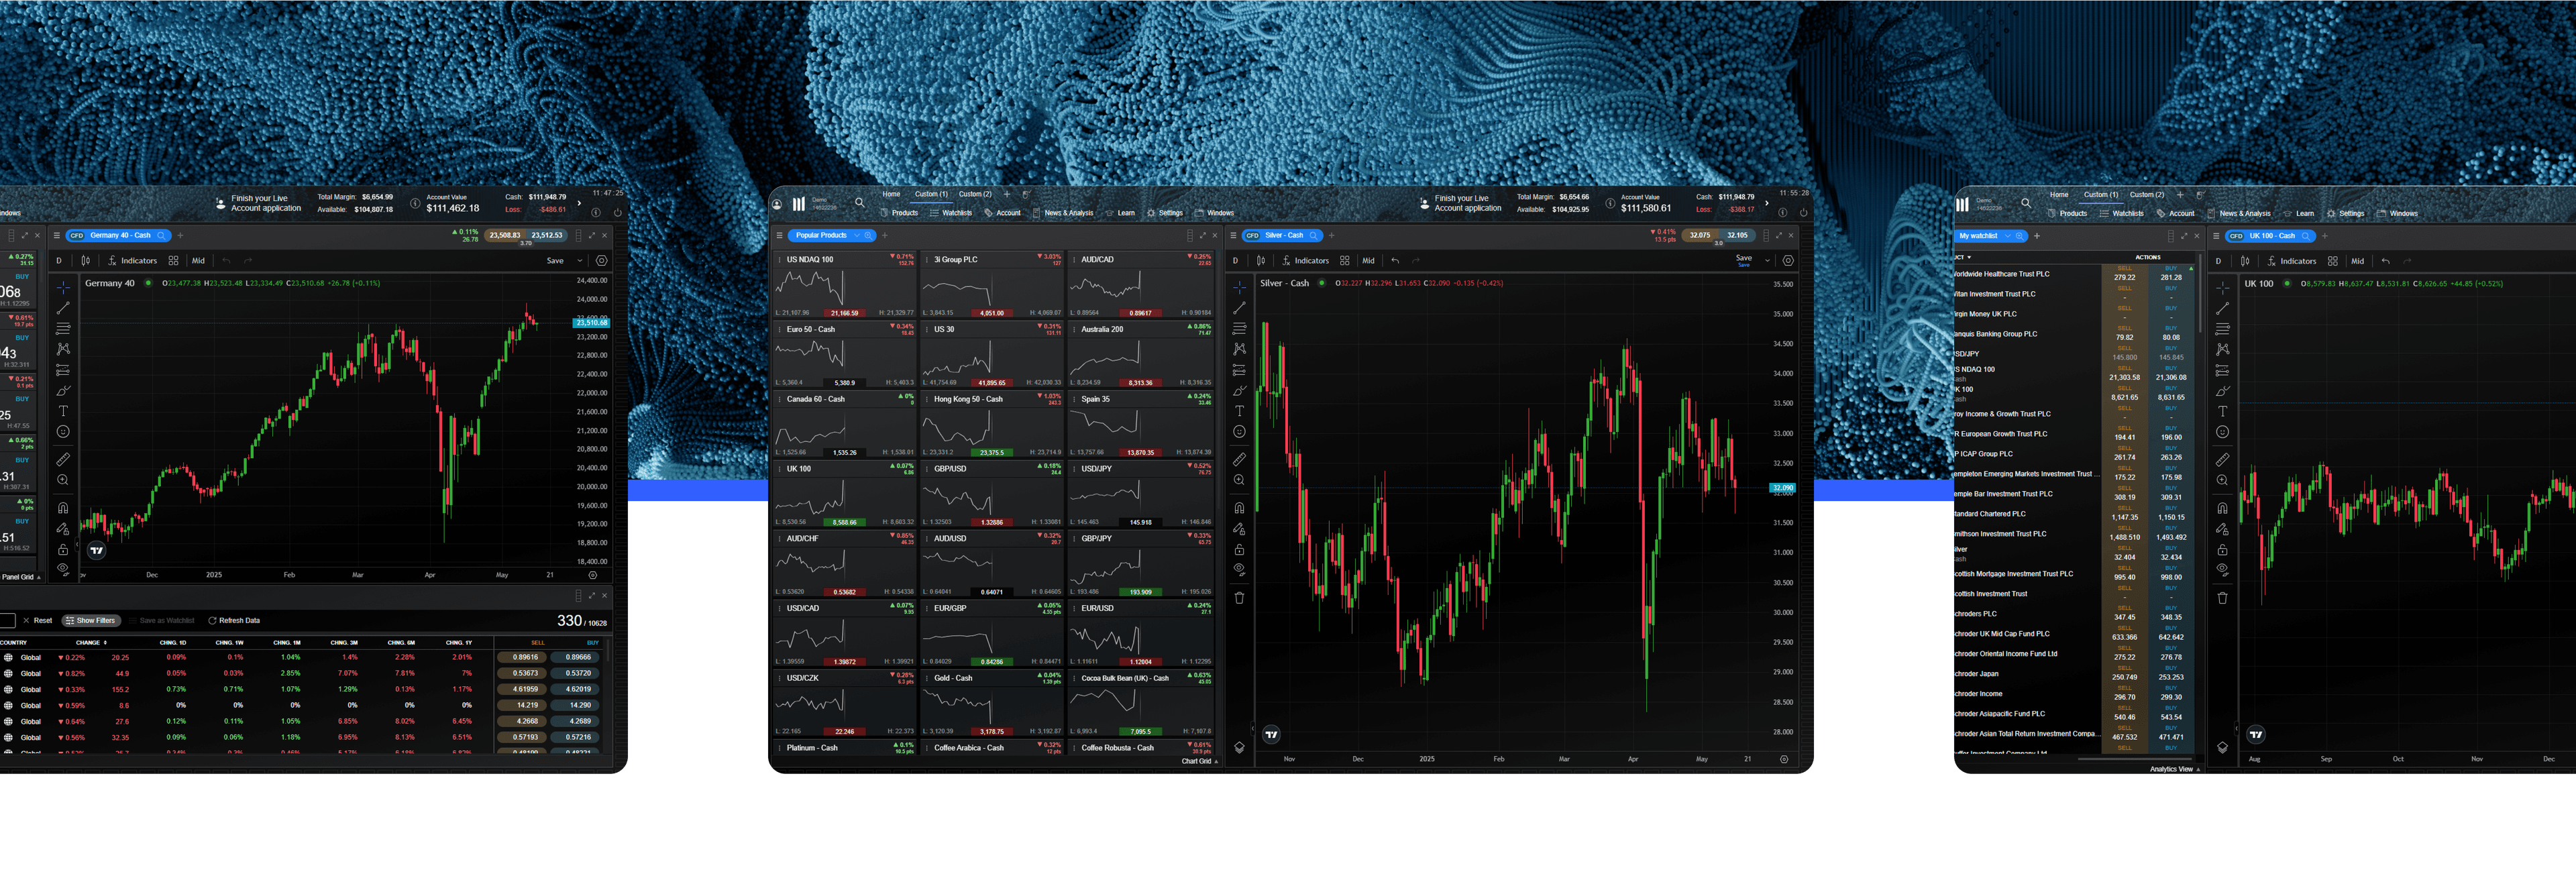
See inside our platform

Get tight spreads, no hidden fees and access to 12,000 instruments.

What is a stock market bubble?

A stock market bubble is when share prices of stocks rapidly keep climbing to a point where they far exceed their intrinsic value or their earnings. This price bubble, based on speculation, can include all equities in a stock market or those from a specific sector. When the bubble eventually bursts and prices start dropping, it can lead to panic selling and potentially a stock market crash.

What are the main defining characteristics of a stock market bubble?

  • Market sentiment. Market stakeholders, from the press to analysts and business owners, can fuel a wave of bullish optimism behind a certain stock market sector​. When investors follow this positive sentiment and flock to the market, prices rise, and a speculative bubble is formed.
  • Stretched valuations. This is when the valuation of several stocks is markedly out of proportion to their fundamentals, such as revenues. When it’s clear that the stock can’t justify the lofty valuation or market sentiment changes, the price corrects itself. Learn more about stock market corrections.
  • Irrational exuberance. A psychological reaction in which rising prices lead to a herding mentality among investors. As a result, they eschew their usual fundamental and technical analysis and believe that prices will keep climbing. A fear of missing out can overpower the knowledge that markets can be unpredictable.
  • Greater fool theory. The notion that there will always be another investor willing to speculate and buy at a higher price. You may not see the economic sense in buying a carpet cleaning stock for $10 a share, for example, but if you think you can sell it for $15 a share, perhaps it is worthwhile.

What causes stock market bubbles?

A bubble can be born out of changing economic conditions or societal needs. A period of low interest rates could encourage more investors to move from cash to shares, or a policy of quantitative easing could inflate the value of a market beyond its historic level. A technological or product innovation could also spark interest among investors.

A famous example is the tulip bubble in Holland during the 1630s. Rare tulip bulbs became the ultimate status symbol and were soon trading for as much as six times the average person’s salary. However, when the price became too high, auction rooms became deserted, the market lost its liquidity, and the so-called Tulipmania wilted.

Are we in a stock market bubble?

It is notoriously difficult to identify a stock market bubble until it has already burst. There may be a bull market​ — where share prices keep rising over an extended period — stretched valuations or fevered demand for the initial public offerings (IPOs) of new companies. There may also be a disconnect between the soaring stock market and economic growth.

It is difficult to predict when or if prices are going to fall. Only time can reveal whether market optimism over share prices was ill-placed.

Whatever leads to them, investors need to recognise that speculative bubbles can be a significant portfolio risk. They can protect themselves by understanding tail risk — the extreme negative outcome of a market crash — and using hedging strategies such as put options, where investors can sell assets at a set price.

Investors could also use contrarian investment strategies, in which they refuse to follow the herd, sell when others buy, and try to achieve better-than-average returns.

What metrics or indicators can be used to try and identify stock market bubbles?

Price-to-earnings ratio — Often referred to as P/E ratio, this reflects the price of a company’s shares relative to its earnings. A high P/E ratio could mean that a company is overvalued.

Shiller CAPE Ratio — The cyclically adjusted price-to-earnings ratio (CAPE) divides a company’s stock price by the average of its earnings for the last 10 years, adjusted for inflation. It helps assess the company’s valuation over different periods of an economic cycle.

Buffett Indicator — Named after legendary investor Warren Buffett, who describes it as “the best single measure of where valuation stands at any given moment”. It measures the ratio of total US stock market valuation to US GDP. A high ratio signals an overvalued market.

CBOE Volatility Index (VIX) — Often popularly referred to as the fear gauge, the Chicago Board Options Exchange (CBOE) index measures the level of expected volatility in the markets. A high level can indicate that bears are beginning to dominate a bull market and a pullback may be on its way.

What are the stages of a stock market bubble?

There are five main stages in a stock market bubble. These were first identified by US economist Hyman Minsky.

  1. Displacement — Investors think about markets in a more optimistic way following a significant economic or social event or a new must-have technology.
  2. Boom — The displacement period, based on fundamentals, has increased share prices. However, it then moves into a speculative phase when investors that are eager to buy into the growth drive the prices even higher.
  3. Euphoria — More investors buy into the market surge, often propelled by emotion and not necessarily reason.
  4. Profit-taking — Prices hit their ceiling. Some contrarian investors read the signs of a potential market fall and lock in gains by selling.
  5. Panic — Investors rush to sell, but as supply surpasses demand, prices plunge. Investors may see their profits wiped out.

The biggest stock market bubbles in history

The South Sea Bubble

In 1711, the South Sea Company was formed to take advantage of a monopoly on trade with the Spanish colonies of South America. Eager investors piled into the stock, with a guaranteed interest of 6%, after the company’s directors claimed that vast riches awaited. The bubble reached its height in 1720 after the UK Parliament accepted the company’s proposal to take over the national debt.

Shares in the South Sea Company surged from £128 in January 1720 to £1,050 in the summer. It was so successful that it spurred on several other similarly-themed stock companies, including some to rebuild vicarage houses and — most famously — “a company for carrying on an undertaking of great advantage, but nobody to know what it is”. The subscription for this mysterious company sold out. The South Sea bubble burst soon after. According to the UK National Archives, more than twice the amount of stock available was sold to the public, with this new money paid out to older investors.

Railway Bubble

The rapid expansion of the UK rail network in the early 1800s encouraged investors to hitch a ride on the growth of railway companies. Spurred on by the government cutting interest rates and network expansion plans, the bubble expanded until hitting the buffers in the 1840s. Both an interest rate hike and a realisation that much of the track network would never be used battered market sentiment.

Wall Street Crash of 1929

Arguably the most famous of stock market bubbles. The economy soared in the 1920s following the First World War. New technologies such as aeroplanes took flight, and the construction sector boomed. More people bought shares, many on credit, to profit from the rise. However, confidence drained in 1929, causing the Wall Street Crash.

Japan’s 1980s Market Bubble

In response to a slump in 1986, the Japanese government launched a programme of monetary and financial stimulus to recharge the economy. Investors became so excited that share prices tripled between 1985 and 1989. The Nikkei index hit a high of 38,915 in December 1989. However, the bubble burst when the Bank of Japan raised interest rates. The stock market plummeted and ushered in Japan’s Lost Decade of stagnant economic growth, which began in 1991.

The Dotcom Bubble

The growth of the internet during the 1990s sparked investor frenzy in a new wave of web-based companies. This led to a rush of, often loss-making, companies going public and achieving multi-billion-dollar valuations. According to Investopedia, the Nasdaq Composite Index, home to most of the tech or dotcom stocks, rocketed from under 500 at the start of 1995 to a peak of over 5,000 in March 2000. However, when several dotcom stocks declared bankruptcy, or it became clear that their business models were flimsy, the bubble burst, and prices plunged. However, some dotcom businesses did justify the hype, such as Amazon.

US Housing Bubble

This is a classic example of a rare black swan event — something which is impossible to predict before it happens but leads to catastrophic consequences. According to the US Bureau of Labor Statistics, house prices in the US doubled between 1996 and 2006. However, much of this was fuelled by sub-prime mortgages to borrowers with poor credit scores. Financial firms sold these loans, known as mortgage-backed securities, to commercial investors. However, when the subprime borrowers defaulted on their loans, it caused a ripple effect, leading to a stock market crash and the global financial crisis of 2007-2008.

China Bubble 2015

In the spring of 2015, the Shanghai stock market and the Shenzhen stock market had a combined market capitalisation of $9.5trn, making China the second-largest market in the world, according to The Guardian. The growth in share prices had been fuelled by a new group of ordinary investors, such as farmers, often buying on credit. Around 9% of Chinese households were said to have bought into the markets. However, a combination of slower economic growth and government interventions such as credit limits burst the bubble.

How to trade during a stock market bubble

There are number of techniques that may help with trading during a stock market bubble:

  • Manage your risk. Don’t get caught up in the excitement of a soaring market. Look to diversify your risk by investing in a mix of index funds and reduce exposure to growth stocks.
  • Focus on the fundamentals. Do your research and never forget the fundamental strengths of a company, such as its revenues and customer base. Look out for over-stretched valuations.
  • Go short. Individuals can short sell stocks in anticipation of a market crash via derivatives such as spread bets and contracts for differences (CFDs) on our online trading platform, Next Generation. Stocks that are rising and that an individual believes have the fundamentals to keep going upwards can also be selected. By getting timing right and selling before the market dips, an individual could make a profit.
  • Think long-term. A long-term investment approach involves defining a strategy and sticking to it. During this time, it may be useful to remember that markets go in cycles.
  • Be contrarian. If a bubble does burst and panic-selling ensues, then you might be able to pick up some bargains cheaply in stocks that you believe are of high quality and you have a long-term belief in. Read more about trading on undervalued stocks.
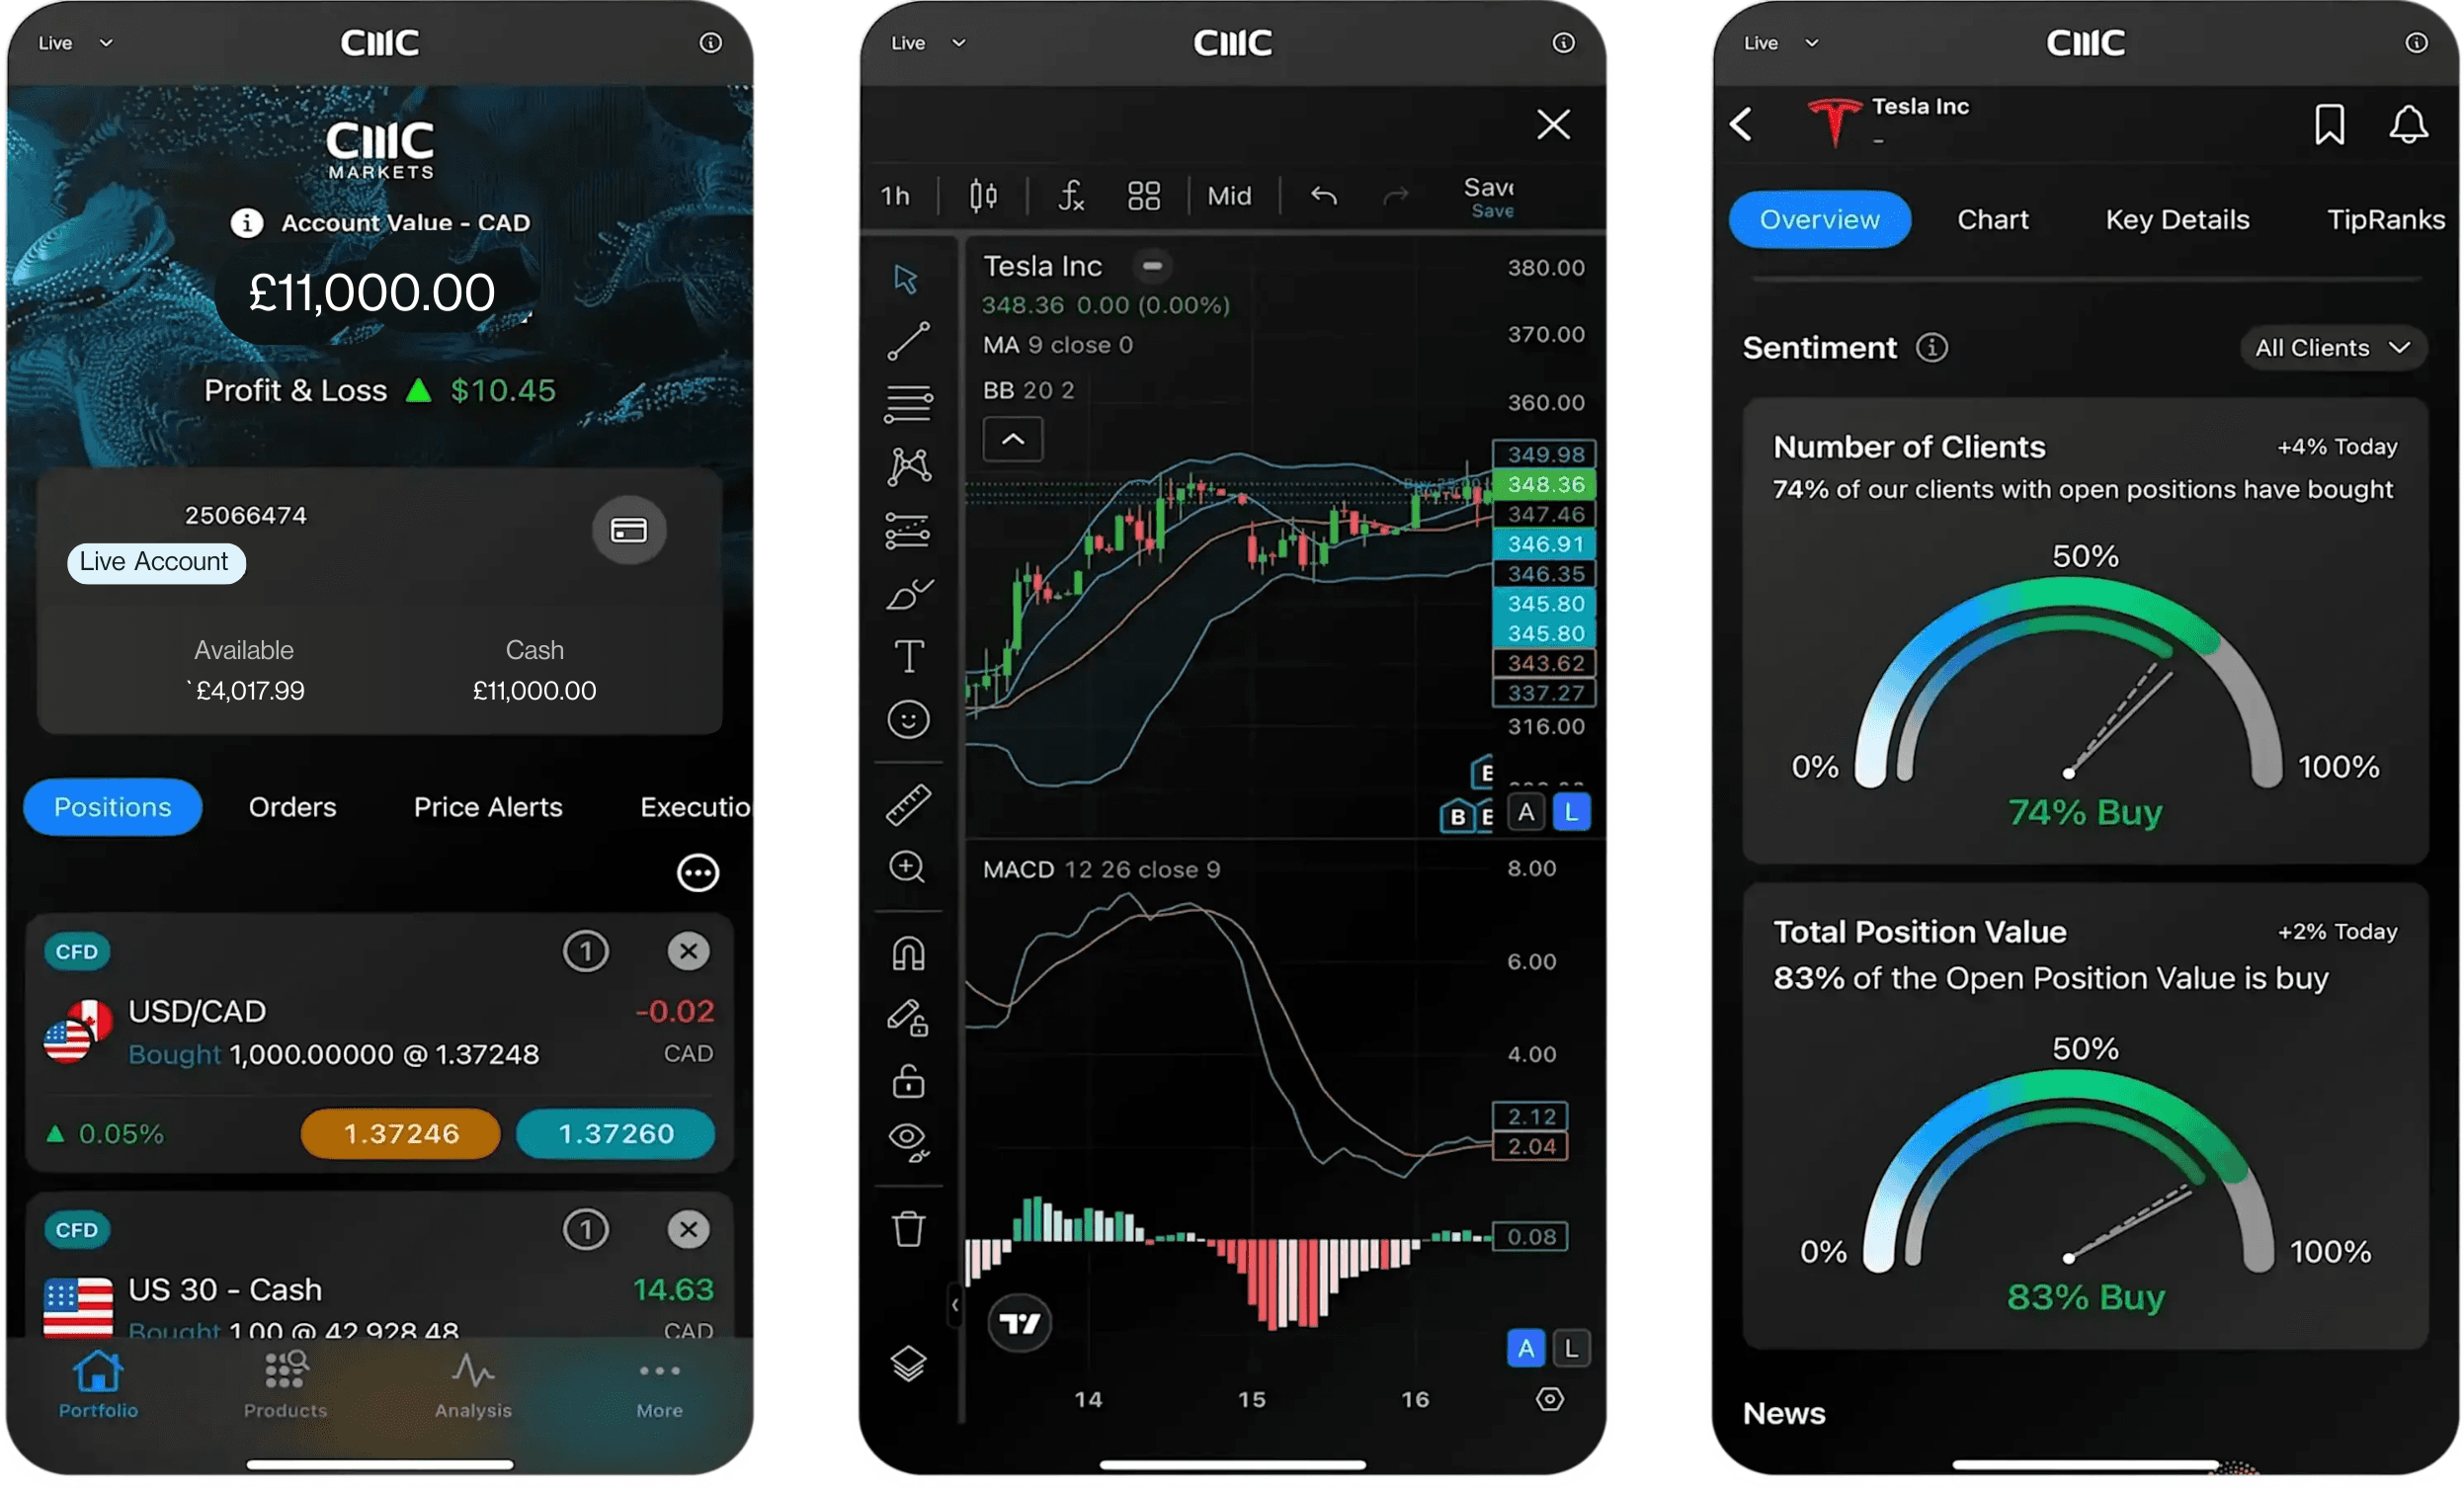
Practise stock trading on the go

Seamlessly open and close trades, track your progress and set up alerts

FAQ

What happens when a stock market bubble pops?

All stock market bubbles will eventually pop, which leads to a stock market crash. This causes share prices to drop suddenly, along with major index valuations such as the Dow Jones Industrial Average or S&P 500.

Are stock market bubbles good or bad?

Stock market bubbles are generally seen as a negative occurrence, given that they can wipe out businesses and investor capital and cause higher rates of inflation and unemployment. Therefore, investors may place their capital into other areas of the financial markets, such as bonds or forex.

Does a stock market bubble lead to a correction?

Usually, when a share price has become too overvalued and can’t keep up with investor sentiment, the price starts to correct itself, more accurately representing the value of the company. Learn more about stock market corrections.

What are overvalued stocks?

Overvalued stocks typically have share prices that are not justified by its price-earnings ratio or outlook for the future. If a stock trades at a much higher price than its competitors, this may be a red flag and investors may decide to short the stock, as it could start to decline in price.

How do you make money from a stock market bubble?

There is no guarantee that you will profit from a stock market bubble, but investors should try and diversify their portfolio as much as possible with assets from other sectors, such as bonds and ETFs. You could also look for sectors that fare well in a bear market, known as “defensive stocks”, such as utility, food or pharmaceutical stocks.

Disclaimer: CMC Markets is an execution-only service provider. The material (whether or not it states any opinions) is for general information purposes only, and does not take into account your personal circumstances or objectives. Nothing in this material is (or should be considered to be) financial, investment or other advice on which reliance should be placed. No opinion given in the material constitutes a recommendation by CMC Markets or the author that any particular investment, security, transaction or investment strategy is suitable for any specific person. The material has not been prepared in accordance with legal requirements designed to promote the independence of investment research. Although we are not specifically prevented from dealing before providing this material, we do not seek to take advantage of the material prior to its dissemination.