Fibonacci's golden ratio
The focus tends to be on the ratio between the numbers in the sequence. This is considered to be the most important part of Fibonacci's work. Any number in the series divided by the previous number gives us 1.618 as we get further down the series. This is known as the 'Fibonacci golden ratio'. For Fibonacci followers, there are plenty of examples in nature adhering to this ratio (or the inverse of the number, 0.618). It seems to have played an enormous part in the building blocks of everything around us.
For example, if you divide the number of female bees by male bees in a hive, you will get 1.618 as the answer. For sunflowers, each new seed is 0.618 of a turn from the last one. Fibonacci also applies to humans as well. There are lots of instances of this golden ratio working in relation to our bodies: one example is the ratio of the length of your forearm to your hand, which is 1.618.
Fibonacci’s golden ratio example
In financial markets, the Fibonacci golden ratio has the same mathematical base as the natural phenomena mentioned above. When traders use the golden ratio in their technical analysis, the ratio is usually translated into three percentages: 38.2% (often rounded to 38%), 50% and 61.8% (usually rounded to 62%). Having said that, traders can use more multiples when necessary, such as: 23.6%, 161.8%, 423%, 684.4% and so on.
The 38.2% ratio is found by dividing one number in the series by the number two places to the right. For example, 21 divided by 55 equals 0.382. The 23.6% ratio divides one number in the series by the number three places to the right. For example, 8 divided by 34 equals 0.235.
Fibonacci retracement levels
The argument of Fibonacci followers is: if so much of nature and the world is made up of these Fibonacci ratios, surely the same would apply to the markets too? Analysts can use this approach when learning to trade Fibonacci through its retracements. Let's say for example that a market has risen and, similar to all markets, it doesn't move in a straight line and starts to fall back. Traders will look at Fibonacci ratios to try and figure out where the fall may stop and the market will resume its previous rise.
Fibonacci retracement levels often mark retracement reversal points with surprising accuracy. The retracement levels are a powerful tool that can be applied to all timeframes, including day trading and long-term investing. Fibonacci numbers also play a crucial role in the Elliott Wave principle, a technical analysis tool used to identify market cycles. The tool can be used across many different asset classes, such as foreign exchange, shares, commodities and indices.
What is the Fibonacci sequence?
The golden ratio of 1.618 – the magic number – gets translated into three percentages: 23.6%, 38.2% and 61.8%. These are the three most popular percentages, although some traders will also look at the 50% and 76.4% levels. 50% is not a Fibonacci number, but has proved to be a generally popular number when correcting a primary or secondary price move. For now, we will focus on the 50% and the two more popular Fibonacci percentages of 38.2% and 61.8%.
These are then applied to the chart to try and figure out potential hidden levels of support or resistance in the market. When the market drops back to 38.2% of its previous rise (the first major Fibonacci retracement), traders will check to see if any buyers come in. If this 38.2% level gets broken, then the expectation is for the 50% retracement to be the next target. If the market slides through that 50% retracement level, then traders will look to see if the market finally stops its decline when it has retraced 61.8% of the prior move. For most Fibonacci followers, if it breaks through that 61.8% level, it means that the market direction is going back to where it started.
We can create Fibonacci retracements by taking a peak and trough (or two extreme points) on a chart and dividing the vertical distance by the above key Fibonacci ratios. Once these trading patterns are identified, horizontal lines can be drawn and then used to identify possible support and resistance levels.
What is the Fibonacci sequence used for?
The Fibonacci sequence and golden ratio appear frequently in nature, biology, architecture and fine art. It is seen in flower petals, tree branches, human DNA and population growth. The golden ratio and other Fibonacci ratios are also often found in the financial markets, and they form the foundation of the Fibonacci retracement tool.
How to use Fibonacci retracements in trading
Fibonacci retracement lines can be created when you divide the vertical distance between the high and low points by the key Fibonacci ratios. Horizontal lines are drawn on the trading chart at the 23.6%, 38.2% and 61.8% retracement levels. Some traders also like to use the 50.0% ratio. This is not really a Fibonacci ratio, but it can be useful. Often a security will retrace by around 50% before continuing its original trend.
Charting software has simplified the process of drawing Fibonacci lines. Many trading platforms enable traders to plot Fibonacci lines. In an upward trend, you can select the Fibonacci line tool, select the low price and drag the cursor up to the high price. The indicator will mark key ratios such as 61.8%, 50.0% and 38.2% on the chart.
Similarly, in a downward trend, you can select the Fibonacci line tool, choose the high price and drag the cursor down to the low price. The indicator will mark key ratios on the chart. To improve accuracy, traders can also use double tops or double bottoms as the high and low points.
Fibonacci support and resistance
Fibonacci levels are mainly used to identify support and resistance levels. When a security is trending up or down, it usually pulls back slightly before continuing the trend. Often, it will retrace to a key Fibonacci retracement level such as 38.2% or 61.8%. These levels provide signals for traders to enter new positions in the direction of the original trend. In an uptrend, you might go long (buy) on a retracement down to a key support level. In a downtrend, you could look to go short (sell) when a security retraces up to its key resistance level. The tool works best when a security is trending up or down.
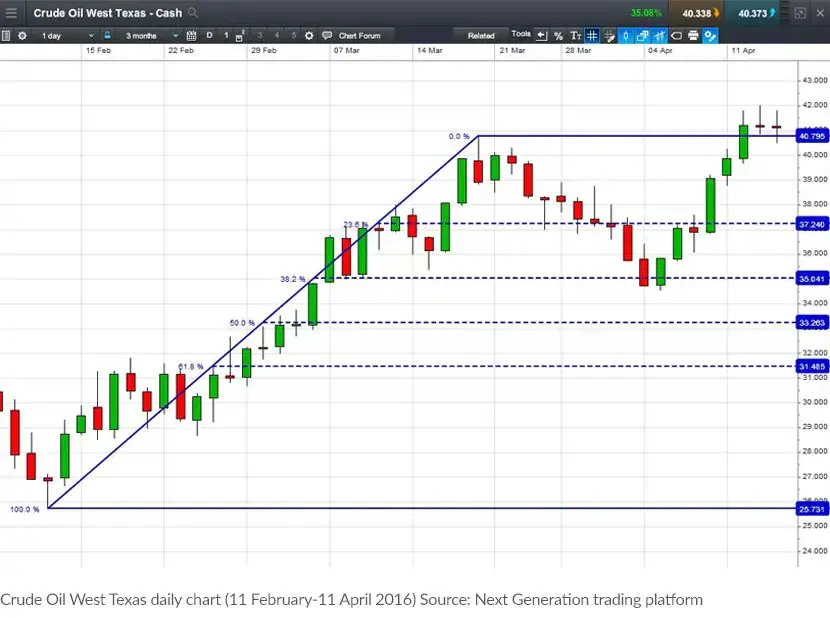
Examples of the Fibonacci pattern
This example shows the rise in the price of Crude Oil West Texas (also called WTI Crude Oil), which is part of the commodities market. The market then stalls, making it possible for traders to apply some Fibonacci retracements to that rally, to see where support comes in. As can be seen, the price does slide back but although briefly probing through, the 38.2% retracement in the $35 area does end up providing some support. The market rebounds and moves out to fresh highs for the recovery.