A time series is simply a set of data plotted over time. An example of a time series is temperature data (high, low, average) plotted daily. Financial Instruments traded in the market are plotted as price data that is continuously recorded. Prices may be plotted for a certain number of transactions (ticks). They may also be plotted in time periods, of usually one second and upwards. They are plotted on a chart as the open-high-low-close for that period; either as an open-high-low-close (OHLC bar), or as a candlestick.
MAs come in various flavours; but a few of them may be more relevant in understanding the MACD. A Simple Moving Average or SMA is an average of data plotted over a certain number of periods. A Weighted Moving Average or WMA is a moving average with greater emphasis (or weight) being placed on certain (or few) periods.
We also have the Exponential Moving Average or the EMA. This is where more recent periods have a higher weight in the calculation, compared to earlier periods. This is done using a weighting multiplier calculated as 2/(time period + 1). Therefore for a 9 period time series it is 2/(9 + 1) which is 0.2 or 20%. Given that the logic behind the MACD is to compare recent versus earlier price-action, an EMA is more applicable and therefore used in its calculation.
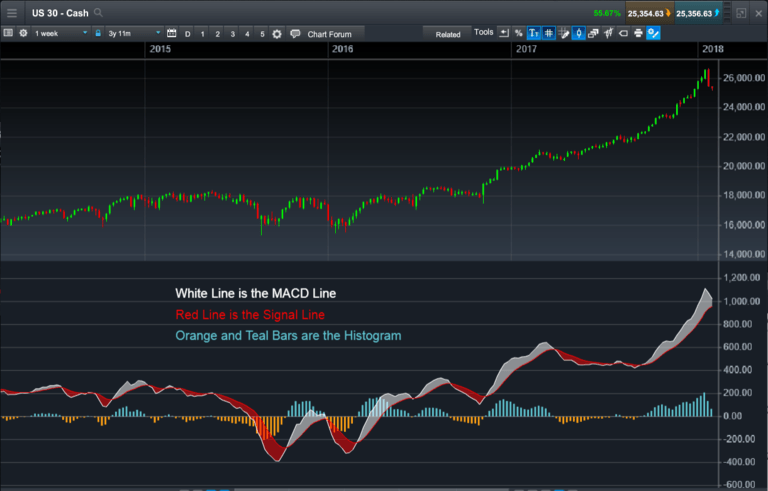
MACD indicator explained
Interpreting MACD on charts has been the focus of traders seeking to identify a market’s trend and momentum since the MACD indicator’s inception. It is easy to use and can, at a glance, give a myriad of information to the astute trader.