It will be a holiday-shortened trading week, with UK and US markets closed on Friday for the start of the Easter holiday weekend. Still, there will be plenty of economic data in the US for traders and investors to watch, including ISM manufacturing and services, plus ADP and non-farm payrolls employment reports. In a quieter week at home, we’ll still get a reading on the UK economy with a final GDP figure for Q4, and fresh manufacturing numbers. Together, these should offer a gauge on how much damage higher oil prices have caused to the economy so far. Meanwhile, sportswear giant Nike wraps up the current earnings season, as we await the start of the next one in early April.
- Market News
- Weekly outlook
- The Week Ahead: US ISM, jobs report, Nike earnings
The Week Ahead: US ISM, jobs report, Nike earnings
CMC Markets

Table of contents
- 1.Nike Q3 earnings
- 2.US ISM manufacturing
- 3.US jobs report
- 4.Market Calendar - Economic Data
- 5.Market Calendar - Earnings
Nike Q3 earnings
Tuesday 31 March
The athletic apparel maker is expected to report third-quarter earnings of $0.28 per share, down 48% year-on-year, while revenue is expected to decline by less than 1% to $11.2bn. Gross margins are expected to contract to 39.8%, from 40.6% in Q2. Analysts forecast Q4 earnings will grow 53.4% to $0.21. Revenue is projected to increase by 2% to $11.3bn, while gross margins are expected to rise by less than 1% to 40.6%. The stock is expected to see a post-earnings move of about 7.7%.
Implied volatility for Nike options expiring on 2 April is relatively elevated, at around 80%. Option positioning in Nike appears bearish, with a key level of support currently around $50, just slightly below the stock’s current price. However, if the company reports solid results, the combination of bearish positioning and strong support at $50 could set the stage for a post-earnings rally. As implied volatility resets, and provided the results are not unexpectedly weak, the decay in ‘put’ premiums could help lift the shares.
From a technical perspective, the picture broadly aligns with the options market. Nike has been trading at its lowest level since October 2017, representing significant support around $50. A break below $50 would be a clear negative signal, and could see the stock moving down towards $45. However, if support holds, the shares could move back towards $62.5 and potentially rally further to around $75.5, over a longer period. Both the technical setup and options positioning suggest that the next major level of resistance does not appear until approximately $75.5.
Nike share price, July 2017 - present
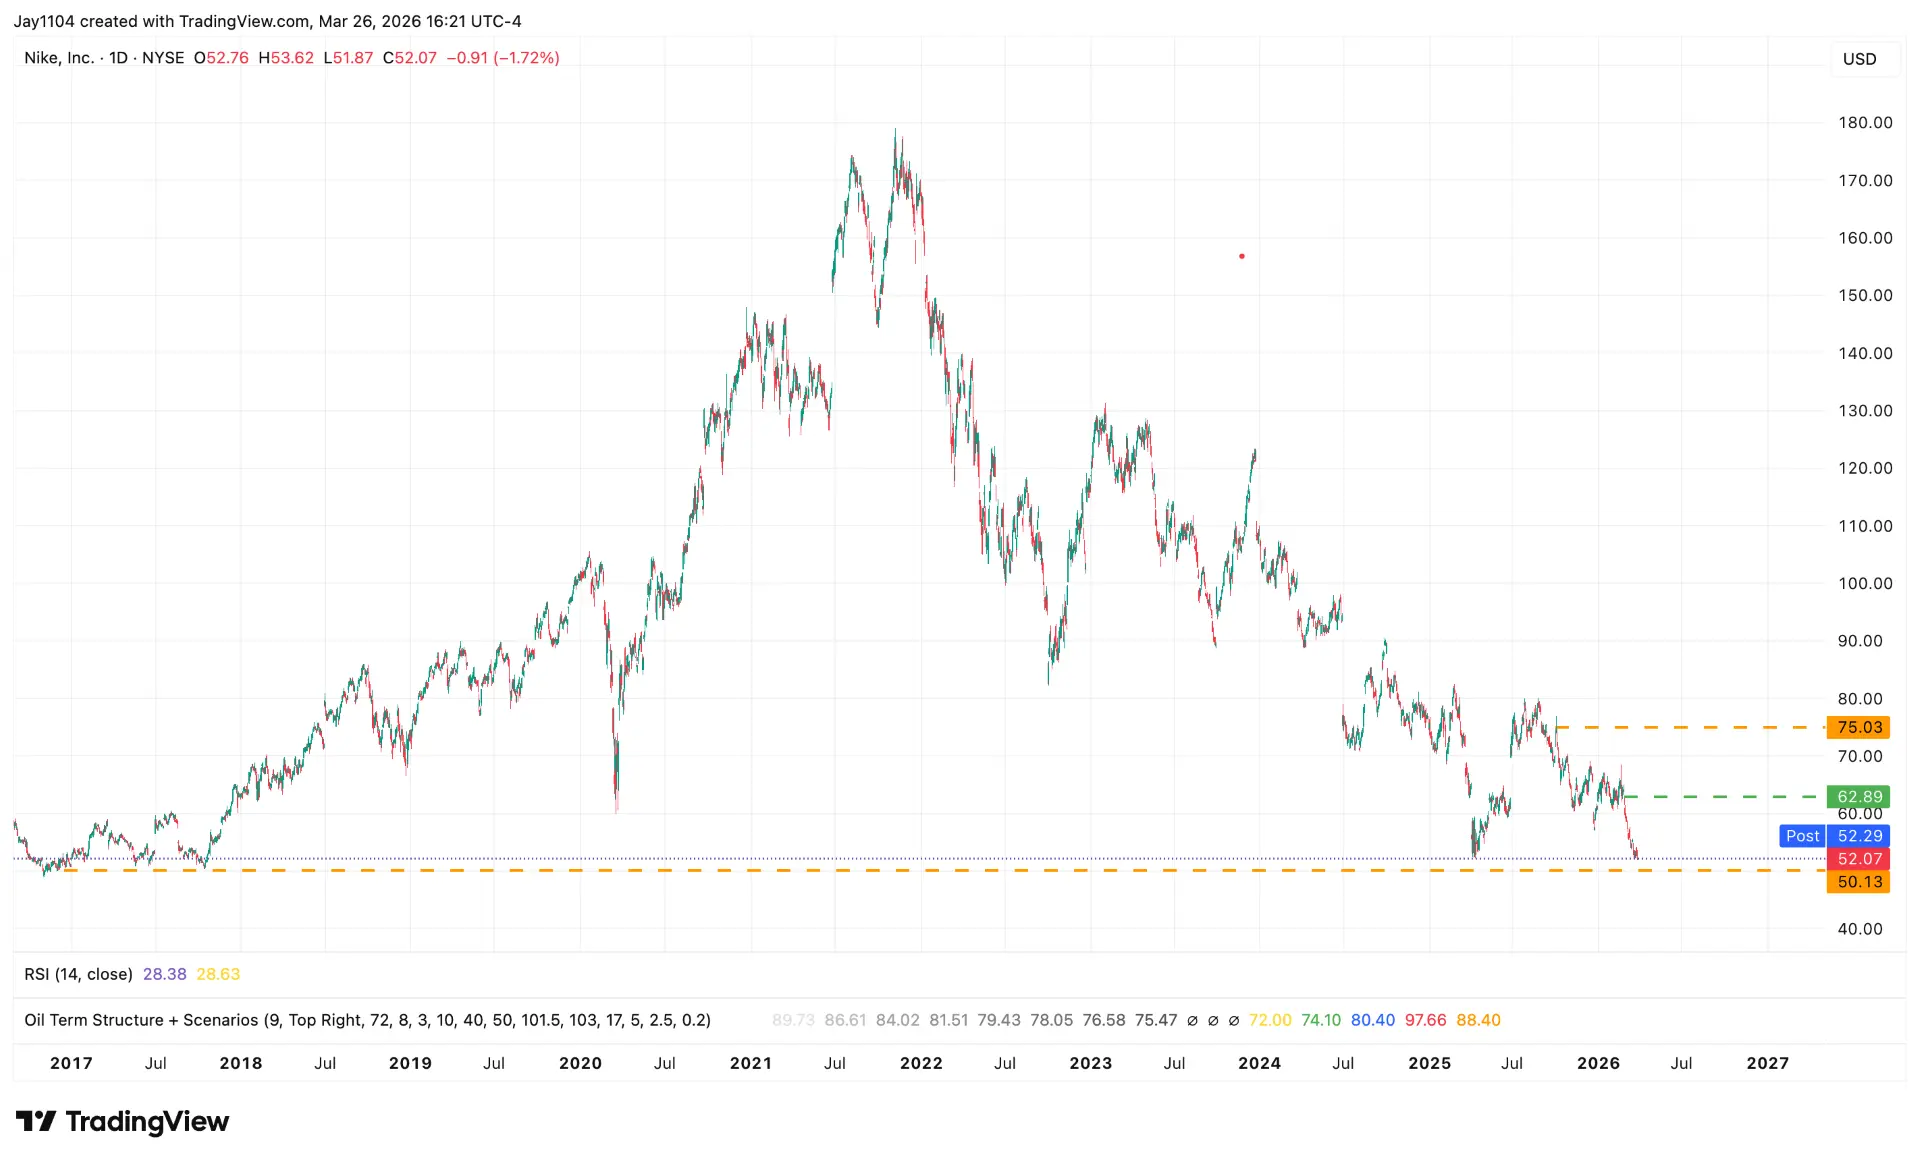
Sources: TradingView, Michael Kramer
US ISM manufacturing
Wednesday 1 April
Markets will be paying close attention to the manufacturing prices paid index, given the surge in oil prices in March. The index had already risen in February to 70.5 – its highest level since the summer of 2022 – before oil prices began to climb.
At present, the S&P 500 is trading near 6,330, having broken below the key support zone between 6,475 and 6,500, as well as the 6,360 level. This move signals a loss of near-term support and could open the way for further downside if selling pressure persists, with the index now sitting around 9% below its all-time highs reached just two months ago.
S&P 500, 6 Months
Sources: TradingView, Michael Kramer
US jobs report
Friday 3 April
Non-farm payrolls are expected to show a gain of 48,000 jobs in March, a significant improvement from February, when employment declined by 92,000. Private payrolls are also expected to rise to 51,000. The unemployment rate is forecast to increase to 4.5% from 4.4%, while average hourly earnings are expected to remain unchanged at 0.4% month-on-month.
If the report does not come in weaker than expected, as it did in February, it’s likely to support a stronger US dollar. At present, the Japanese yen appears to be the currency struggling the most against the dollar, with USD/JPY trading just above ¥160. This level remains a critical threshold, and a break above it could see USD/JPY advance towards the ¥162 to ¥162.5 levels last seen in July 2024. For now, the market continues to watch closely to see whether that breakout materialises.
USD/JPY YTD
Sources: TradingView
Market Calendar - Economic Data
Date | Country | Event | Impact |
|---|---|---|---|
Tuesday 31 March 2026 | US | Fed Chairman Powell Speech | High |
Wednesday 1 April 2026 | US | Consumer Confidence Index | High |
Wednesday 1 April 2026 | AU | Building Approvals (MoM) | High |
Wednesday 1 April 2026 | US | ADP Private Payrolls | High |
Wednesday 1 April 2026 | US | Retail Sales (MoM) | High |
Thursday 2 April 2026 | US | ISM Manufacturing PMI | High |
Thursday 2 April 2026 | US | Crude Oil Stocks (EIA) | High |
Thursday 2 April 2026 | US | Unemployment Claims (WoW) | High |
Thursday 2 April 2026 | US | Trade Balance (MoM) | High |
Friday 3 April 2026 | US | Non-Farm Payrolls | High |
Friday 3 April 2026 | US | Unemployment Rate | High |
Market Calendar - Earnings
Date | Company name | Timing |
|---|---|---|
Tuesday 31 March | Nike (NKE) | After Close |
Earnings dates are shown in US market time. As results are often released pre or post market, the local calendar day may differ in Australia and New Zealand.
In general:
US pre market releases appear late evening in Australia and after midnight in New Zealand
US post market releases appear the following morning in both Australia and New Zealand
As a result, some earnings listed for a US date may be seen on the next calendar day locally. Please check specific local timings where relevant.
Disclaimer: This article provides general information only. It has been prepared without taking account of your objectives, financial situation or needs. It is not to be construed as a solicitation or an offer to buy or sell any financial instruments, or as a recommendation and/or investment advice. It does not intend to support an investment decision and it should not be relied upon by you in evaluating the merits of investing in any financial instruments. You should consider your objectives, financial situation and needs before acting on the information in this article. CMC Markets believes that the information in this article is correct, and any opinions and conclusions are reasonably held or made on information available at the time of its compilation, but no representation or warranty is made as to the accuracy, reliability or completeness of any statements made in this article. CMC Markets is under no obligation to, and does not, update or keep current the information contained in this article. Neither CMC Markets nor any of its affiliates or subsidiaries accepts liability for loss or damage arising out of the use of all or any part of this article. Any opinions or conclusions set forth in this article are subject to change without notice and may differ or be contrary to the opinions or conclusions expressed by any other members of CMC Markets.

