The coming week may be relatively light in terms of scheduled central bank events, but macroeconomic data will still be closely scrutinised, particularly against the backdrop of higher oil prices and ongoing geopolitical tensions in the Middle East. Inflation releases from Japan, the UK, and the US are likely to draw the most attention, as markets assess whether recent energy price moves are beginning to feed through into broader price pressures. Flash purchasing managers’ index (PMI) data will also provide a timely snapshot of global growth conditions, while Carnival’s latest results could offer insight into consumer demand trends.
- Market News
- Weekly outlook
- The Week Ahead: Inflation watch, Flash PMIs, Carnival earnings
The Week Ahead: Inflation watch, Flash PMIs, Carnival earnings
CMC Markets

Table of contents
- 1.Japan CPI and global inflation trends
- 2.Flash PMIs
- 3.Carnival Q1 earnings
- 4.Market Calendar - Economic Data
- 5.Market Calendar - Earnings
Japan CPI and global inflation trends
Tuesday 24 March
Following the conclusion of recent central bank meetings, markets are likely to refocus on inflation dynamics, particularly as the recent rise in oil prices raises concerns about renewed price pressures. Japan will be the first major economy to report inflation data this week, followed by the UK consumer price index (CPI) on Wednesday, alongside US import and export price data.
While each release may have a limited impact in isolation, collectively they should help establish a clearer picture of the current inflation environment. This, in turn, may influence expectations for the future path of monetary policy, especially if there are early signs that energy costs are beginning to feed through more broadly.
From a technical perspective, USD/JPY has moved below support around the ¥158 level, having repeatedly failed to sustain a move above ¥159 in recent sessions. A break back above ¥159 could open the way towards ¥162. However, downside risks appear to be building, particularly given the pair’s recent break in trend and the potential for intervention around the ¥160 level.
A further pullback towards the 61.8% retracement level near ¥155.35 may be possible if the yen continues to strengthen, especially if inflation data alters expectations for policy divergence.
USD/JPY, June 2025 - present
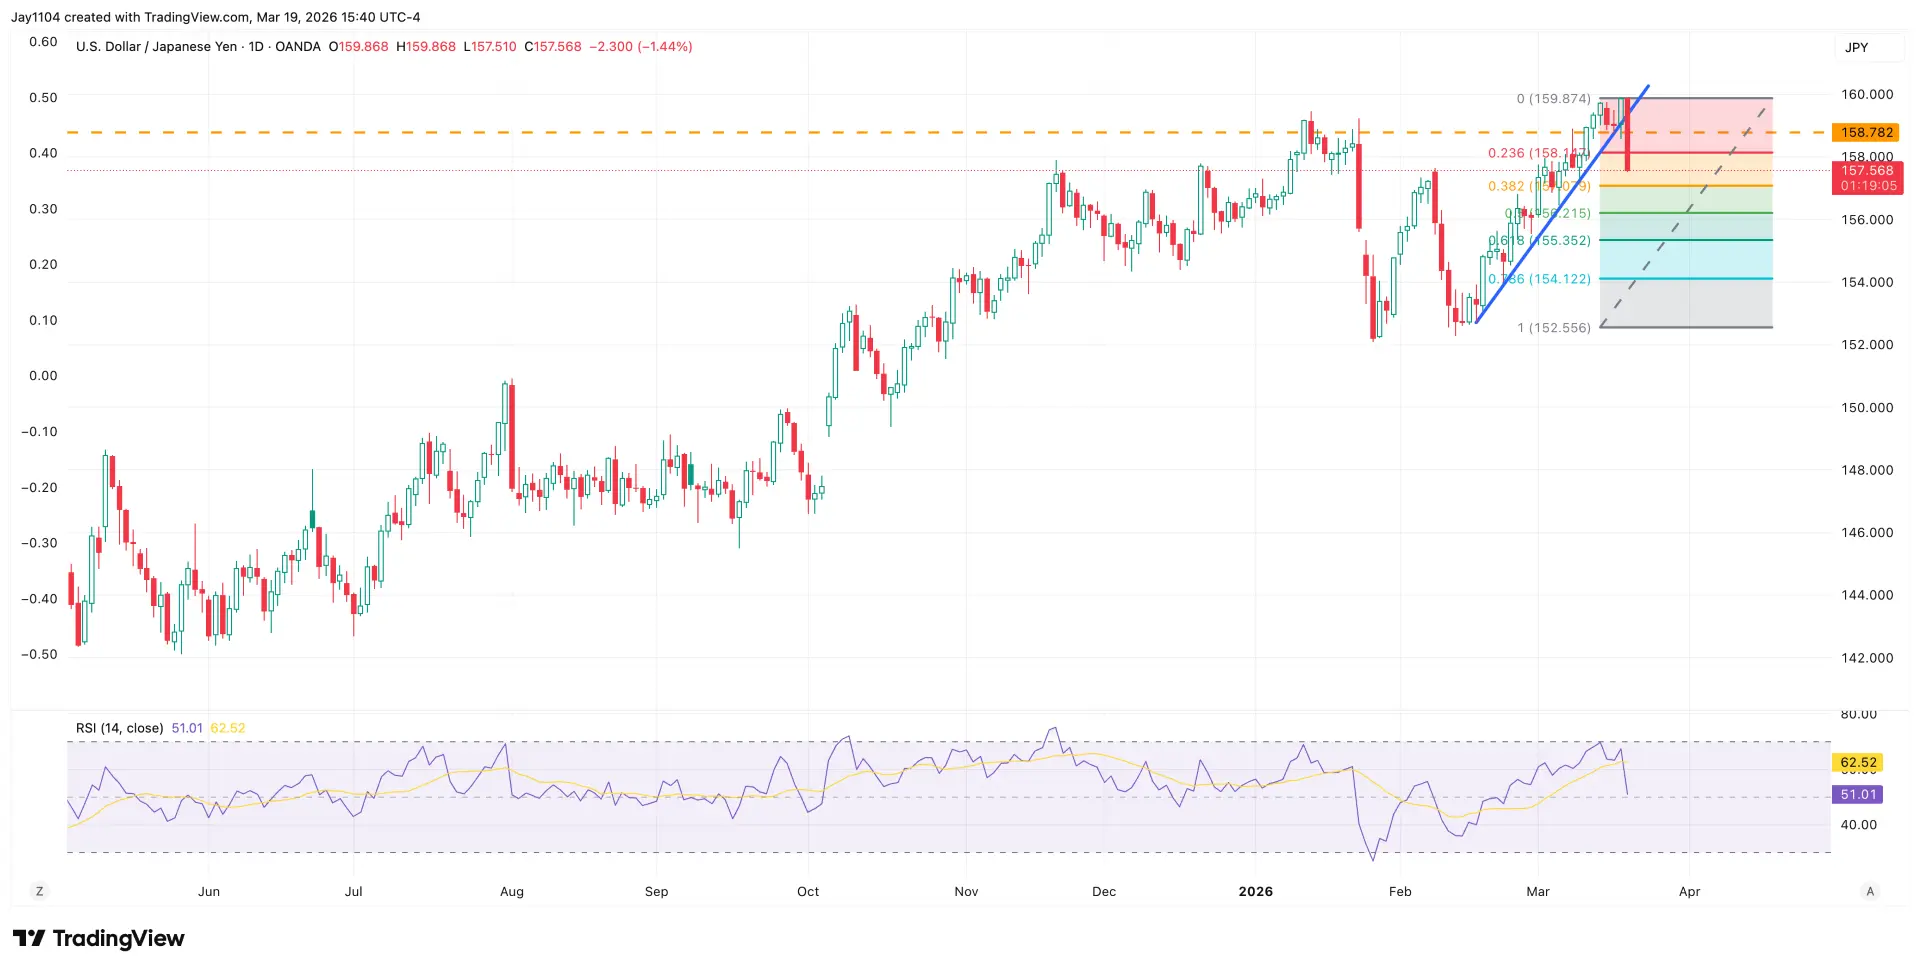
Sources: TradingView, Michael Kramer
Flash PMIs
Tuesday 24 March
The March flash PMI readings will provide an early indication of how rising oil prices are affecting global economic activity. As mid-month estimates, these data points offer a preview of the final readings due at the start of April and are often used by markets to gauge shifts in momentum.
Particular attention is likely to be paid to the prices paid component, which can offer insight into how quickly higher energy costs are being passed through to businesses. Any signs of accelerating input costs may reinforce concerns about inflation persistence.
Equity markets, particularly in Europe, may remain sensitive to these developments. The DAX has struggled in recent sessions and appears to be testing support around 23,050. A sustained move below this level could signal increasing concern about the growth outlook.
Further downside could see the index move towards 22,580, an area that would fill a gap from mid-May. A break below that level may open the way towards 21,760, which would bring the index back to levels last seen in April 2025.
DAX, December 2025 - present
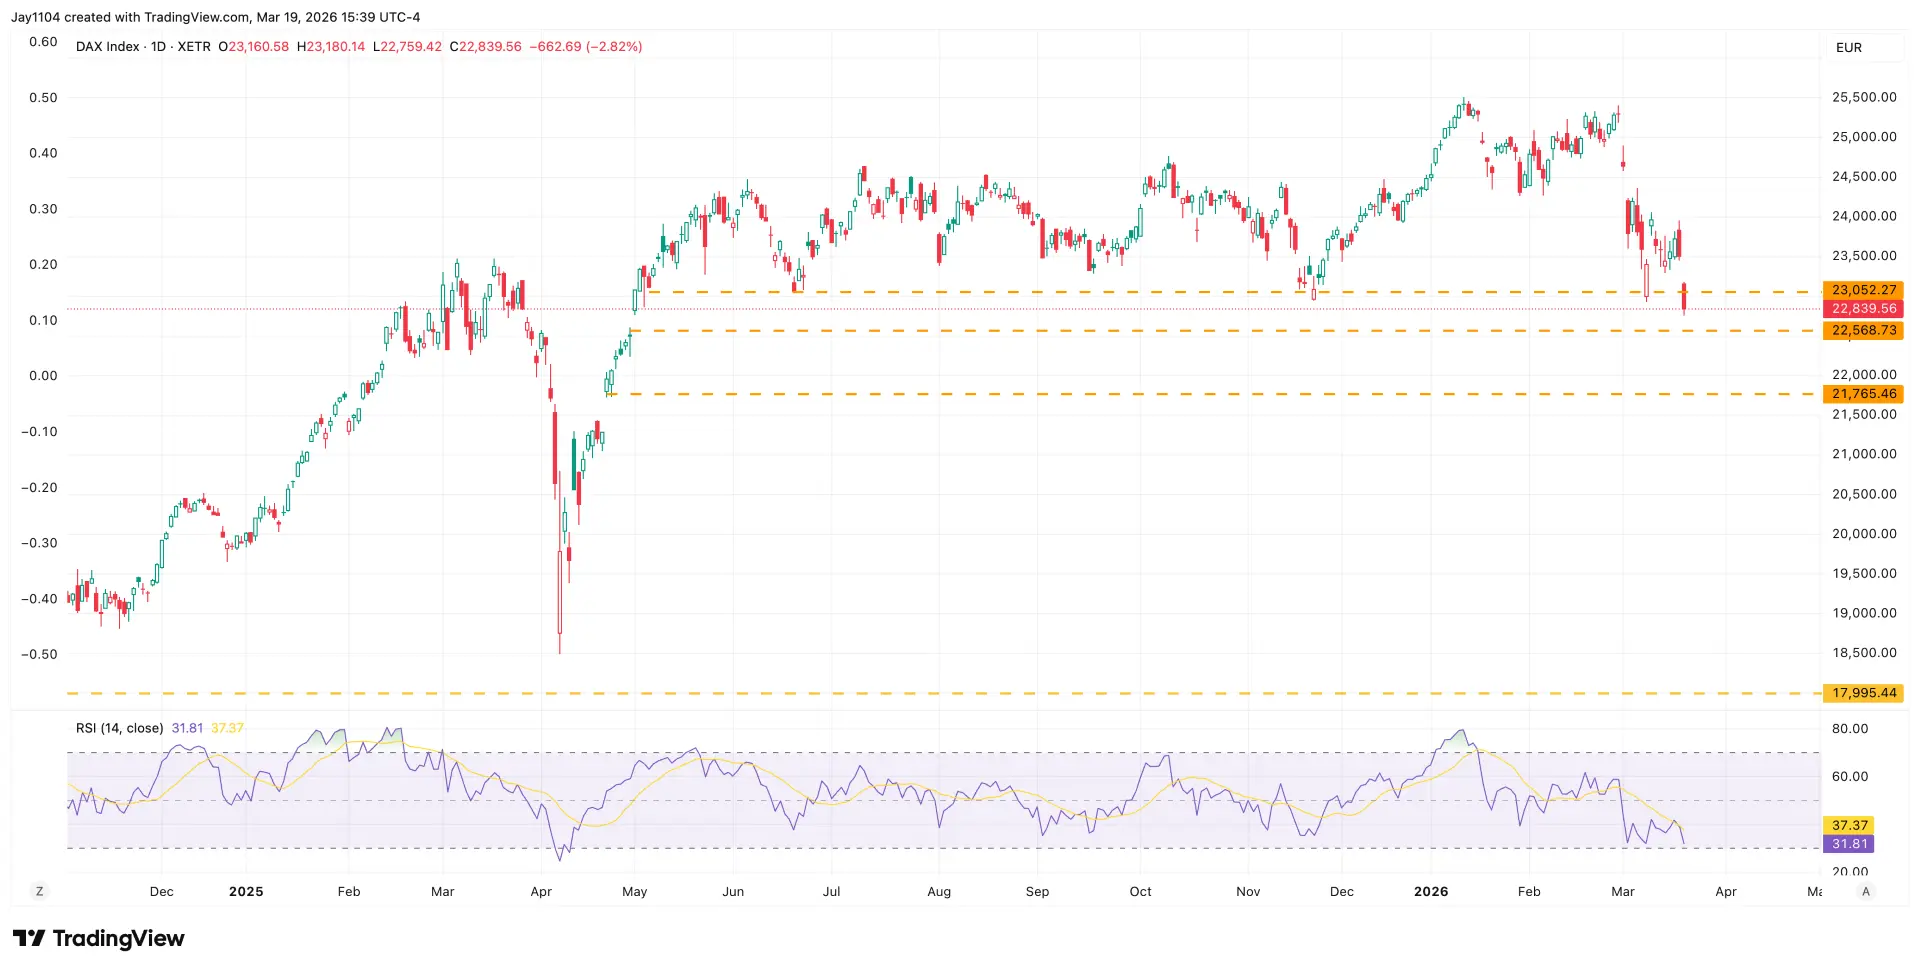
Sources: TradingView, Michael Kramer
Carnival Q1 earnings
Friday 27 March
Carnival is scheduled to report first-quarter earnings before the market opens on Friday. The cruise operator is expected to deliver earnings per share of $0.18, representing growth of around 41.5% year-on-year, while revenue is forecast to rise by approximately 5.6% to $6.1bn.
Looking ahead, analysts anticipate further improvement in the second quarter, with earnings projected to increase to $0.45 per share and revenue expected to reach around $6.7bn. The options market suggests that the shares could move by roughly 8.4% following the results.
Positioning appears cautious heading into the release, with options activity indicating a more defensive stance. If the results exceed expectations, there is potential for hedging flows to reverse, which could provide support for the shares, particularly given elevated implied volatility.
Technically, the stock has recently filled a gap near $24 and appears to be oversold, with the relative strength index (RSI) below 30 and prices trading near the lower Bollinger Band. If support around $24 holds, a recovery towards $30 may be possible, where a previous gap was formed in late February.
Carnival share price, May 2025 - present
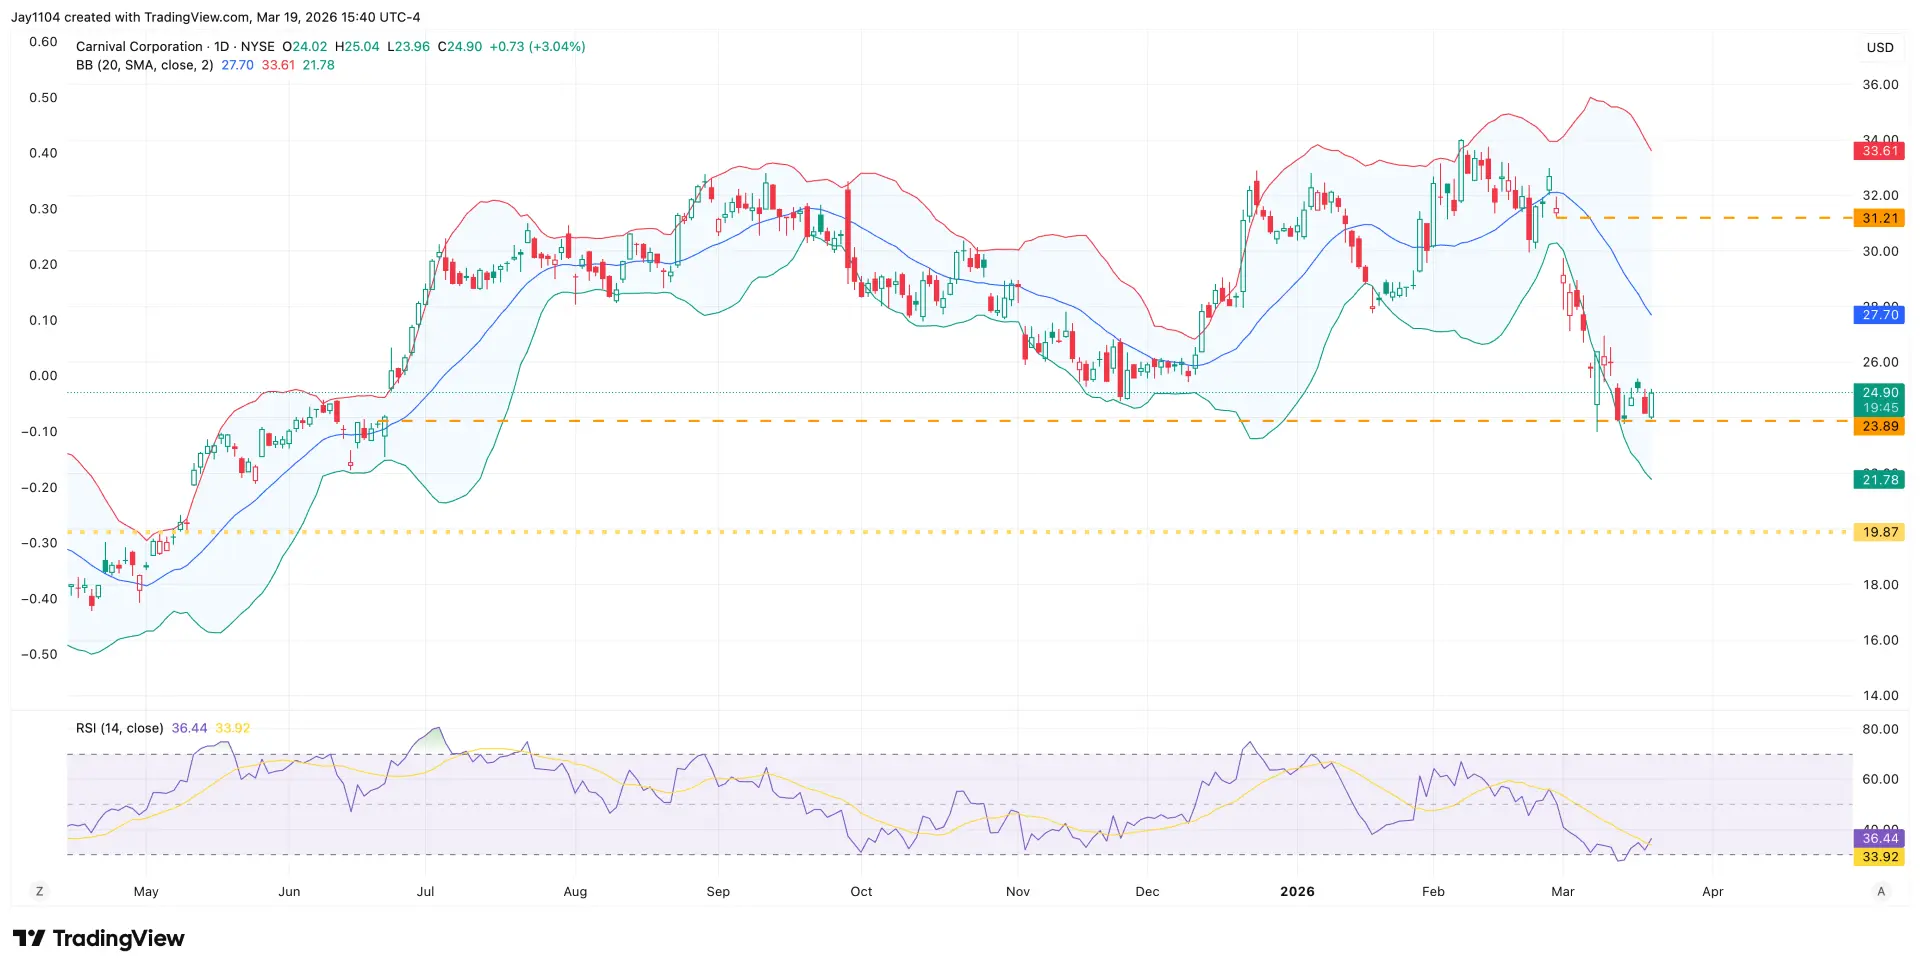
Sources: TradingView, Michael Kramer
Market Calendar - Economic Data
Date | Country | Event | Impact |
|---|---|---|---|
24 Mar 2026 | US | Construction Spending, New Construction | Medium |
24 Mar 2026 | US | Productivity, Non-Farm Productivity, Revised | Medium |
24 Mar 2026 | US | Productivity, Unit Labour Costs, Revised | Medium |
25 Mar 2026 | US | PMI Flash Estimate, Manufacturing, Markit | Medium |
25 Mar 2026 | US | Balance of Payments, Current Account Balance | Medium |
25 Mar 2026 | US | Import Prices, MoM | Medium |
26 Mar 2026 | US | EIA DOE Weekly Petroleum Status Report, Crude Oil Stocks (Net Change) | High |
26 Mar 2026 | US | Employment, Continuing Unemployment Claims | Medium |
26 Mar 2026 | US | Employment, Unemployment Claims, WoW | High |
27 Mar 2026 | US | EIA DOE Weekly Natural Gas Storage Report, Total Working Gas in Storage (Net Change) | Medium |
27 Mar 2026 | AU | RBA Assistant Governor Kent Speech | Medium |
27 Mar 2026 | AU | RBA Assistant Governor Kent Speech | Medium |
Market Calendar - Earnings
Date (US) | Company name | Timing |
|---|---|---|
Tuesday 24 March | GameStop (GME) | After Close |
Wednesday 25 March | Ondas (ONDS) | Before Open |
Friday 27 March | Carnival (CCL) | Before Open |
Earnings dates are shown in US market time. As results are often released pre or post market, the local calendar day may differ in Australia and New Zealand.
In general:
US pre market releases appear late evening in Australia and after midnight in New Zealand
US post market releases appear the following morning in both Australia and New Zealand
As a result, some earnings listed for a US date may be seen on the next calendar day locally. Please check specific local timings where relevant.
Disclaimer: This article provides general information only. It has been prepared without taking account of your objectives, financial situation or needs. It is not to be construed as a solicitation or an offer to buy or sell any financial instruments, or as a recommendation and/or investment advice. It does not intend to support an investment decision and it should not be relied upon by you in evaluating the merits of investing in any financial instruments. You should consider your objectives, financial situation and needs before acting on the information in this article. CMC Markets believes that the information in this article is correct, and any opinions and conclusions are reasonably held or made on information available at the time of its compilation, but no representation or warranty is made as to the accuracy, reliability or completeness of any statements made in this article. CMC Markets is under no obligation to, and does not, update or keep current the information contained in this article. Neither CMC Markets nor any of its affiliates or subsidiaries accepts liability for loss or damage arising out of the use of all or any part of this article. Any opinions or conclusions set forth in this article are subject to change without notice and may differ or be contrary to the opinions or conclusions expressed by any other members of CMC Markets.

