Spread bets and CFDs are complex instruments and come with a high risk of losing money rapidly due to leverage. 69% of retail investor accounts lose money when spread betting and/or trading CFDs with this provider. You should consider whether you understand how spread bets and CFDs work and whether you can afford to take the high risk of losing your money.

Exponential moving average

The exponential moving average (EMA) is a weighted moving average that measures a trend, both bullish and bearish, of a financial security over a given period of time. The EMA is used in trading to determine whether the price of a security is going up or down, and can help to forecast future price direction.

Moving averages are technical indicators​ that aim to ‘smooth out’ price fluctuations in order to help separate trends from general market activity. The EMA is a popular technical indicator among traders, as it can be applied to all financial markets, including stocks, forex and commodities. It is often used alongside other technical analysis​ tools and indicators that can be found on our Next Generation trading platform to provide optimal results, such as Bollinger Bands, Relative Strength Index and MACD.

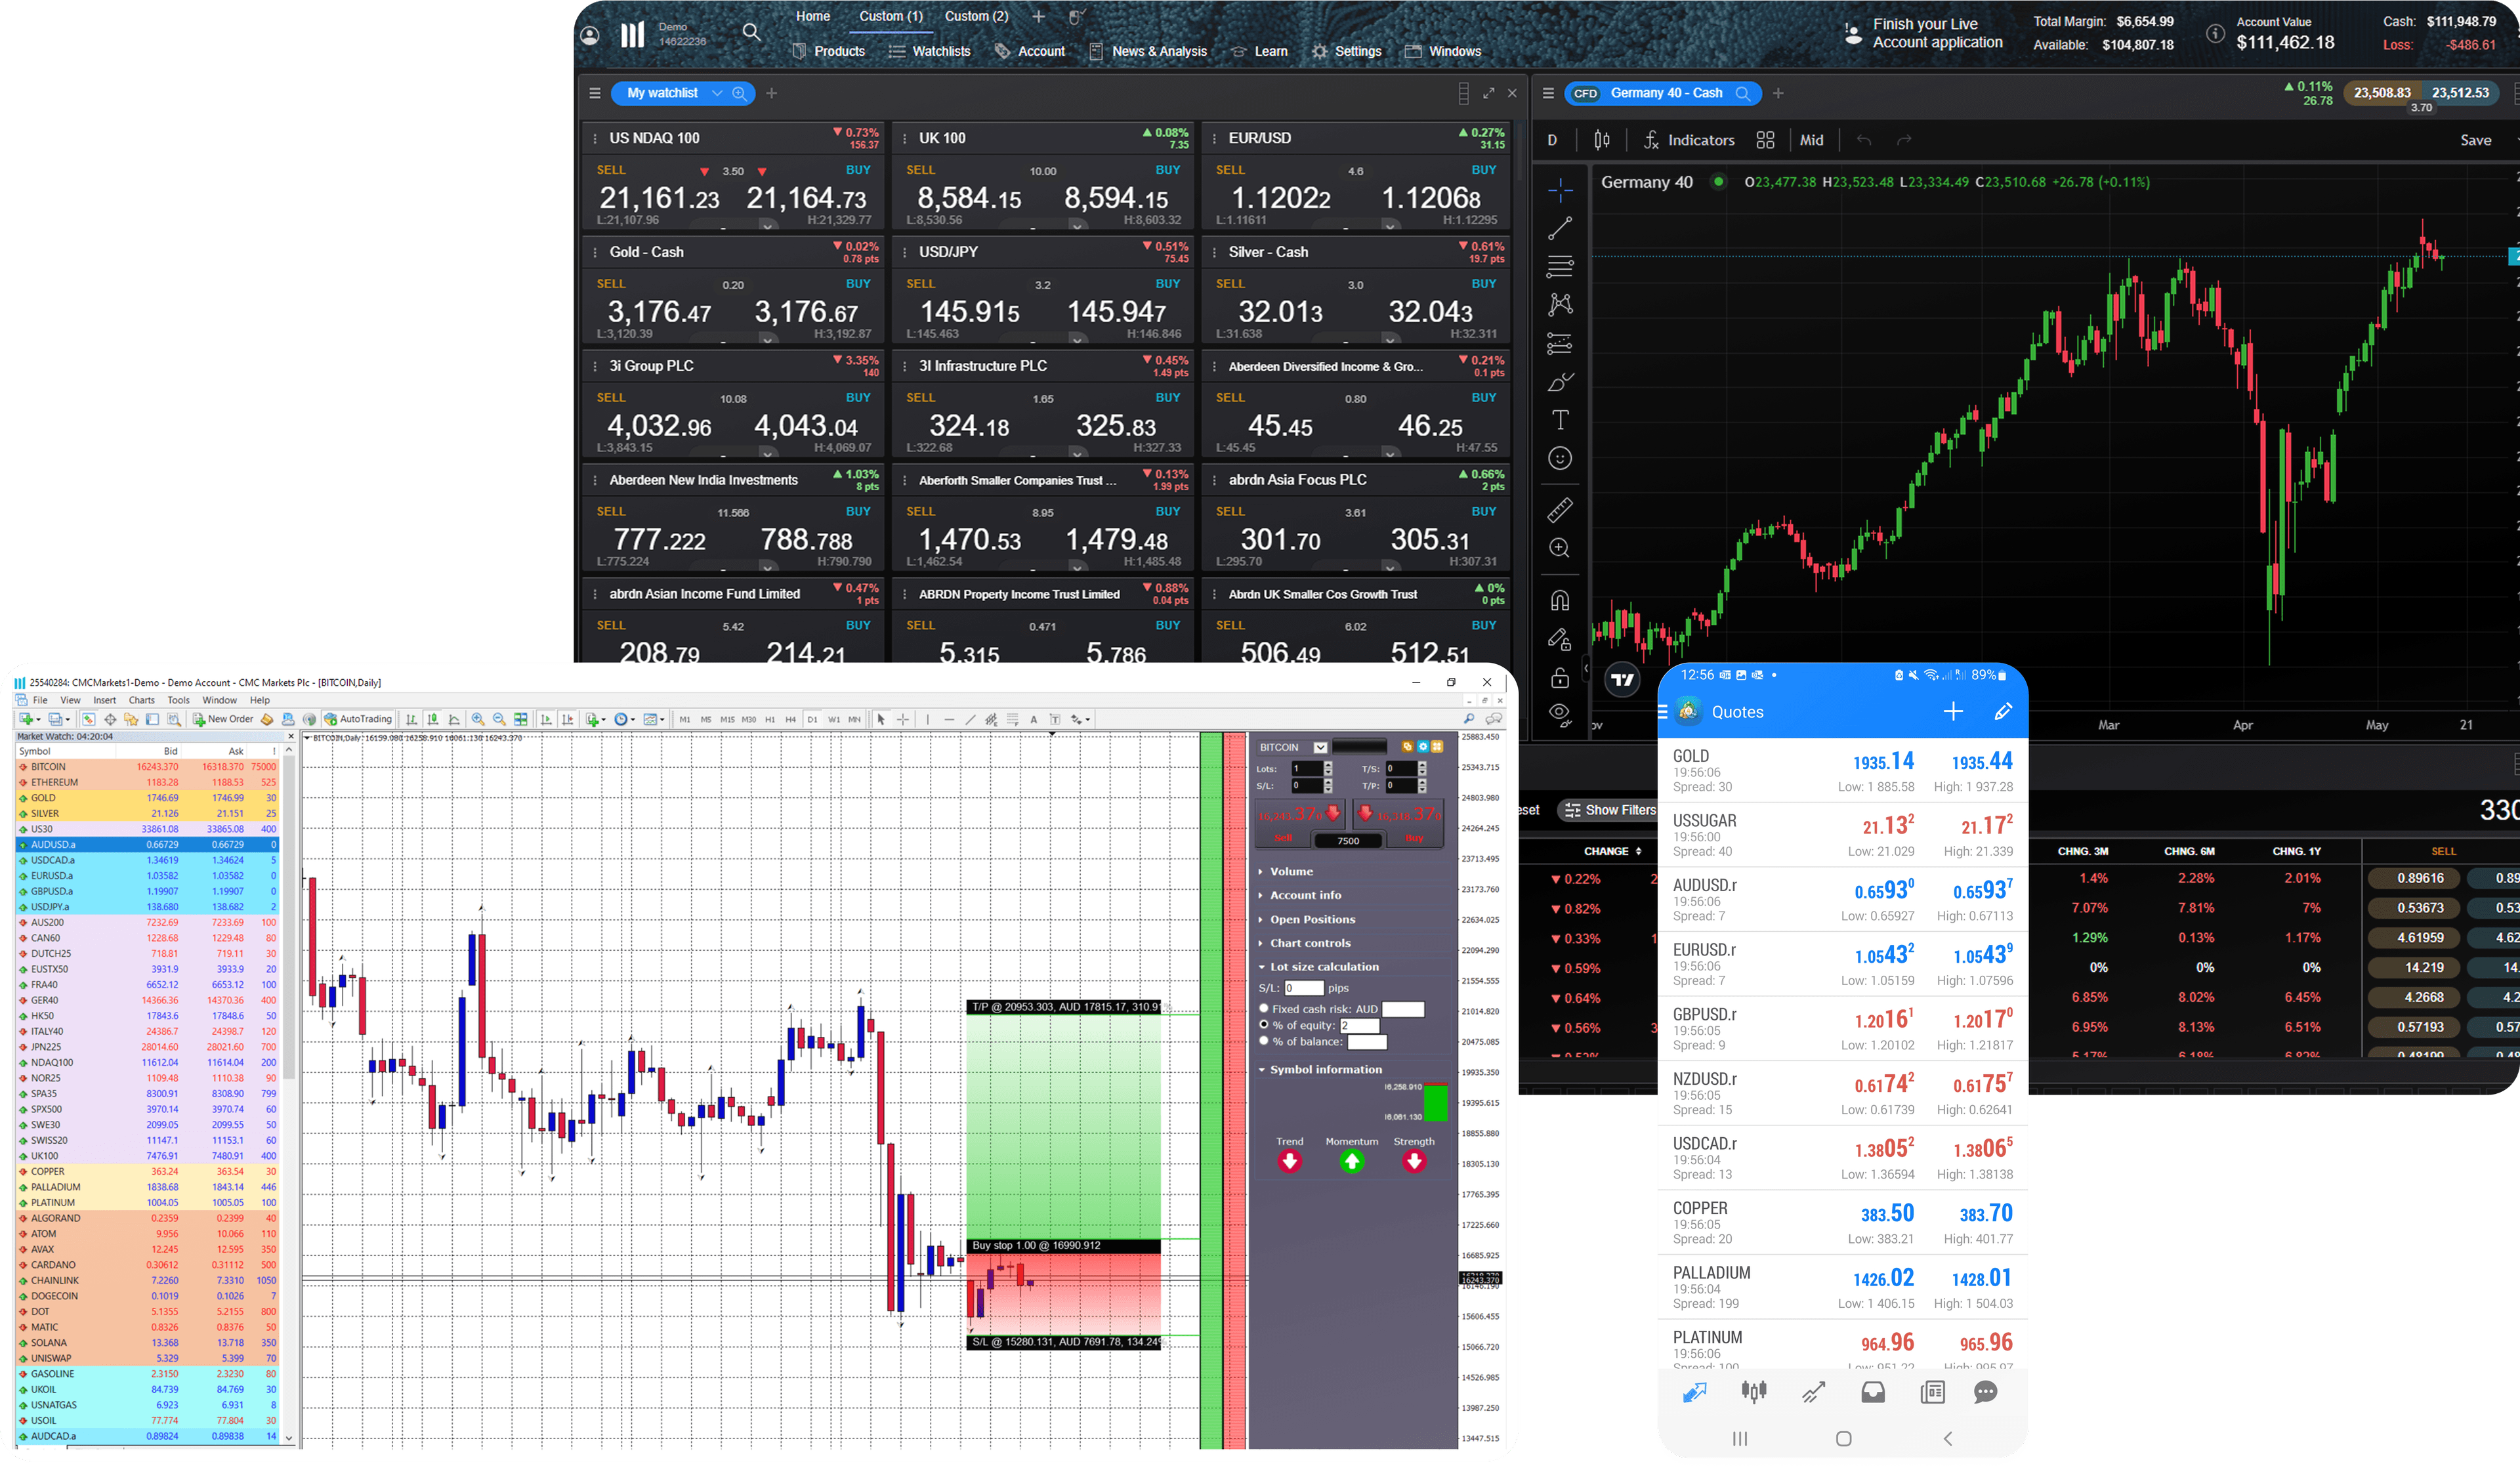
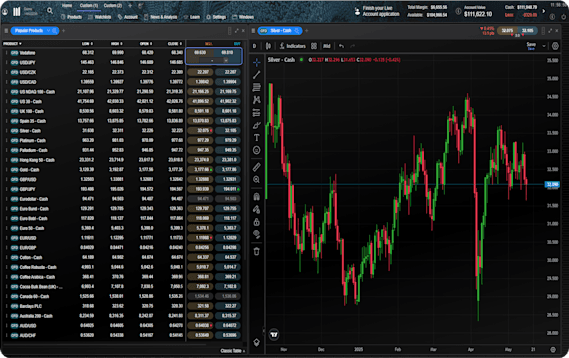
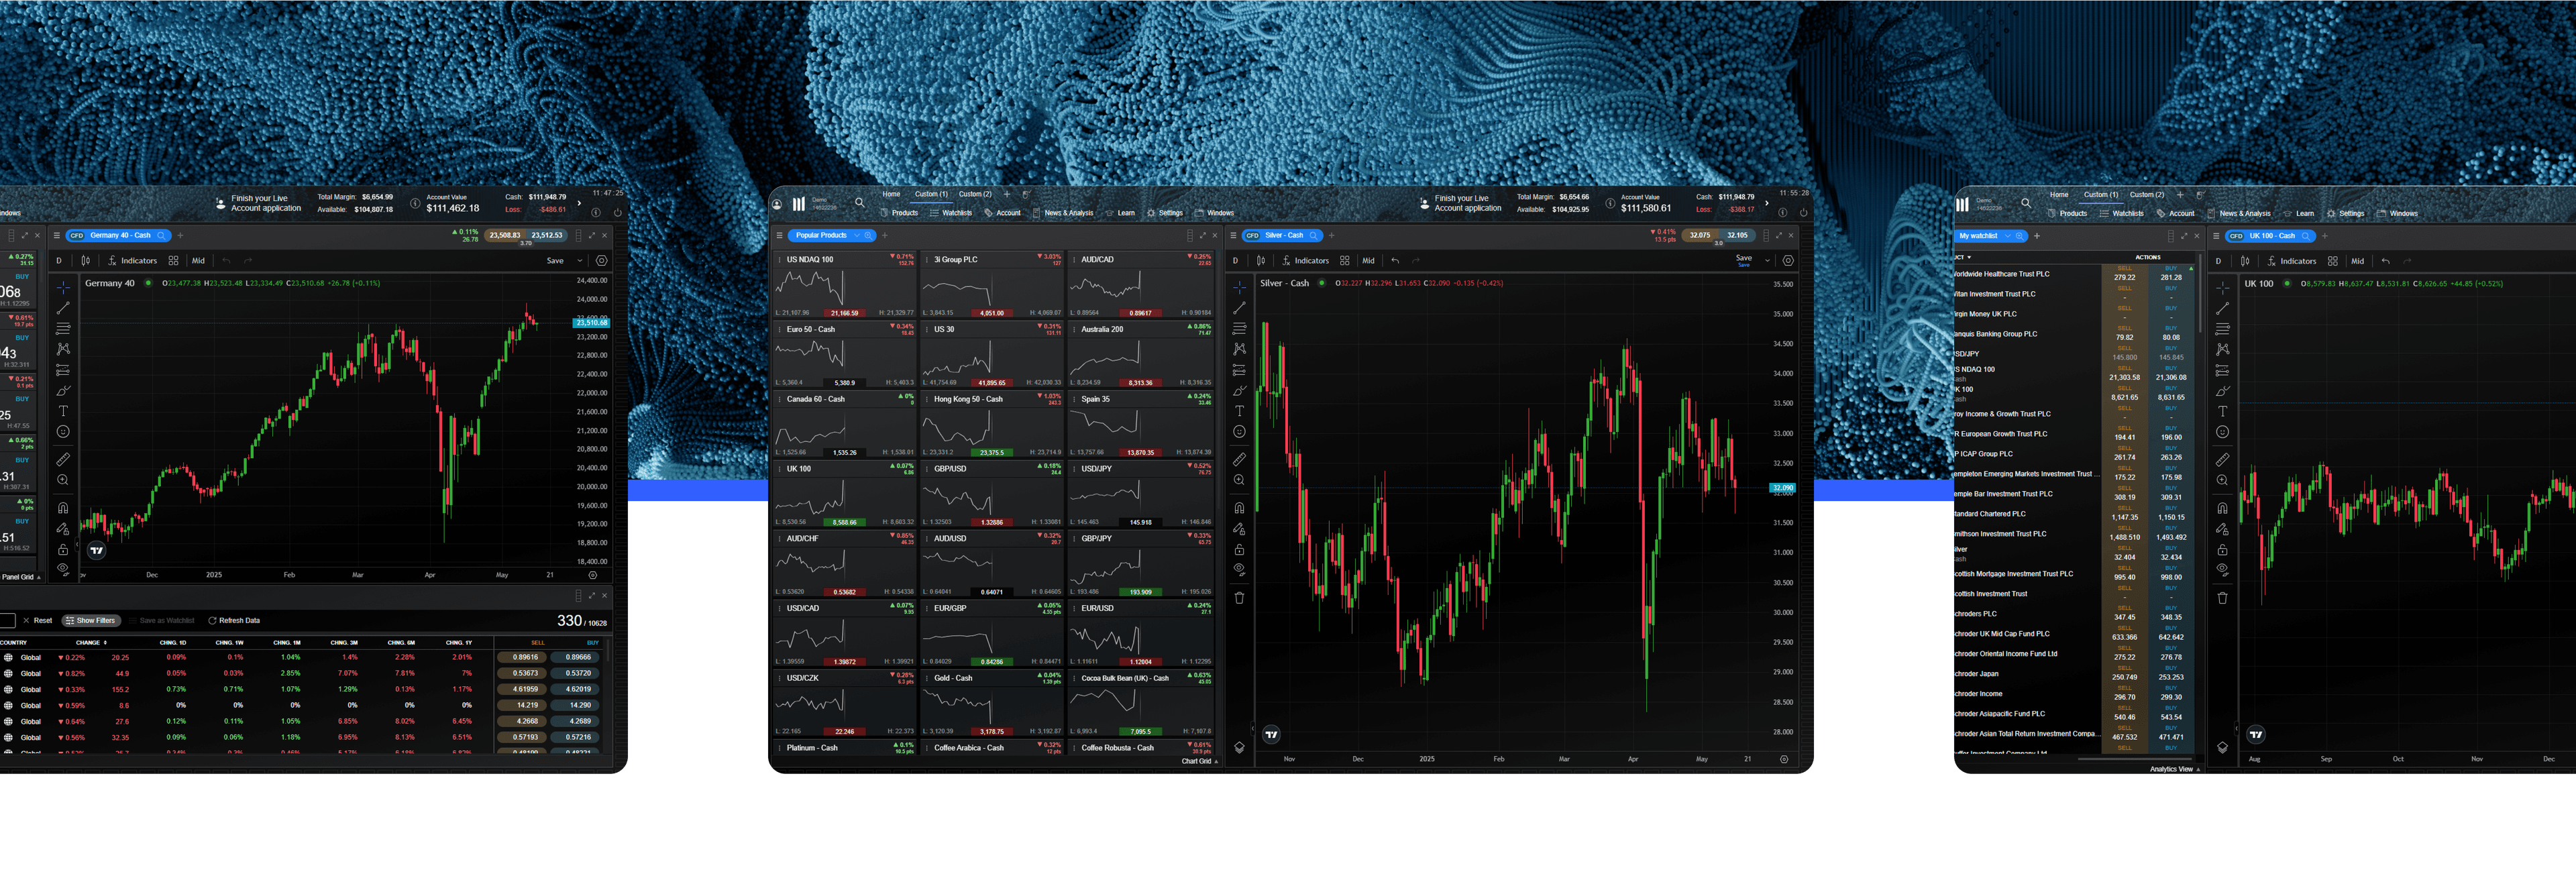
See inside our platform

Get tight spreads, no hidden fees and access to 12,000 instruments.

EMA in trading

Using the EMA in trading means that it adapts more quickly to changes in price action, which is an advantage over the simple moving average. As more weight is given to the recent price data and less to that which occurred earlier in the trading day, this makes it more sensitive to any change in price data and, theoretically, better for understanding in which direction the price may head next.

The exponential moving average therefore helps to influence traders’ decisions in the exact moment that they place a trade based on the exact price movements, as opposed to what was happening on trading charts​ in the past.

This higher weight of recent price data is useful when analysing volatile markets, where there may be abrupt price changes. It is particularly useful for identifying trends and recent swings on price charts to highlight trading patterns​. It also means that there is less of a lag, as the EMA instead reacts quickly to price changes. Therefore, developing an exponential moving average strategy is great for traders who favour short-term strategies, such as day trading in fast-moving markets.

Exponential moving average example

What is the difference between simple and exponential moving averages?

Unlike the simple moving average​​ (SMA), which is a calculation of the average price of a security over a certain length of time, the EMA gives more weight to the most recently occurring prices. This is the major difference between the moving averages, and it also explains why the EMA is preferred by many traders, as it is more responsive than the SMA. However, as with most technical indicators, the EMA works better when used with its component rather than by itself, as the EMA alone cannot guarantee success.

How to calculate the EMA

In order to learn how to calculate the exponential moving average, the simple moving average should be calculated first to get the initial EMA value. This will then lead you to finding the exponential moving average equation.

To find the simple moving average, you must find the average number of the past data points, which are often past closing prices. If you were seeking a security’s 50-day SMA, the closing prices of the past 50 days would be added together, then divided by 50.

Secondly, calculate the the weighting multiplier (or smoothing constant). This happens by dividing 2 by the number of time periods, plus 1.

Thirdly, calculate the EMA for each day between the initial EMA value and the current day, using the price, the multiplier and the EMA value of the previous time period.

Exponential moving average formula

  • SMA = (N – period sum) ÷ N
  • The weighting multiplier (or smoothing constant) = 2 ÷ (time period + 1)
  • EMA = (closing price – previous day’s EMA) x weighting multiplier + previous day’s EMA

When N equals the number of days in the given time period, and period sum is the sum of closing prices in that time period.

Join a trading community committed to your success

How to use the EMA indicator

When a trader is using an exponential moving average indicator within their strategy, they may choose to buy when the price dips near, or just below, the EMA line. On the other hand, when the EMA is falling, traders may choose to sell when the price is rallying towards, or just above the EMA.

The EMA can be an indicator for support and resistance levels​. This is because support and resistance levels are dynamic and constantly evolving, due to the fact that they’re based on more recent price action​. When the EMA is rising, it is supporting the price action, while the falling EMA is providing resistance to positive price action.

However, a key drawback of the exponential moving average is that it is based on historical data, so it cannot predict future price movements. Furthermore, the EMA can also be prone to false signals, such as false positives and false negatives, meaning that it could mislead traders. By interpreting trendlines​​ based on historical data, traders may make decisions based upon the conclusion that the trend will repeat itself.

How to set up EMA

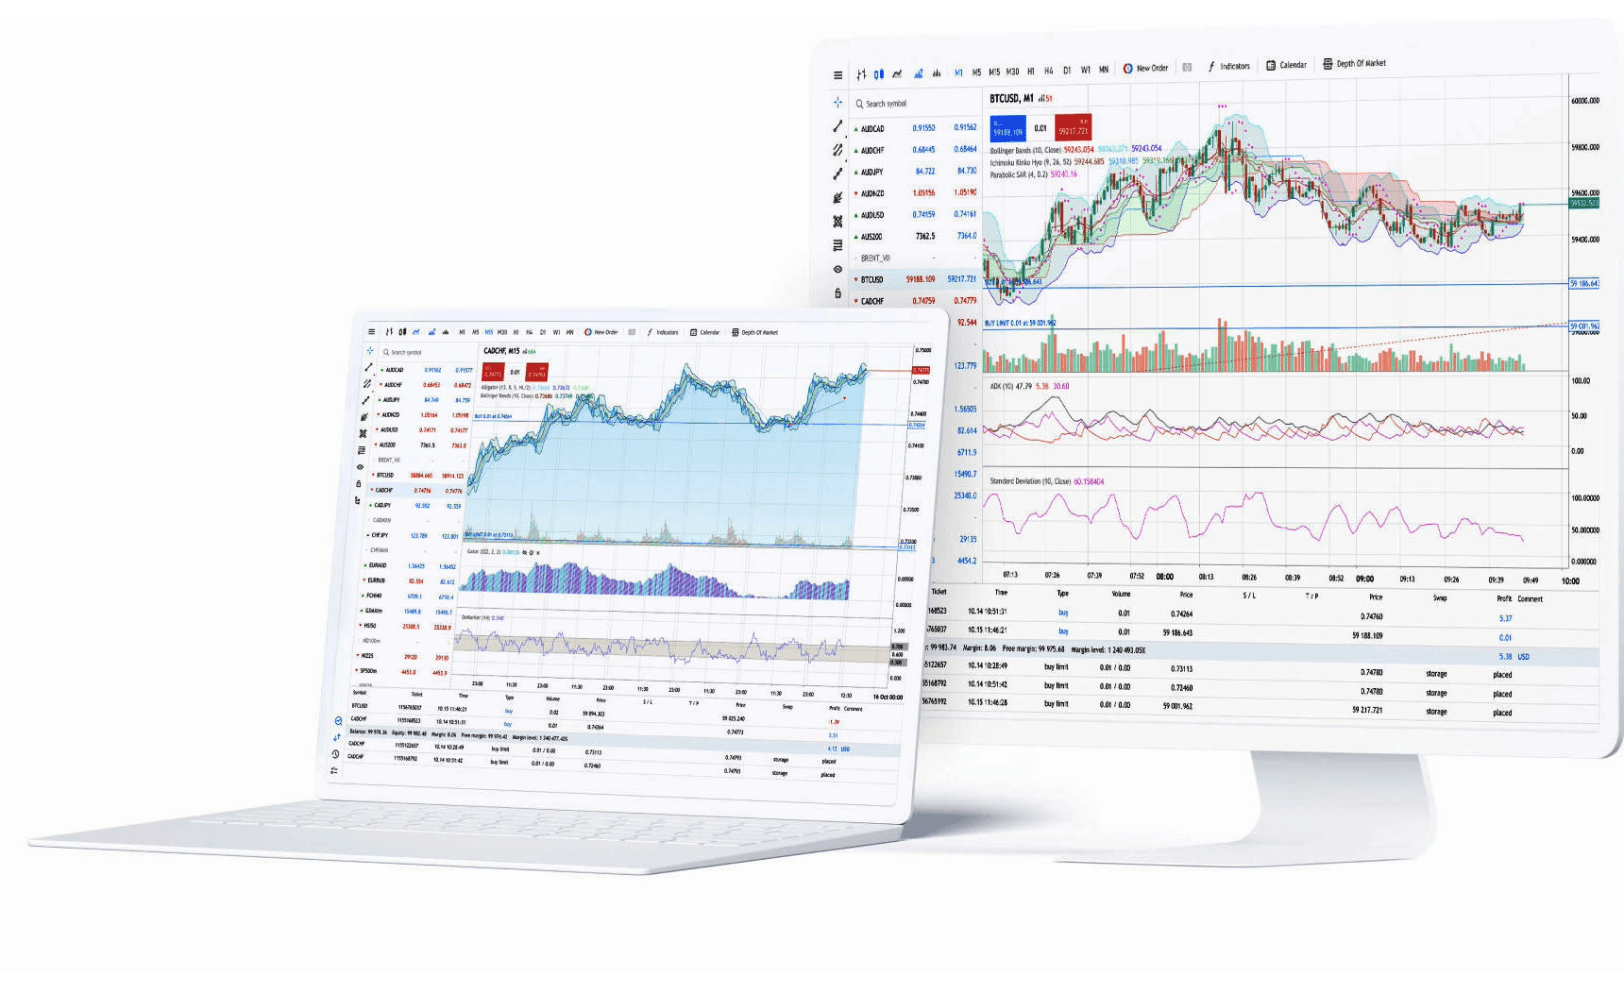
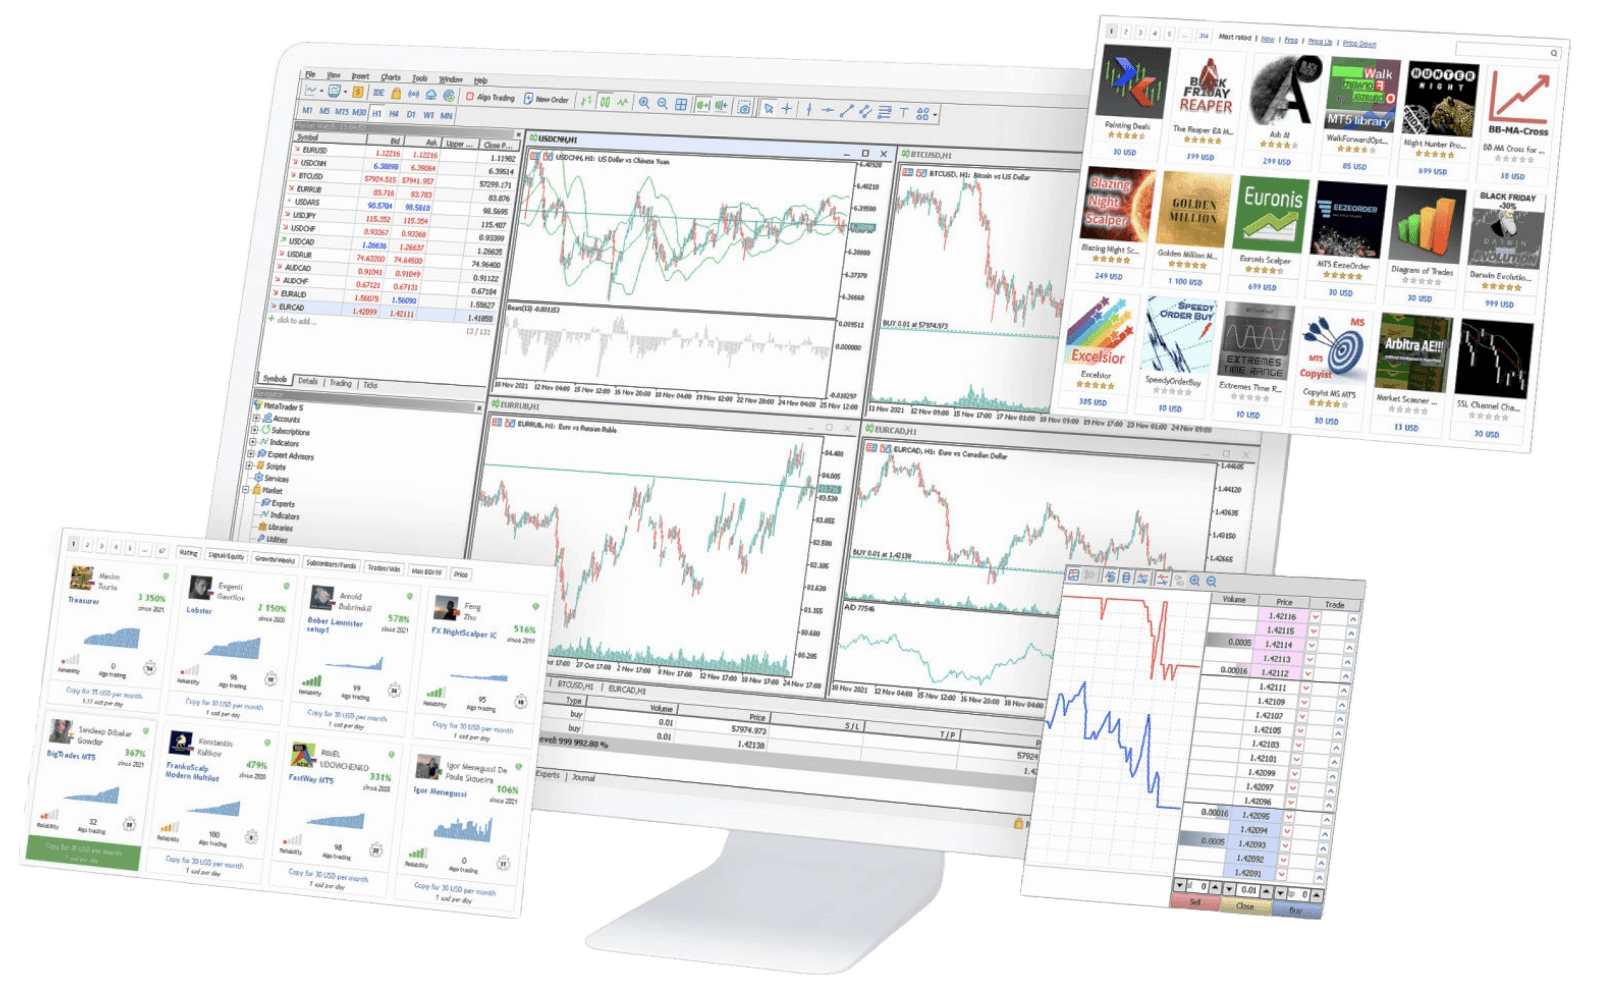
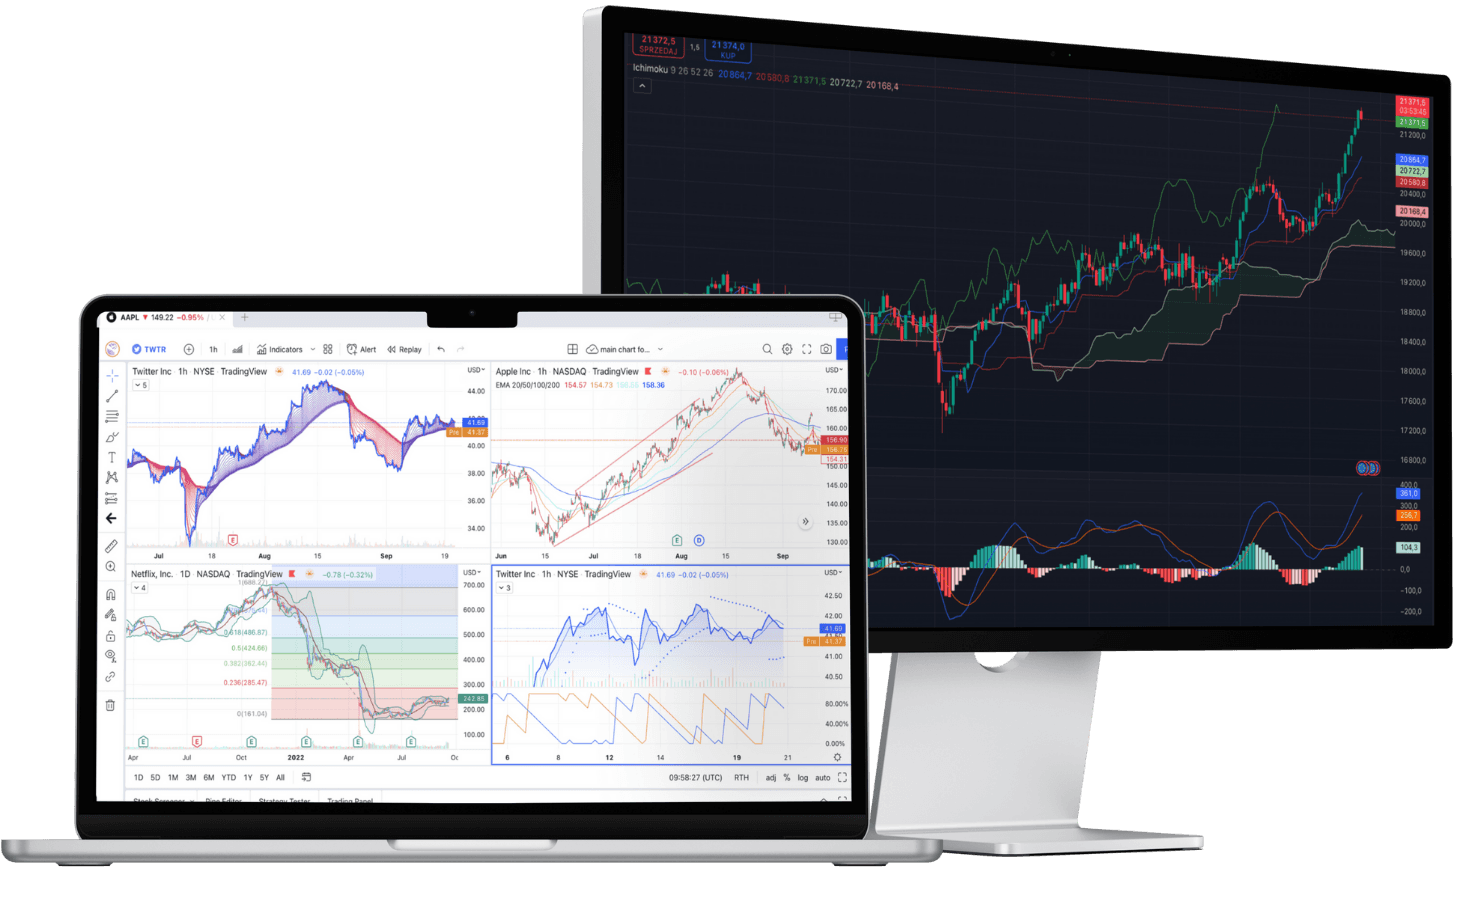
By registering for an account, you can take advantage of our charting features, including a wide range of technical indicators. Both the SMA and EMA, along with a weighted moving average indicator, are available to incorporate within your trading strategy on our award-winning online trading platform, Next Generation. You can also use our drawing tools to add support and resistance levels, trendlines, channels, Fibonacci retracements and other price projection tools. You can register for a demo account first to practise with £10,000 worth of virtual funds.

Simply choose your product between spread betting and CFDs​, choose the market that you would like to trade and a particular asset, and add the EMA indicator to your trading chart through the drawing tools section.

How to set up EMA on MT4

We also host the internationally recognised MetaTrader 4 system for those that are already familiar with the platform. Many of the same technical indicators are available on MT4 as well as Next Generation, including the simple and exponential moving averages. Many other indicators and add-ons are ready to download by following the process to create an MT4 account.

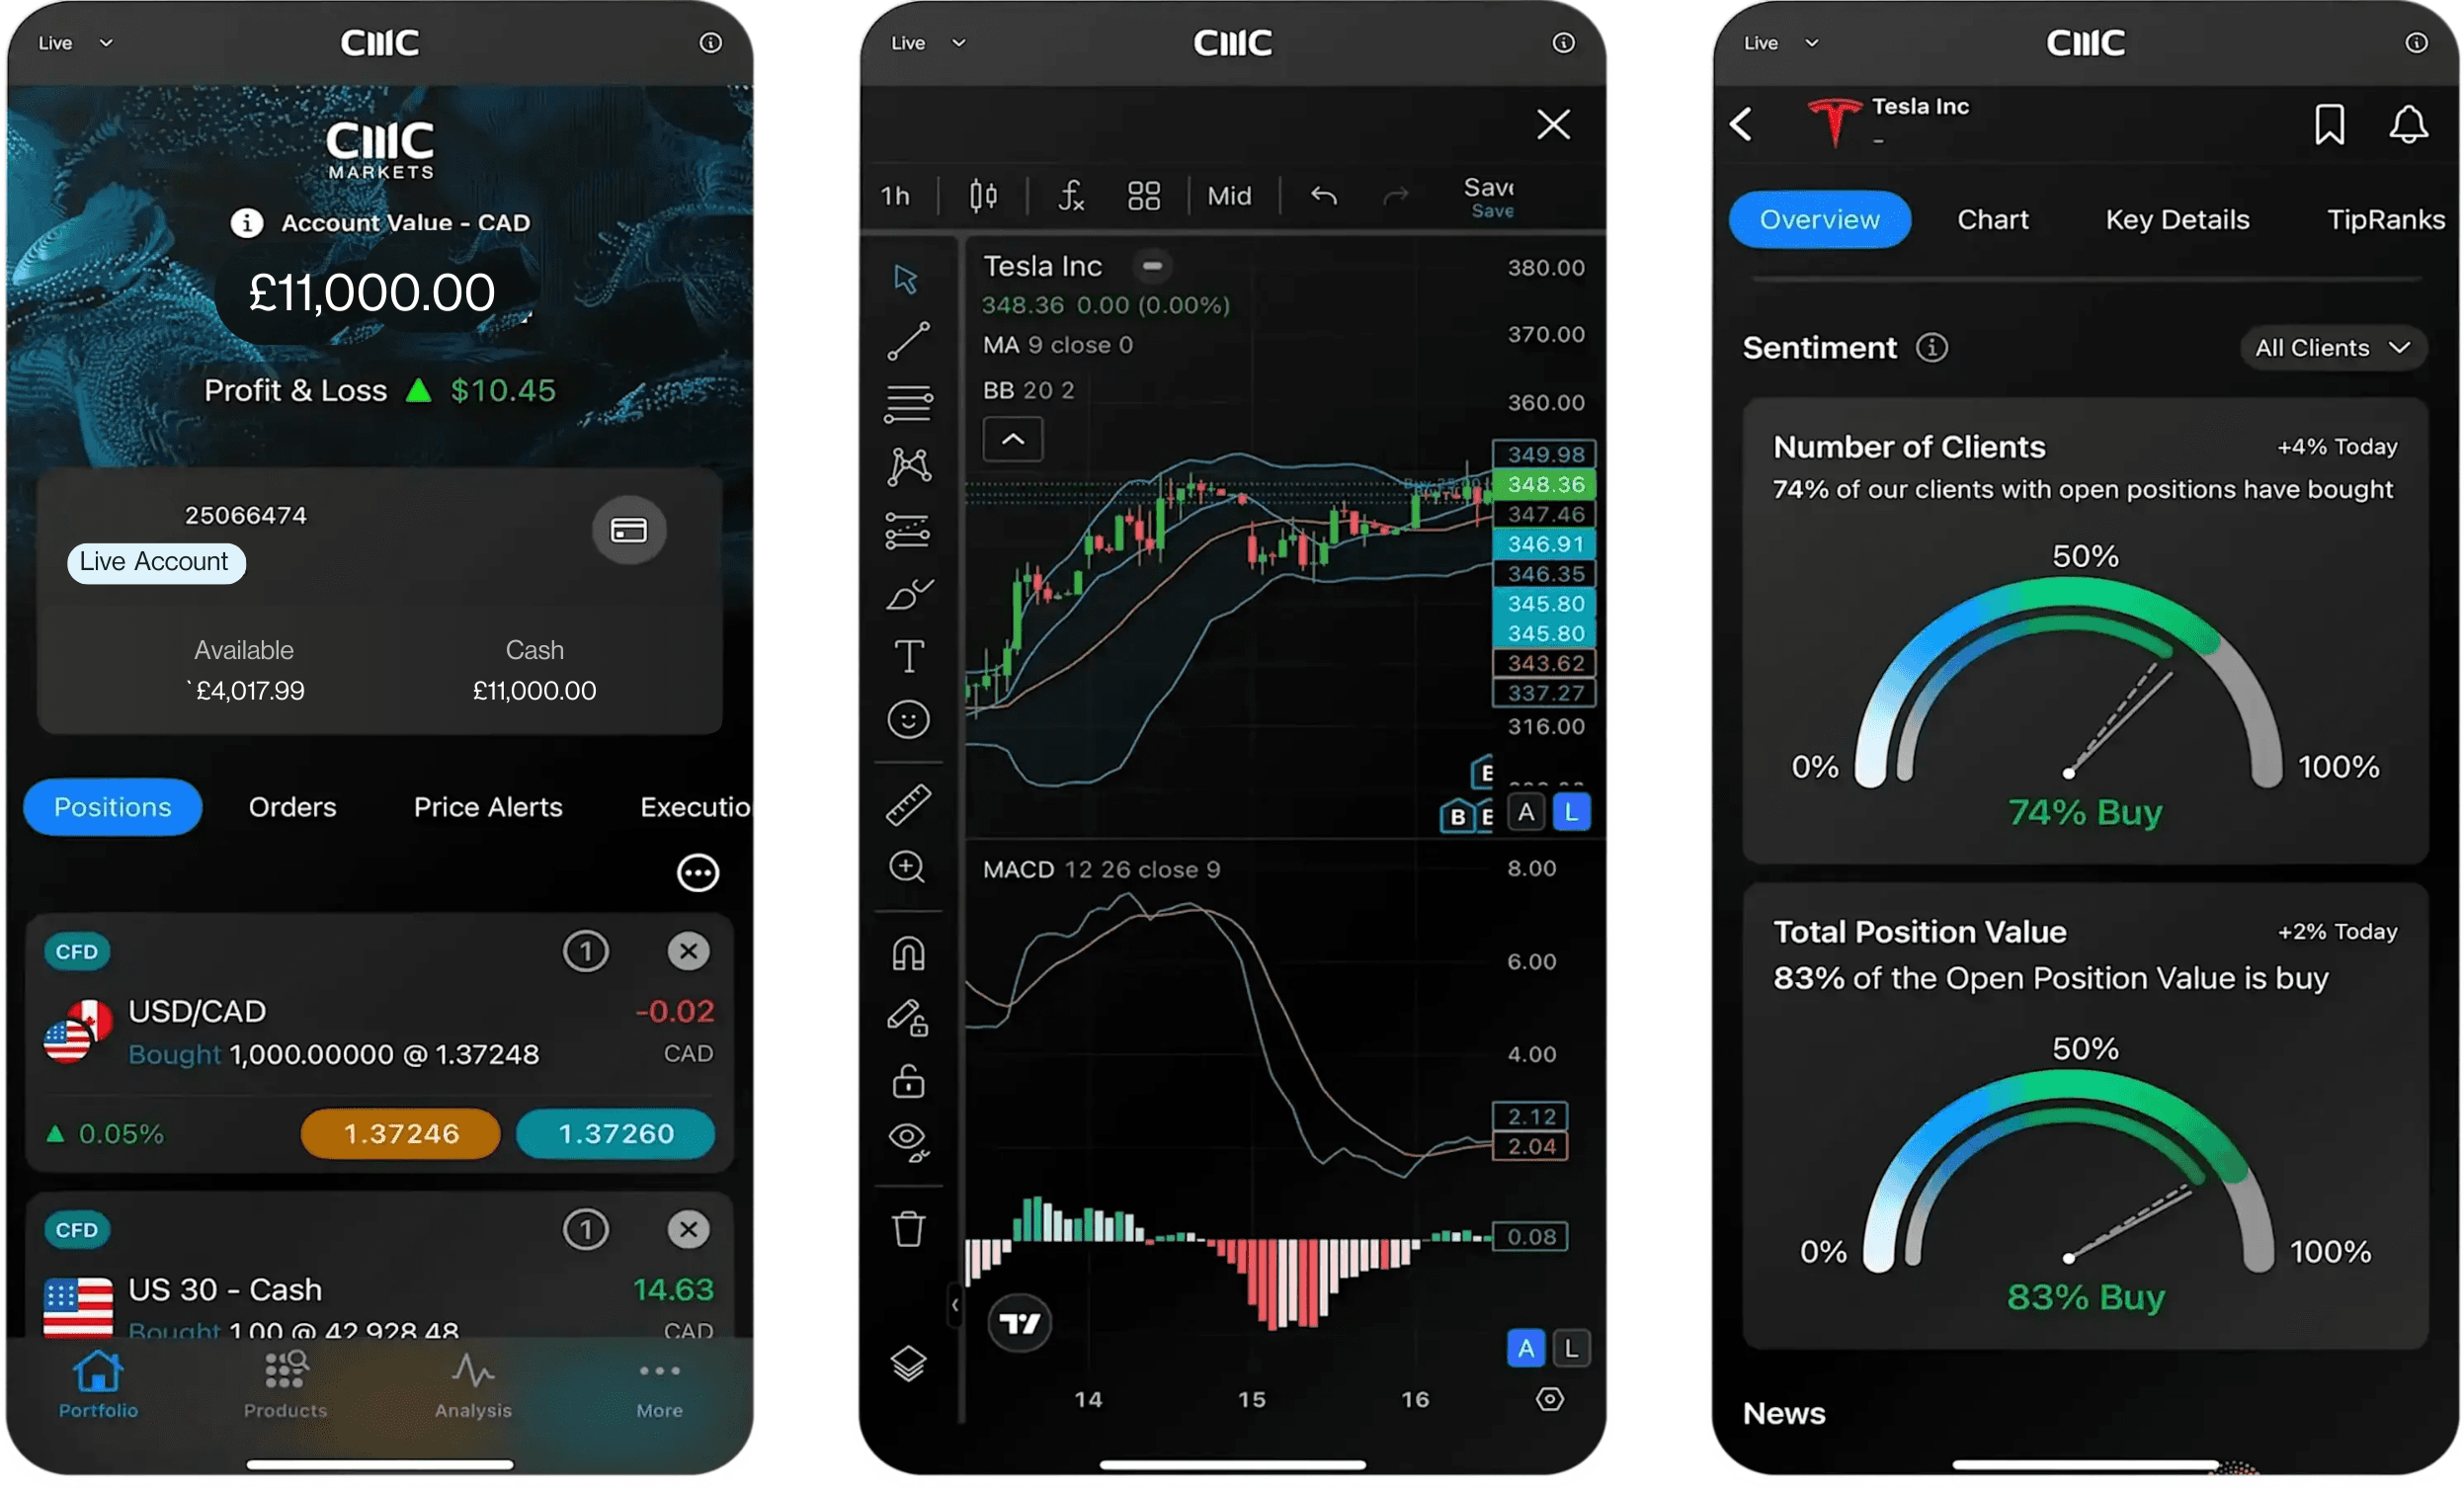
Powerful trading on the go

Seamlessly open and close trades, track your progress and set up alerts

Summary

The exponential moving average is a valuable tool for traders to help identify trends of a financial instrument over a period of time. By giving more weight to recent price movements rather than equal averages like the simple moving average, a trader may be able to account for a higher degree of subtlety within the price action. However, as it is based on historical data, it is not a credible source for future predictions and traders can be misled by false signals. Therefore, it should be used in conjunction with other forms of technical and fundamental analysis when building an efficient trading strategy​​.

Join over 275,000 other committed traders

1

Apply for a live account

Complete our straightforward application form and verify your account

2

Fund your account

Deposit easily via debit card, bank transfer or PayPal

3

Find and trade

One touch, instant trading available on 12,000 instruments