This article is brought to you by TradingView
TradingView is a leading platform used by traders, investors, and analysts worldwide. Whether you're trading stocks, ETFs or cryptocurrencies, TradingView offers a comprehensive set of tools to analyse markets effectively.
In this article, we will explore how TradingView charts work, how to customise timeframes for various trading strategies, and how these features empower traders to interpret market movements precisely.
Visualising markets with TradingView charts
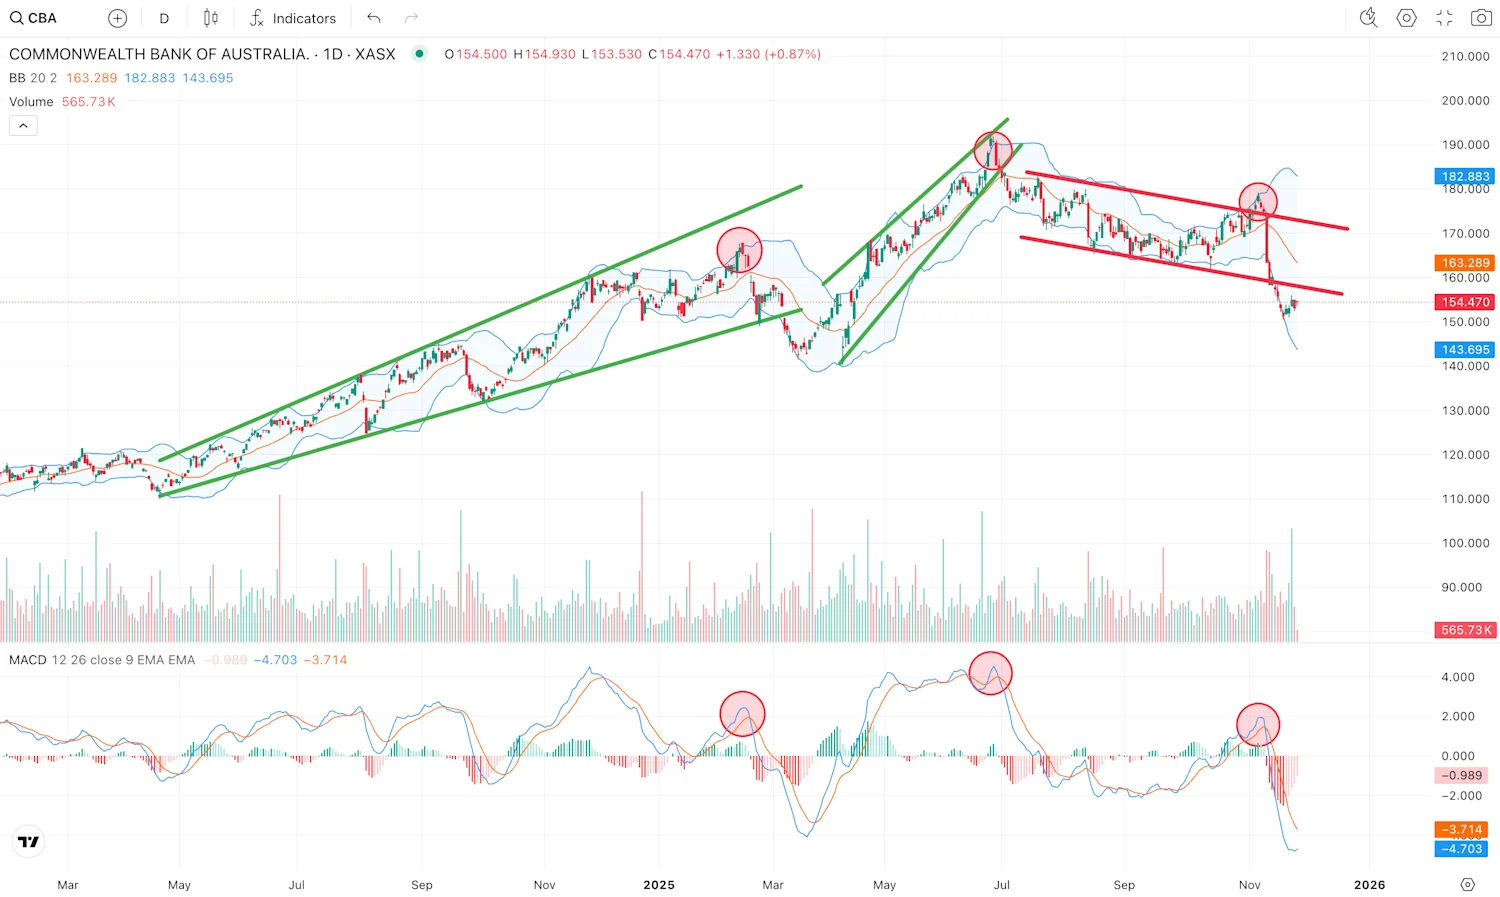
TradingView charts are designed to be transparent, flexible, and highly customisable, enabling users to visualise market trends, price action, and volume with ease. With access to millions of assets, from popular stocks like NVIDIA to trending cryptocurrencies like Ethereum, these charts deliver real-time data that can be tailored to suit individual or group trading styles and preferences.
TradingView helps investors apply technical analysis, the study of historical price movements and trading volumes used to better understand market behaviour. This approach allows traders to interpret price action, recognise patterns, and identify potential future trends based on how markets have reacted in the past. Unlike fundamental analysis, which focuses on economic factors or company performance, technical analysis centres on chart patterns, indicators, and price action to guide trading decisions.
TradingView streamlines this process by offering a fast, intuitive, and visually clean interface. Whether you're scanning markets for a quick overview or conducting deep analysis, TradingView minimises the time and mental effort needed to perform technical research.
Chart types explained
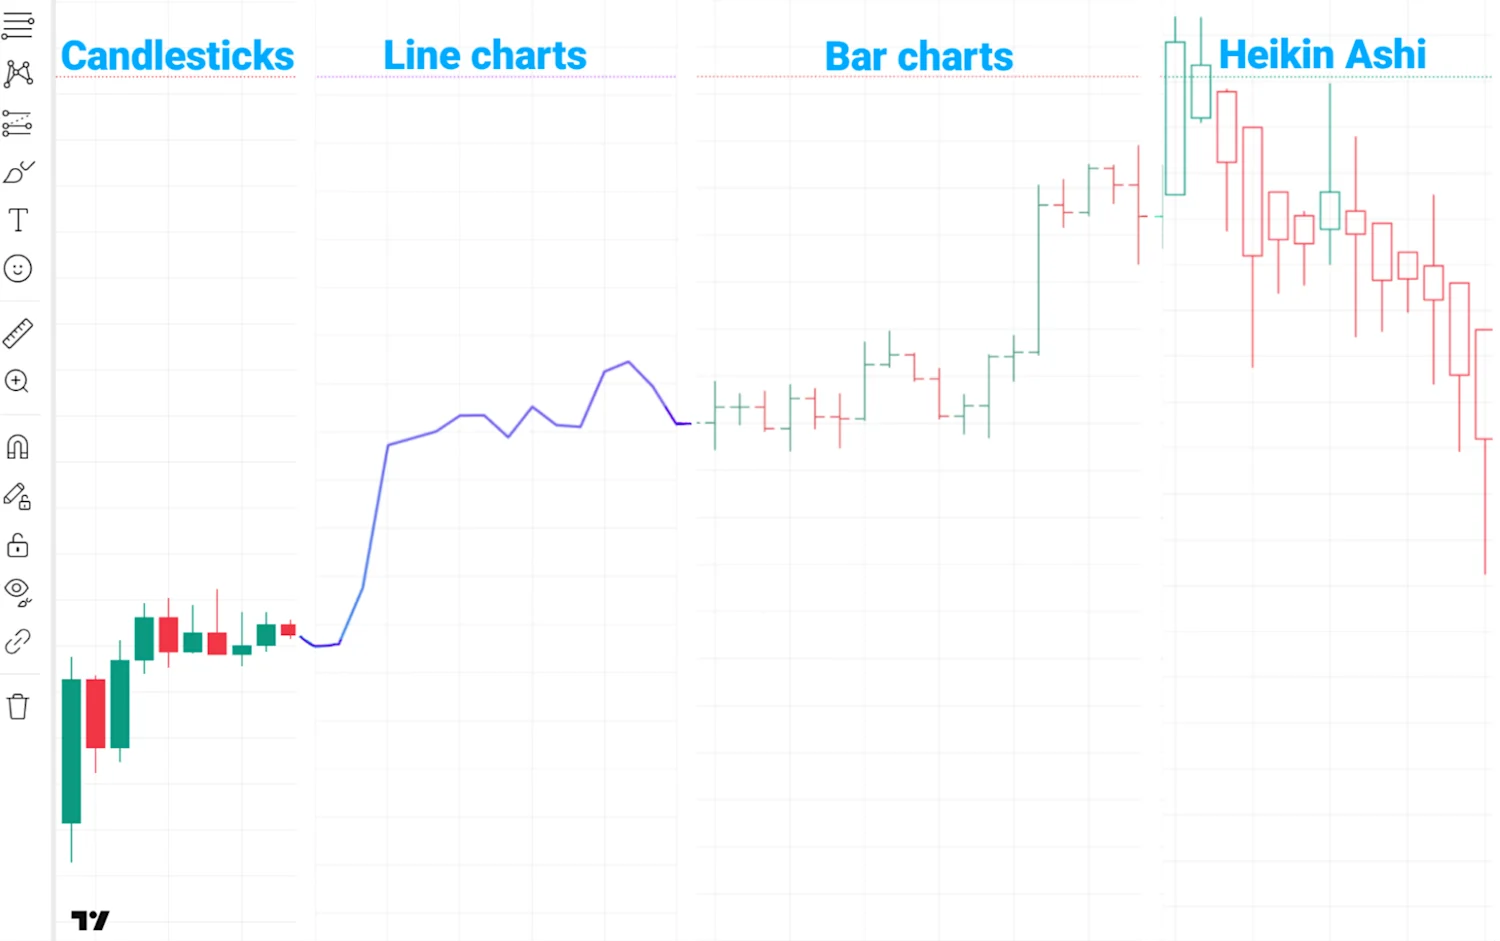
To accommodate different analytical approaches, TradingView supports a great diversity of chart types including:
Candlestick Charts: The most commonly used chart by traders. Each "candle" displays four essential data points — open, high, low, and close (OHLC). Candlesticks provide visual insight into market sentiment and price momentum.
Line Charts: A simple chart that represents closing prices over time. Ideal for beginners or those focusing on long-term trends.
Bar Charts: Similar to candlesticks but displayed as vertical bars. They show the same OHLC data but are less visually intuitive.
Heikin Ashi: A smoothed version of candlestick charts that filters out market noise and helps identify trends more clearly.
Every chart type serves a unique purpose, and TradingView allows users to switch between them effortlessly, depending on their analysis goals. Once the chart type has been selected, the next step is choosing a timeframe.