This article is brought to you by TradingView
Trendlines and trend identification form the foundation of technical analysis. Whether you're a beginner learning the ropes or an experienced trader refining your strategy, understanding how to draw and interpret trendlines can significantly enhance your decision-making.
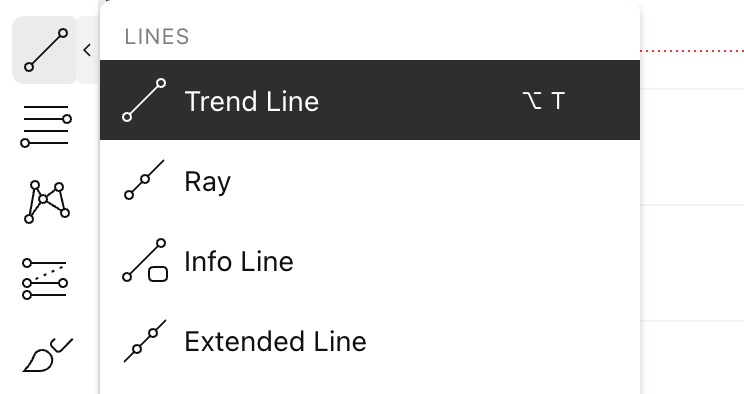
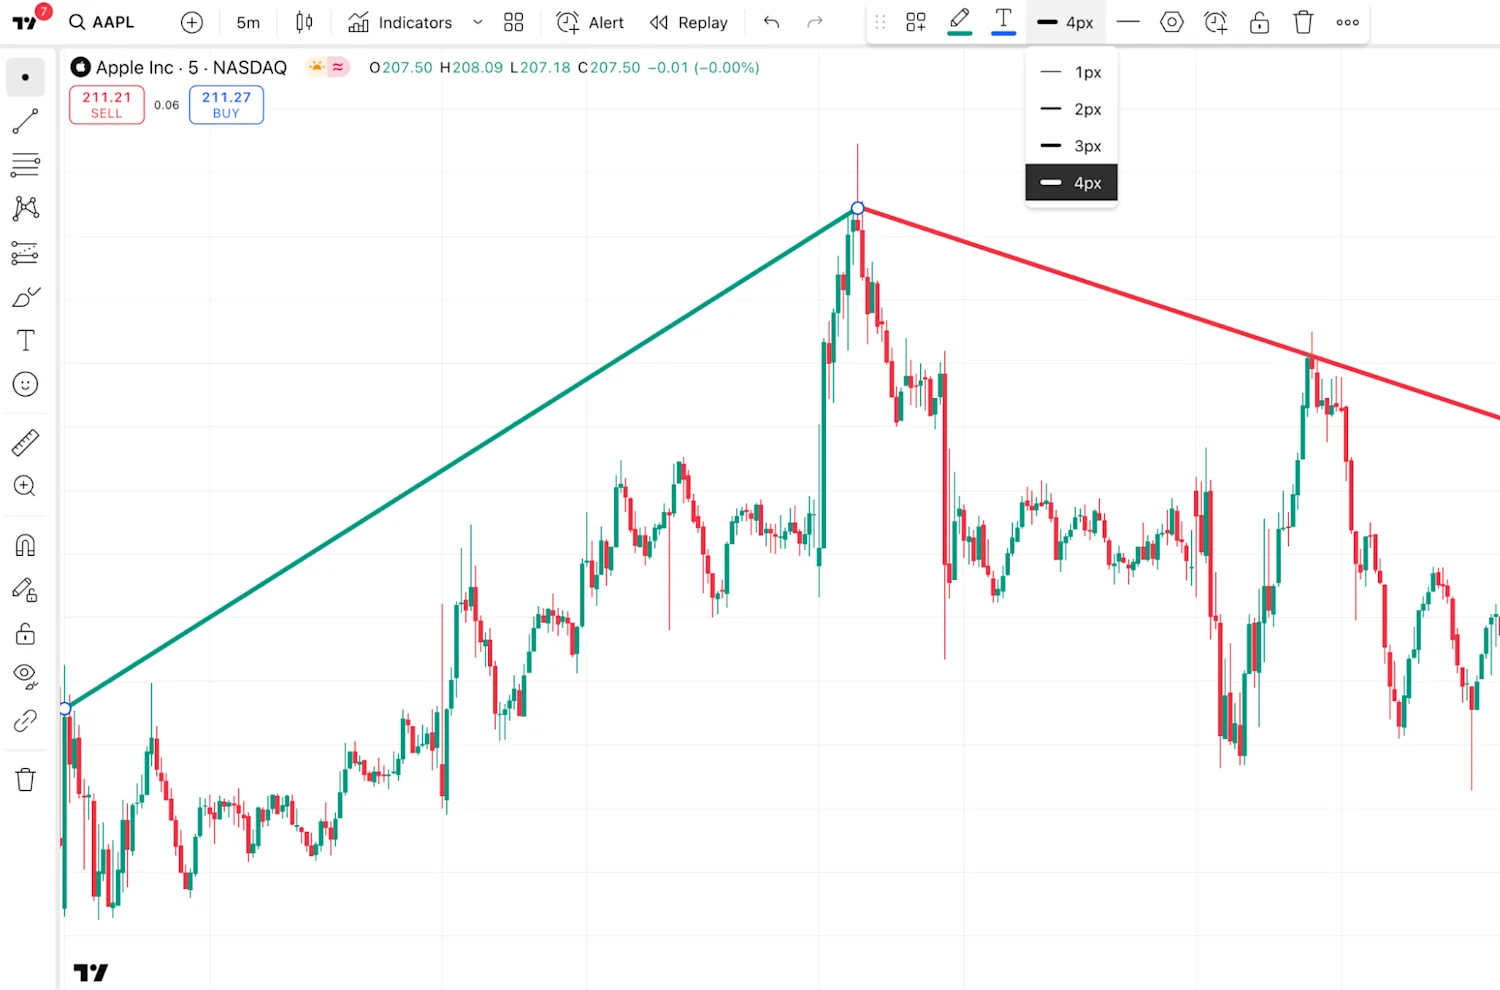
This guide explains how to draw trendlines using TradingView, identify market trends, and what those trends say about market direction.
What is a trendline and why is it important?
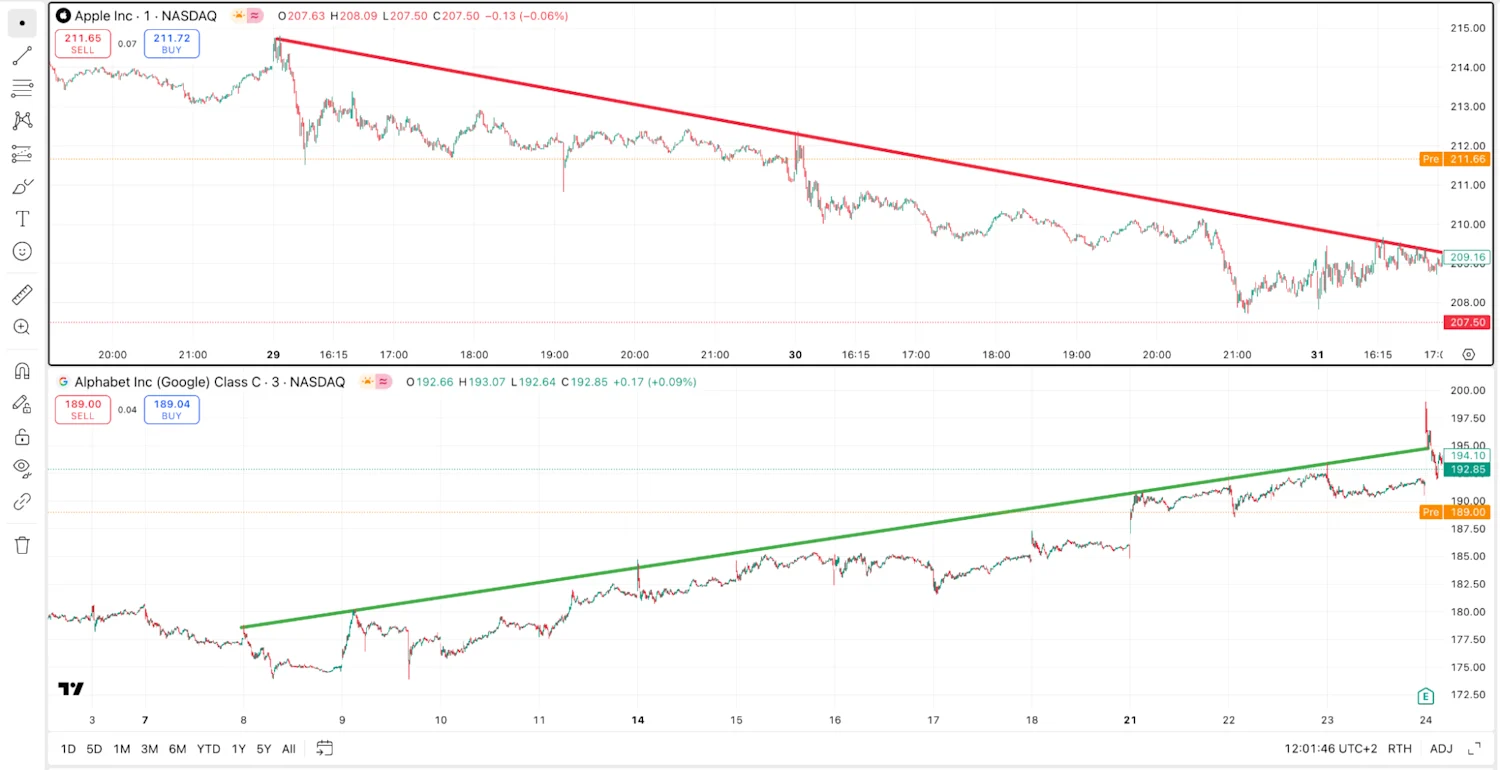
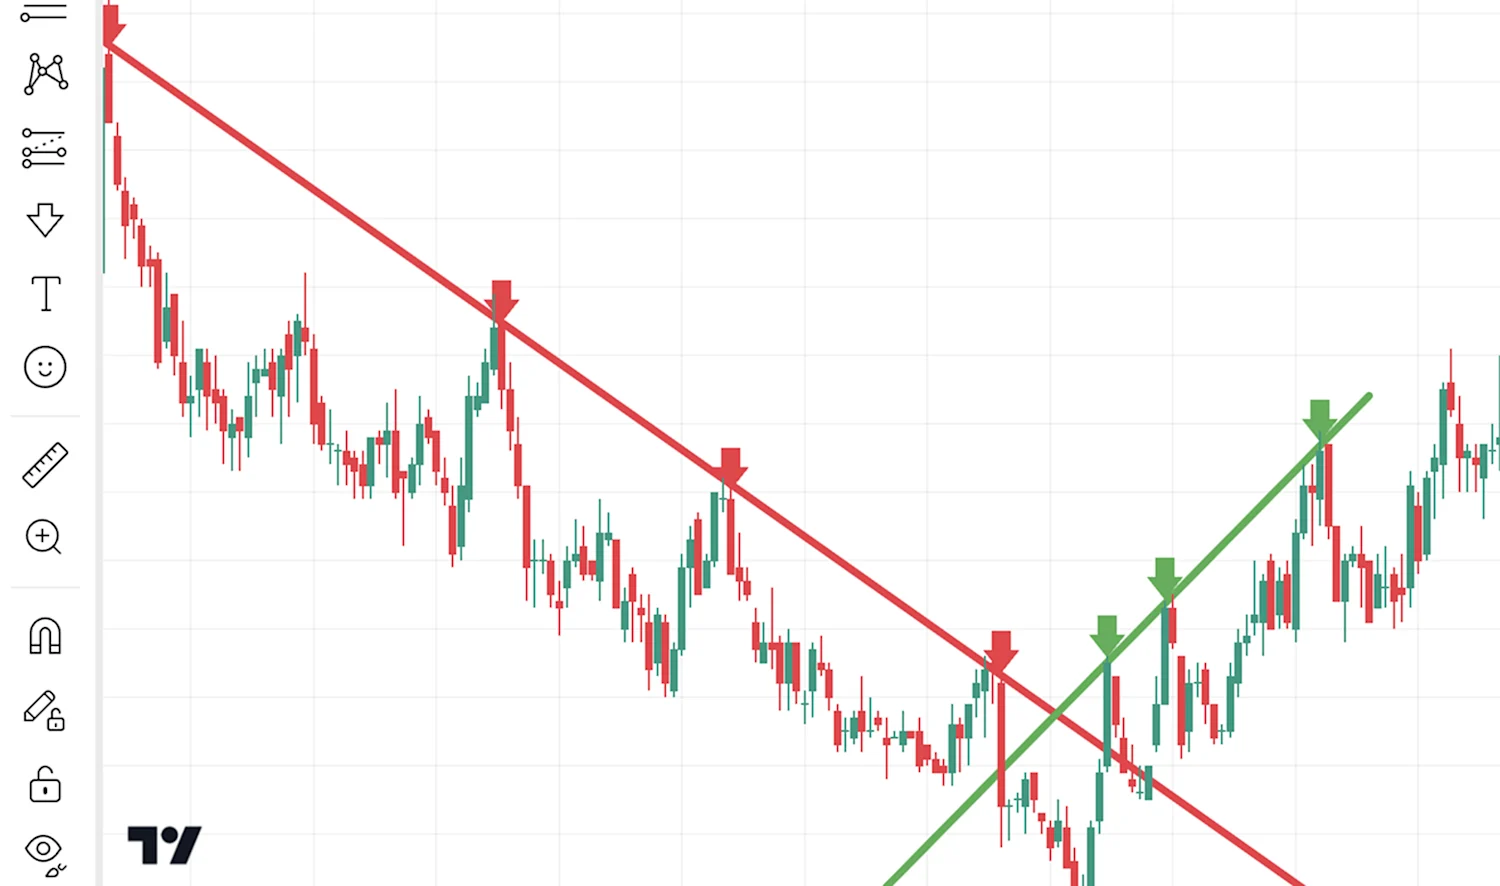
A trendline is a straight line drawn on a chart connecting two or more significant price points — typically notable highs and lows.
It shows the general direction of price movement and helps traders to determine their trading outlook, identify potential entry or exit points, assess trend strength, and recognise possible reversals or breakouts.
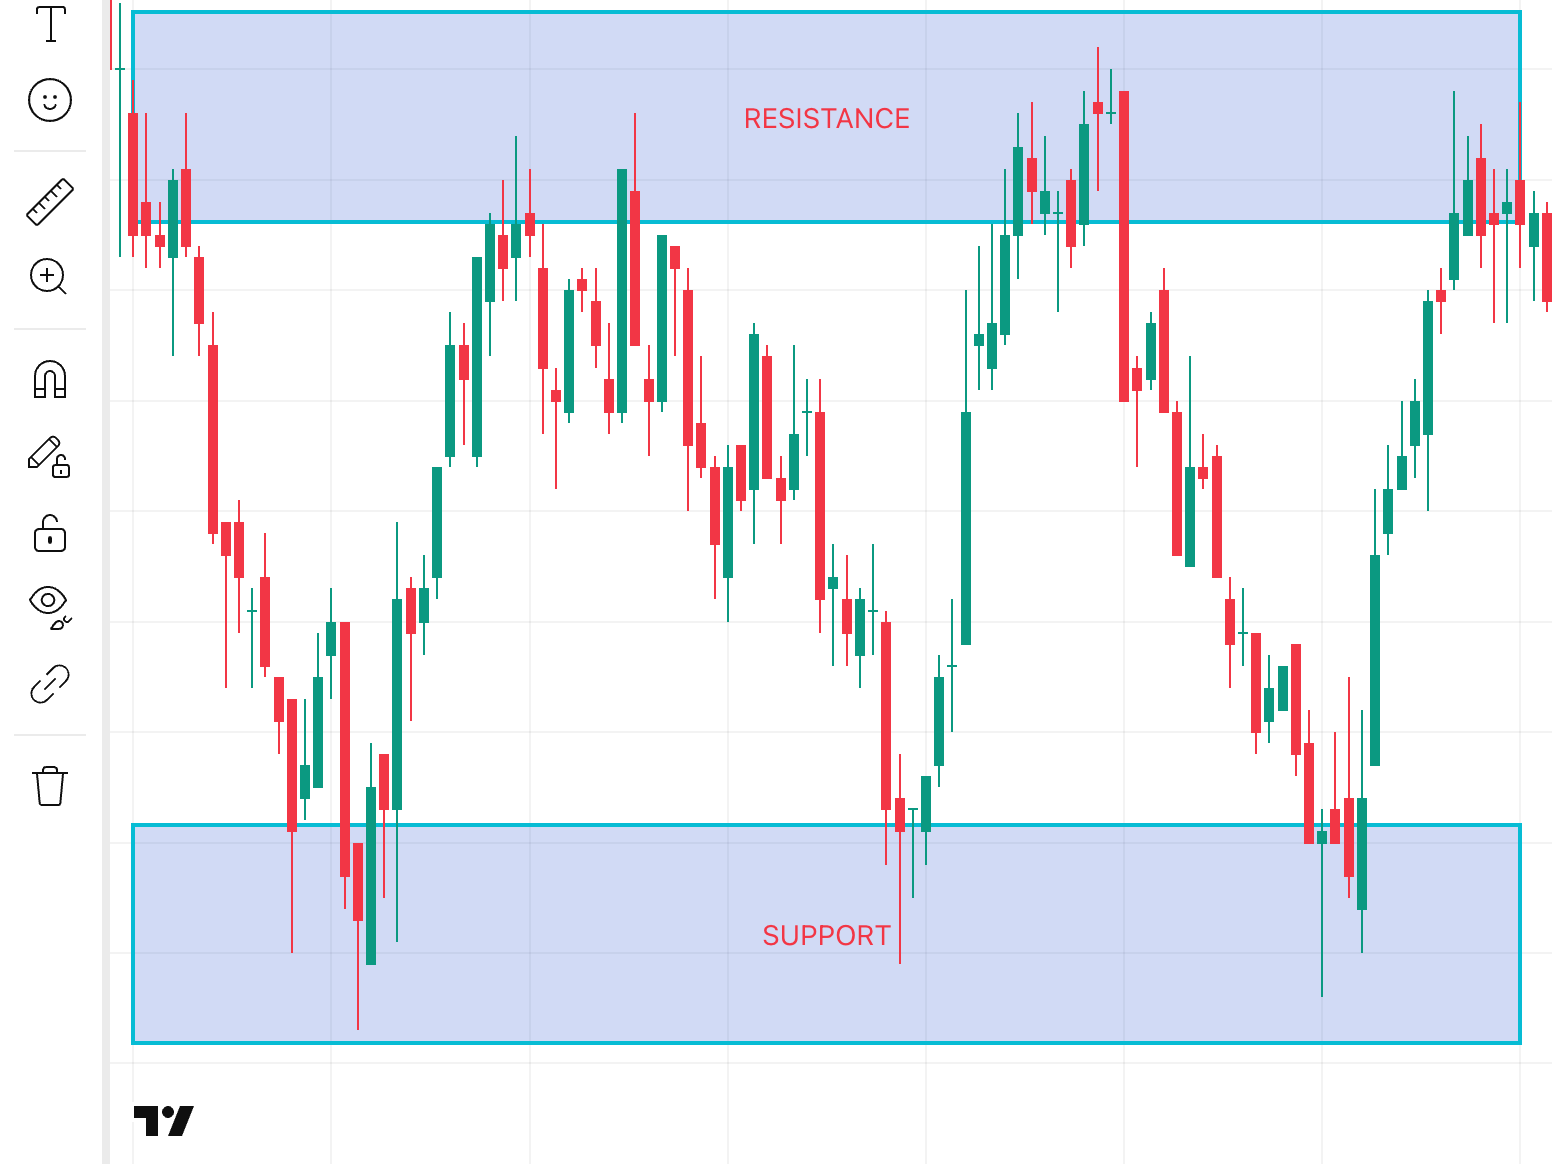
Trendlines act as dynamic support and resistance levels, and are more reliable when confirmed by multiple touches, without price breaking through them.
Trendlines are among the essential tools in an investor's toolkit. They can provide actionable price insights, simplifying what can be very complex price movements. For investors, trendlines can help identify price direction and highlight common market behaviour. People often react to familiar levels, buying where prices have risen before or selling where they’ve fallen, making trendlines critical for both experienced traders and beginners.
This repeated behaviour can reinforce trends and create key decision points on the chart. Recognising these patterns can help investors align with momentum, avoid mistimed entries, and manage risk more effectively. That repeated behaviour makes trendlines a visual guide to market psychology.