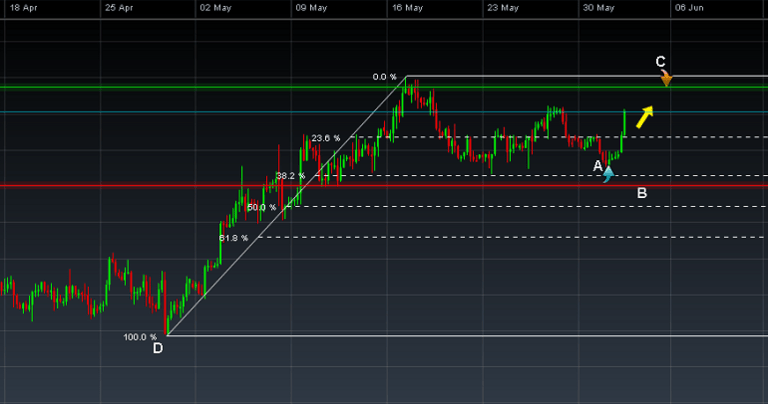
How to swing trade stocks: 5 effective strategies

8 minute read
|7 Jan 2026
GettyImages-2177264047
Table of contents
  • 1.
    Key Takeaways
  • 2.
    What is swing trading?
  • 3.
    Swing trading example: How it works
  • 4.
    Five swing trading strategies for stocks
  • 5.
    Finding stocks to swing trade

Learn swing trading basics and gain valuable insights into five of the most popular swing trading techniques and strategies. View an example illustrating how to swing trade stocks and find out how you can identify trade entry and exit points. 

Key Takeaways

Swing trading aims to profit from short-term price movements, typically holding positions for a few days to weeks. 

  • Five key strategies include Fibonacci retracements, support and resistance triggers, channel trading, SMA crossovers, and MACD crossovers. 

  • Use technical indicators and market tools to identify potential entry and exit points and manage trades confidently. 

What is swing trading?

Swing trading is a type of trading style that focuses on profiting from changing trends in price action over relatively short timeframes. Swing traders will try to capture upswings and downswings in stock prices.  

Typical holding period:  

Positions are typically held for one to six days, although some may last as long as a few weeks if the trade remains profitable.  

How traders identify opportunities:

Traders who swing trade stocks find trading opportunities using a variety of technical indicators to identify patterns, trend direction and potential short-term changes in trend. Learn more with our introduction to swing trading article. 

Swing trading example: How it works

fibonacci swing trade example chart medium

Diagram guide:

A – Trade entry point

B – Stop loss

C – Price forecast (exit level)

D – Fibonacci technical analysis

There are various strategies that traders may use when swing trading stocks. In this example, we've shown a swing trade based on trading signals produced using a Fibonacci retracement

The three most important points on the chart: 

  • Trade entry point (A)

  • Exit level (C)

  • Stop loss (B)

 Any swing trading system should include these three key elements.

 About stop loss and exit points:

 The stop loss level and exit point don't have to remain at a set price level as they will be triggered when a certain technical set-up occurs, and this will depend on the type of swing trading strategy you are using. 

Timeframe:

The estimated timeframe for this stock swing trade is approximately one week. It's important to be aware of the typical timeframe that swing trades unfold over so that you can effectively monitor your trades.

Five swing trading strategies for stocks

We've summarised five swing trade strategies below that you may use to identify trading opportunities and manage your trades from start to finish. Apply these swing trading techniques to the stocks you're most interested in to look for possible trade entry points. You may also use tools such as CMC Markets' pattern recognition scanner to help you identify stocks that are showing potential technical trading signals. 

Strategy 1: Fibonacci retracement

The Fibonacci retracement pattern can be used to help traders identify support and resistance levels, and therefore possible reversal levels on stock charts.

How it works:

Stocks often tend to retrace a certain percentage within a trend before reversing again, and plotting horizontal lines at the classic Fibonacci ratios of 23.6%, 38.2% and 61.8% on a stock chart can reveal potential reversal levels.

Traders often look at the 50% level as well, even though it does not fit the Fibonacci pattern, because stocks tend to reverse after retracing half of the previous move.

Example trade:

Some stock swing traders could enter a short-term sell position if price in a downtrend retraces to and bounces off the 61.8% retracement level (acting as a resistance level), with the aim to exit the sell position for a profit when price drops down to and bounces off the 23.6% Fibonacci line (acting as a support level).

Strategy 2: Support and resistance triggers

Support and resistance lines are fundamental concepts in technical analysis and are often used by traders when developing swing trading strategies.

Support levels:

A support level refers to a price area on a chart below the current market price where buying interest has previously been strong enough to slow or reverse a decline. When price approaches this level, it may indicate potential buying activity, although outcomes can vary depending on broader market conditions.

Traders who use technical analysis may monitor price movements around support levels to identify potential trading opportunities, while also applying risk management techniques such as setting stop-loss orders.

Resistance levels:

Resistance represents a price area above the current market price where selling activity has previously been strong enough to slow or reverse an upward move. When price nears this level, it may signal potential selling interest, though this is not guaranteed.

Some traders may interpret a bounce from a resistance level as a possible indication of weakening momentum, but any decisions should be supported by additional analysis and appropriate risk management.

A key thing to remember when it comes to incorporating support and resistance into your swing trading system is that when price breaches a support or resistance level, they switch roles – what was once a support becomes a resistance, and vice versa.

Strategy 3: Channel trading

Channel trading involves identifying a stock that appears to be trending within a defined range, or channel, on a price chart. This method is commonly used in technical analysis to observe how prices move between areas of potential support and resistance.

Example setup:

If a trader plots a channel around a bearish trend on a stock chart, they may observe that price tends to move lower after reaching the upper boundary of the channel. This behaviour can be interpreted as a potential continuation of the existing trend, although it is not a guaranteed outcome.

Important note:

When analysing channels, traders often focus on aligning their observations with the prevailing trend. For example, in a downtrend, they may look for indications that the trend could continue lower, unless the price breaks out of the channel in the opposite direction, which could suggest a possible change in trend.

As with all trading approaches, outcomes depend on market conditions, and no strategy ensures success.

Strategy 4: 10- and 20-day SMA

Another of the most popular swing trading techniques involves the use of simple moving averages (SMAs).

What SMAs do:

SMAs smooth out price data by calculating a constantly updating average price which can be taken over a range of specific time periods, or lengths. For example, a 10-day SMA adds up the daily closing prices for the last 10 days and divides by 10 to calculate a new average each day. Each average is connected to the next to create a smooth line which helps to cut out the 'noise' on a stock chart.

The length used (10 in this case) can be applied to any chart interval, from one minute to weekly. SMAs with short lengths react more quickly to price changes than those with longer timeframes.

How to use this system:

With the 10- and 20-day SMA swing trading system, you apply two SMAs of these lengths to your stock chart.

  • When the shorter SMA (10) crosses above the longer SMA (20) a potential buy signal is generated as this indicates that an uptrend is underway.

  • When the shorter SMA crosses below the longer-term SMA, a potential sell signal is generated as this type of SMA crossover indicates a downtrend.

Moving Average Convergence and Divergence - MACD charts - TradingView

Strategy 5: MACD crossover

The MACD crossover swing trading system provides a method to identify opportunities to swing trade stocks. It's one of the most popular swing trading indicators used to determine trend direction and reversals.

How it works:

The MACD consists of two moving averages - the MACD line and signal line – and in theory the buy and sell signals are generated when these two lines cross.

  • If the MACD line crosses above the signal line, it may indicate that bullish momentum is strengthening, which some traders interpret as a potential buy signal.

  • If the MACD line crosses below the signal line, it may suggest that bearish momentum is building, which some traders view as a potential sell signal.

Some stock swing traders would then wait for the two lines to cross again, creating a signal for a trade in the opposite direction, before they exit the trade. However, as with any indicator, false signals can occur, and it’s important to confirm trends using additional analysis and risk management tools.

Additional signals:

The MACD oscillates around a zero line, and trade signals are also generated when the MACD crosses above the zero line (buy signal) or below it (sell signal).

Finding stocks to swing trade

When swing trading stocks, careful market selection can play an important role in the effectiveness of a trading approach. The following considerations may help traders assess potential markets more effectively.

  • Make use of chart patterns. Use our pattern recognition scanner that can help you identify reversal patterns like a double top or triple top chart pattern. Visit our article on stock chart patterns to discover the most important chart patterns and their meanings.

  • Monitor the economic calendar. Keep an eye on the economic calendar, which can help you determine the health of a nation’s economy, and potential trading opportunities or risks in the future.

  • Factor in earnings calendars. Earning calendars will help you factor in sudden price movements to your swing trading strategies.

  • Be careful when trading penny stocks. Penny stocks are highly speculative investments, so take care when trading them. Although the volatility of the penny stock markets presents high-growth trading opportunities, it also presents larger risks.

Summary

These strategies can be applied to your trading to help you identify potential trading opportunities in the markets you're interested in. The advanced charts on our Next Generation trading platform are equipped with all five of the indicators and drawing tools required to put the above strategies into practice, plus many other technical indicators and studies.

Swing trading
Frequently asked questions

What is swing trading?

Swing trading is a type of trading style that focuses on profiting off changing trends in price action over relatively short timeframes (i.e. one to six days). Swing traders will try to capture upswings and downswings in stock prices.

Does swing trading work?

Swing trading is a trading style that aims to take advantage of short-term changes in price trends over relatively brief timeframes. Traders using this approach typically hold positions for several days to a few weeks, depending on market movement and individual strategy.

While swing trading can be effective for some traders in certain market conditions, it also carries significant risk. Success depends on factors such as timing, market volatility, and effective risk management. Past performance is not a reliable indicator of future results, and outcomes will vary from trader to trader.

How do I start swing trading?

Traders who swing trade stocks find trading opportunities using a variety of technical indicators to identify patterns, trend direction and potential short-term changes in trend.

Learn more with our introduction to swing trading article.

What is the best swing trading strategy?

There are many swing trading strategies available, such as:

  • Fibonacci retracement

  • Support and resistance triggers

  • Channel trading

  • MACD crossover

  • And more

Join an award winning CFD provider
Practise CFD trading with $10,000 of virtual funds on a risk-free demo account.
Access 12,000+ instruments on our award-winning CMC Markets Platform. Including indices, forex and shares.
Enhance your CFD trading on MetaTrader4 with CMC Markets and access 175+ forex pairs.
Tight spreads and low margin rates.
Support
Support
x

Welcome to CMC Markets Support!

To begin, please select the product your query is related to.