How to read crypto charts

14 minute read
|23 Feb 2026
A solid blue surface adorned with a multitude of dots in different colors and sizes, in a wave-like movement
Table of contents
  • 1.
    Key takeaways
  • 2.
    What are the common crypto chart types? 
  • 3.
    The basics: How to read candlestick charts 
  • 4.
    Crypto chart elements and technical indicators
  • 5.
    Key crypto chart patterns and what they mean 
  • 6.
    How to easily recognise crypto chart patterns
  • 7.
    What else do you need to know before trading? 
  • 8.
    Complete chart analysis with CMC Markets 

Crypto markets can be highly volatile, with large intraday price swings often influenced by macroeconomic developments, exchange flows, protocol updates and shifts in market sentiment. Such volatility may present both opportunities and risks for traders. Being able to interpret price action through chart analysis, rather than relying on guesswork, can help traders make more informed decisions in these conditions. 

Charts can’t tell you what will happen. Instead, they help you organise information – price, time, volume, etc. – so you can make smarter decisions. For crypto CFD trading, this matters even more because CFDs let you go long or short, and you’re usually trading on margin, which raises the stakes for both gains and losses. 

We’ve put together this guide for both beginners and intermediate traders who want to form a few technical foundations. You’ll learn the most common types of charts, the building blocks of candlesticks, indicators to watch for, plus the most useful crypto chart patterns.  If you want to apply what you’re learning, you can explore crypto CFDs and observe how charts behave on live instruments. 

Key takeaways

  • Knowing how to read crypto charts starts with choosing the right chart – line charts for quick trend checks, candlesticks for proper decision-making. 

  • Candlestick charts are widely used because they show open, high, low and close (OHLC) and reveal buying/selling behaviours. 

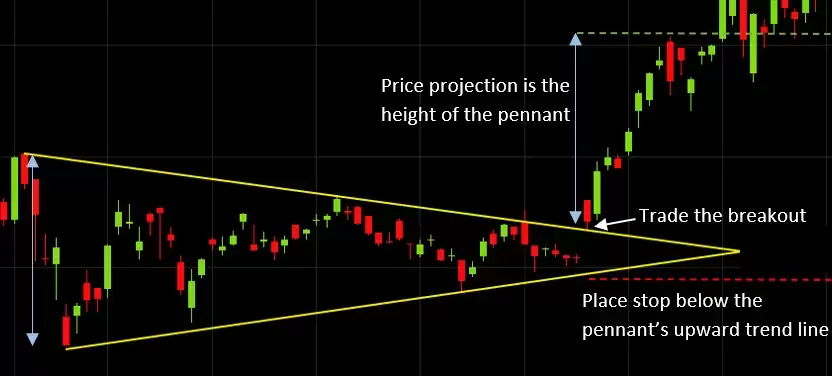
  • Patterns are about structure and probabilities, not predictions. Keep your eye on clear levels and trends, as well as obvious consolidation zones. 

  • Solid risk management is more important than spotting a particular pattern. Lock in your exit before you enter and respect position sizing. 

  • Our platform tools can help speed up your analysis, especially when you’re just starting out. 

What are the common crypto chart types? 

Crypto charts come in a few different formats. You’ll see the following chart types most often: 

  • Line chart: One line showing price over time (usually the close). 

  • Candlestick chart: Shows open, high, low and close for each period. 

  • Bar chart: Similar to candlesticks but less visually intuitive for most beginners. 

  • Heikin Ashi: Shows price action to help highlight trends. 

  • Area chart: A line chart with shading, which can be useful for a bit of visual context. 

For beginners, line and candlestick charts are often the most useful starting point. Line charts can help with general orientation and identifying broad trends, while candlestick charts provide more detailed price information that can support deeper analysis. 

What is a line chart?

A line chart plots a single price point per time period – usually the closing price – then connects those points with a line. It’s great for quick trend direction (up, down, sideways), spotting major turning points, as well as cutting out ‘noise’ when you’re overwhelmed by intraday swings. 

The trade-off is that you lose the finer details. A line chart won’t show the ‘battle’ inside each candle (i.e. where price opened, how far it moved, where it closed, etc.). 

What is a candlestick chart? 

A candlestick chart is a technical analysis tool used by traders to visualise asset price movements over time. 

It will show you four prices for each time period: 

  1. Open (where price started). 

  1. High (the highest price reached). 

  1. Low (lowest price reached). 

  1. Close (where price finished). 

The ‘body’ shows the open-to-close range, while the ‘wicks’ show the high and low. Candlesticks are great for visualising the momentum, rejection, indecision and shifts in control between buyers and sellers. 

Which one should you use? 

Candlestick charts are the ideal tool for reading crypto charts because they show you both direction and behaviour. With crypto – where price can spike, reverse and consolidate incredibly quickly – candlesticks give you the context you need so you’re not trading off of incomplete information. 

Want to dive down even further? Learn more about candlestick charts.

The basics: How to read candlestick charts 

Anatomy of a candlestick 

  • Body: Range between open and close. 

  • Wick (upper/lower shadow): High and low extremes. 

  • Bullish candle: Close above open (i.e. buyers had more control). 

  • Bearish candle: Close below open (i.e. sellers had more control). 

Also, get to grips with the following three reading rules: 

  1. Big body = stronger conviction. 

  1. Long wick = rejection at that level. 

  1. Small body = indecision, particularly after a strong move. 

Candlesticks that every beginner should know 

  • Hammer: Small body, long lower wick – shows a rejection of lower prices after a decline. 

  • Shooting star: Small body, long upper wick – shows a rejection of higher prices after a rise. 

  • Doji: Open and close near the same level – signals indecision but needs context. 

  • Engulfing (bullish/bearish): A larger candle ‘engulfs’ the previous body, which can be a sign of a shift in control. 

  • Morning/evening star: Three-candle reversal structures. 

  • Three white soldiers/three black crows: Consecutive strong candles which suggest sustained momentum. 

Candlesticks can work best when combined with the levels and context of the trend. A hammer at a random point is just a candle. A hammer at a well-tested support level after a downtrend is a clue. 

If you want examples and further explanations, you can learn more about candlestick charts and compare your charts on major markets like the Bitcoin USD chart or Ethereum USD

Crypto chart elements and technical indicators

Before indicators, it’s important that you master the various parts of a chart: 

  • Price axis: The vertical scale (i.e. what price is). 

  • Time axis: The horizontal scale (i.e. when the price moved). 

  • Timeframe: Each candle represents a period (i.e. 1m, 5m, 1h, 1D). 

  • OHLC: Open, high, low, close (i.e. the candlestick data). 

  • Volume: How much traded in that period (i.e. shown as bars below). 

  • Spread: Difference between buy and sell price. 

  • Support/resistance: Levels where price repeatedly reacts. 

It’s also a good idea to wrap your head around these basic definitions for technical indicators: 

  • MACD: Compares two moving averages to help identify changes in momentum and potential shifts in trend behaviour. 

  • Bollinger Bands: A useful volatility tool showing a moving average with upper/lower bands. Very helpful to catch expansion/contraction phases. 

In addition to the above, you can also learn about advanced charting tools to get ahead of the game. 

Symmetrical triangle

Key crypto chart patterns and what they mean 

Patterns are repeating shapes created by the price structure. They don’t cause moves, but rather show you how traders behave around levels. Treat patterns as probabilities and manage your risk appetite accordingly. 

Bullish vs bearish patterns

A bullish pattern suggests that the price is more likely to rise, whereas a bearish pattern does the opposite, suggesting it’s more likely to fall. But the most frequent beginner mistake is treating patterns as ‘automatic signals’. A better approach is to ask: 

  • Is the broader trend up or down? 

  • Is the pattern forming at a meaningful level of support or resistance? 

  • Is volatility expanding or contracting? 

  • Is volume confirming the move? 

In crypto, many patterns fail during sudden volatility, which is why confirmation matters. A breakout candle close, a retest or a clear momentum shift, for example, can cut down on false signals. Your overarching goal shouldn’t be to avoid losses completely (because you can’t). Instead, you want to steer clear of entering low-quality setups that don’t justify the risk. Learn more about bullish and bearish patterns

Head and shoulders in crypto charts 

Head and shoulders is a reversal pattern that can be a sign that something is turning from bullish to bearish. It forms after an uptrend in a few different ways: 

  • Left shoulder: Price rises, then pulls back. 

  • Head: Price makes a higher high then pulls back. 

  • Right shoulder: Price makes a lower high and then pulls back. 

  • Neckline: Support line that connects the pullback lows. 

A classic trigger is a break below the neckline, preferably with increased momentum. Many traders then look for a retest of the neckline from below before entering. 

In crypto, head and shoulders can appear after strong rallies when momentum is starting to fade. Watch out for weakening RSI or MACD divergence as extra confirmation. Most importantly, understand your invalidation. In other words, if price reclaims the neckline and holds, then the bearish thesis might no longer apply. 

Head and shoulders

Inverted head and shoulders in crypto charts

The inverted head and shoulders is the bullish counterpart, signalling a potential reversal from bearish to bullish. It usually forms after a downtrend:

  • Left shoulder: Price drops then bounces.

  • Head: Deeper drop then bounce.

  • Right shoulder: Higher low then bounce.

  • Neckline: Resistance line across the bounce highs.

One confirmation is a breakout above the neckline, followed by a retest that holds. With crypto, such a pattern can show up after capitulation selling, where the market exhausts sellers and begins to stabilise.

Bear in mind that the best inverted head and shoulders patterns tend to have improving momentum and an obvious shift in swing structure. Keep your stops logical – beneath the right shoulder or beneath the neckline – rather than placing them at arbitrary distances.

Triangles (ascending, descending symmetrical) in crypto charts

Triangles are consolidation patterns where price compresses into a tighter range.  This can sometimes precede a breakout:

  • Ascending triangle: Flat resistance and rising support (bullish).

  • Descending triangle: Flat support and falling resistance (bearish).

  • Symmetrical triangle: Both sides converge.

Triangles are popular in crypto because the market frequently cycles between volatility expansion and contraction.

Looking for a beginner-friendly confirmation? Wait for a candle close outside the triangle and retest the broken trendline. False breakouts aren’t uncommon in crypto, so a retest can filter out low-quality moves. Use volume as a supporting clue; breakouts come with stronger participation.

Wedges in crypto charts

Wedges are similar to triangles but usually tilt upwards or downwards, which can signal a reversal or continuation depending on the context.

  • Rising wedge: Higher highs and higher lows, but the range narrows. A signal of weakening momentum and a potential bearish break.

  • Falling wedge: Lower highs and lower lows, narrowing range. A signal of selling pressure fading and a potential bullish break.

Wedges can appear in crypto during trend ‘pauses’ or during late-stage moves. A rising wedge inside a strong uptrend can still break upwards, so don’t assume the direction. Wait for the break and seek out confirmation.

Wedges work best when you combine them with trend and momentum tools. A rising wedge with RSI divergence, for instance, can strengthen the bearish case. Risk management is all-important, so define where the pattern is invalidated and size your position as such.

Wedge

Flags in crypto charts 

Flags are continuation patterns that appear after a strong move (the ‘flagpole’), followed by a short consolidation (the ‘flag’).  They are often interpreted as a pause before a trend either resumes or fails. 

  • A bullish flag: Sharp move up, small downward/sideways channel, breakout higher. 

  • A bearish flag: Sharp move down, small upward/sideways channel, breakdown lower. 

Flags are common in crypto because momentum runs can be strong and fast, and the market tends to consolidate before another leg. Remember that the flag should be smaller than the pole, and the consolidation should look orderly rather than chaotic. 

For beginners, flags can be one of the simplest patterns to trade because the invalidation is obvious. If the flag breaks in the opposite direction and holds, the continuation thesis weakens. Watch for momentum returning on the breakout.

Flag

Pennants in crypto charts 

Pennants are similar to flags, but the consolidation is shaped like a small symmetrical triangle rather than a channel. They also form after a sharp move and are a sign of continuation. 

Pennants show a rapid compression of price action as buyers and sellers reach a short-term steadiness. The breakout direction, in most cases, matches the prior move, but crypto is synonymous with false breaks, so confirmation matters yet again. 

Here’s a beginner-friendly way to approach pennants: 

  1. Identify the impulse move (pole). 

  1. Check that the pennant is small and tight. 

  1. Wait for a breakout close. 

  1. Retest the breakout level. 

  1. Risk is often assessed relative to the opposite side of the pennant structure.  

Pennants tend to form and resolve more clearly during active market conditions, when liquidity and volatility are higher. In quieter periods, price action may become less directional, and breakouts can be less reliable.

Pennant

How to easily recognise crypto chart patterns

Pattern recognition is a skill you can only learn through repetition. We’ve put together these tips to help you spot patterns faster: 

  • Zoom out first: Check the 4H and daily charts to see the broader structure before you trade the 5m chart. 

  • Mark obvious levels: Patterns work best near clear support or resistance. If you can’t explain the level in one sentence, it’s probably weak. 

  • Look for compression: Triangles, wedges and pennants all compress volatility before a break. 

  • Use charts first: Add indicators later. Start with price and levels, then confirm with RSI/MACD. 

  • Try to avoid pattern overload: Focus on two or three patterns (e.g. triangles, flags, head and shoulders) until you can spot them reliably. 

  • Check the timeframe: A bullish pattern on 5m that fights a strong bearish daily trend is lower probability. 

  • Use instrument examples: Practise on highly followed charts like Bitcoin USD and Ethereum USD where the structure is often clearer. 

If you have a background in equities, it can help to compare how crypto charts differ from stock market behaviour.

What else do you need to know before trading? 

Charts show possibilities, not guarantees. Before you trade crypto CFDs, keep these realities top-of-mind: 

1. Risk management comes first 

  • Decide your maximum loss per trade and per day before you dive in. 

  • Use stop-loss orders with logic rather than emotion. 

  • Keep position sizes smaller than you think. Crypto volatility can surprise you. 

2. Costs and execution 

Spreads, slippage and overnight holding costs can impact results, especially in fast-paced strategies. If you hold positions past the session cut-off, financing might apply. Strategies with small targets need cleaner execution to stay profitable. 

3. Indicators can conflict 

RSI could signal ‘overbought’ while a trend keeps running. MACD could lag during fast moves. Use indicators to confirm structure. 

If you want a more solid foundation on how the product works, we explain what crypto CFDs are here. And if you’re seeking broader exposure rather than single coins, you can also see how cryptocurrency index trading might work for you. 

Complete chart analysis with CMC Markets 

Once you understand the basics of how to read crypto charts and you’re comfortable reading crypto charts on your own, platform tools can help you move quickly and be more consistent. 

The CMC Markets platform supports: 

  • Pattern recognition screener, which can help surface potential chart patterns across markets and timeframes. This is useful when you’re learning and want to study more examples. 

  • Trading tools to filter markets, manage watchlists, set alerts and more, so you aren’t relying on constant screen time. 

  • You can explore crypto CFDs and review available markets to apply your chart-reading knowledge to familiar instruments. 

If you’re serious about improving, make sure you learn one concept first, apply it on a chart, take screenshots and review the outcomes. Over time, you’ll be able to better recognise patterns and then place stops more logically. The endgame? Trading with less guesswork. 

Disclaimer: This article provides general information only. Past performance is not a reliable indicator of future results. It has been prepared without taking account of your objectives, financial situation or needs. It is not to be construed as a solicitation or an offer to buy or sell any financial instruments, or as a recommendation and/or investment advice. It does not intend to support an investment decision and it should not be relied upon by you in evaluating the merits of investing in any financial instruments.  You should consider your objectives, financial situation and needs before acting on the information in this document. CMC Markets believes that the information in this article is correct, and any opinions and conclusions are reasonably held or made on information available at the time of its compilation, but no representation or warranty is made as to the accuracy, reliability or completeness of any statements made in this document. CMC Markets is under no obligation to, and does not, update or keep current the information contained in this document. Neither CMC Markets nor any of its affiliates or subsidiaries accepts liability for loss or damage arising out of the use of all or any part of this document. Any opinions or conclusions set forth in this article are subject to change without notice and may differ or be contrary to the opinions or conclusions expressed by any other members of CMC Markets. Investing in CMC Markets derivative products carries significant risks and is not suitable for all investors.  You do not own, or have any interest in, the underlying assets. We recommend that you seek independent advice and ensure you fully understand the risks involved before trading. Spreads may widen dependent on liquidity and market volatility. It's important for you to consider the relevant Product Disclosure Statement ('PDS') or Information  Memorandum (for CMC Pro accounts) and any other relevant CMC Markets documents before you decide whether or not to acquire any of the financial products. Please visit our site to view the PDS, Information Memorandum, our Target Market Determination for CFD products and our Financial Services Guide (FSG) containing information about our services, including our fees and charges. CMC Markets Asia Pacific Pty Ltd ABN 11 100 058 213 AFSL No. 238054    

Join an award winning CFD provider
Practise CFD trading with $10,000 of virtual funds on a risk-free demo account.
Access 12,000+ instruments on our award-winning CMC Markets Platform. Including indices, forex and shares.
Enhance your CFD trading on MetaTrader4 with CMC Markets and access 175+ forex pairs.
Tight spreads and low margin rates.
Support
Support
x

Welcome to CMC Markets Support!

To begin, please select the product your query is related to.