Trading on risers and fallers of the market
Within the financial markets, the price of an instrument can rise or fall at any point throughout the day, as there are often large changes in price action. Some short-term traders prefer to speculate on recent price action rather than looking at overall fundamentals in order to potentially capture a profit between small price movements. With this in mind, our Next Generation trading platform offers built-in categories in the product library for ‘Biggest Risers’ and ‘Biggest Fallers’, which show the biggest market movers of the day. Read on to discover how to access this tool and how to apply it to your trading strategy.
See inside our platform
Get tight spreads, no hidden fees and access to 12,000 instruments.
Start trading
Includes free demo account

What are risers and fallers?
Risers and fallers describe financial instruments that have seen the largest increases or decreases in price within one given trading day. The risers and fallers category tends to refer to the stock market. For example, many traders choose to monitor FTSE risers and fallers or similar securities on the London Stock Exchange in order to find potential trades.
Our watchlists for Biggest Risers and Fallers are updated in real time and contain the top four products in each asset class with the largest daily percentage price rise or fall. This is not the same as volatility, as the assets are usually in a consistent uptrend or downtrend, rather than fluctuating back and forth between the two.
If you’re looking to trade more volatile instruments, you could instead monitor our ‘Price Movers’ watchlist, which can be found within the same section of the Product Library. This watchlist instead monitors products that have had unusual moves up or down, which are more than two standard deviations outside of their average daily price move. Read more about trading on volatility.
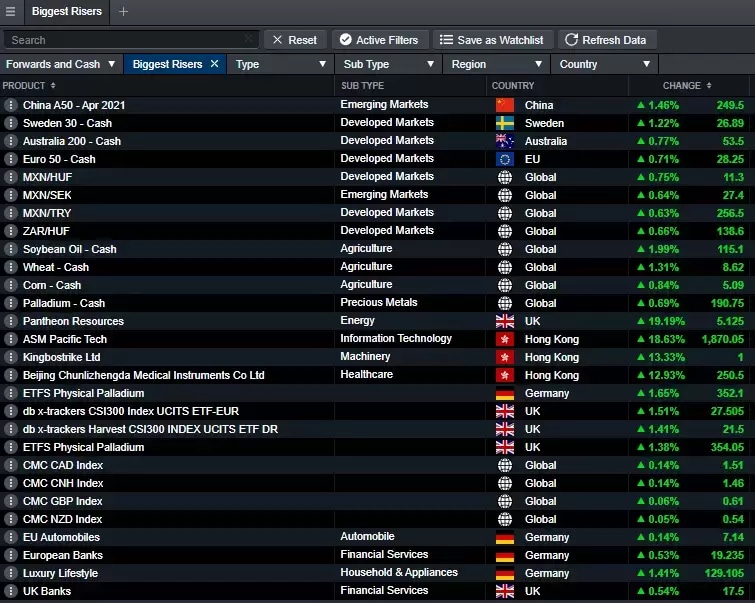
Biggest risers
Instruments that have seen a large upsurge in price are known as the risers of the market. These securities may have experienced a sudden uptrend, which may or may not continue. As you can see in the image below, the Biggest Risers watchlist measures the intraday change in both percentage and actual price figures. This is the difference between the lows and highs of the day.
Traders that are monitoring rising assets may potentially be looking to buy and hold a position for a longer period of time, as this suggests potential profits if the asset were to continue to rise steadily. However, the uptrend of an asset’s price could change at any time.
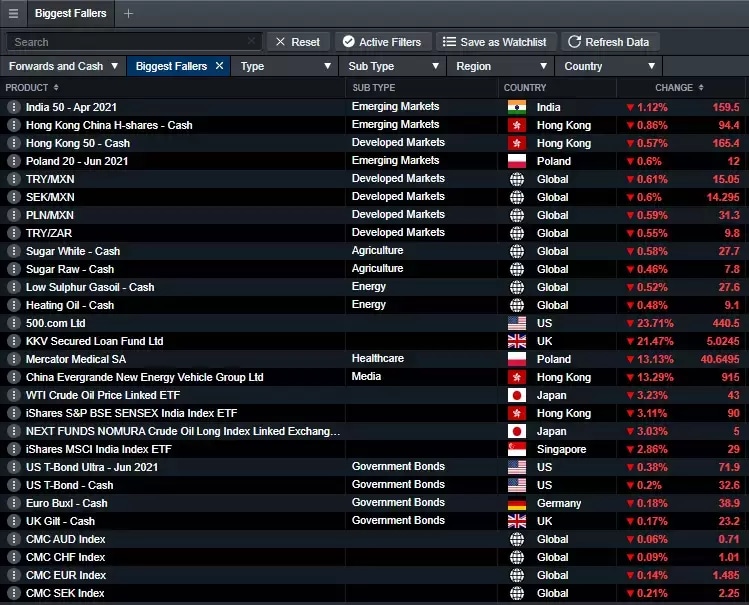
Biggest fallers
Instruments that have seen a large drop in price are known as the fallers of the market. These securities may have experienced a sudden downtrend, which may or may not continue. As you can see in the image below, four securities have broken out of their downtrend and have started to rise in price, causing the percentage change to turn green.
Traders that are monitoring falling assets may be looking to employ a shorter-term strategy and potentially short selling. This way, they can sell the stock at a higher price and then wait for the price to drop before placing a buy order again, locking in the profit from the price fall. This can be a risky strategy, so it’s worth learning more about shorting stocks in the UK if you are considering employing this strategy.
How to trade on risers and fallers
- Register for an account. You will be granted automatic access to a free demo account, where you can practise trading with virtual funds. When ready, deposit funds into your account to trade the live markets.
- Make use of our news and insight tools to decide which asset is right for you, such as our Reuters news feed, market calendar and Morningstar equity research reports.
- Decide if you want to buy or sell. This could depend on whether you are looking at Risers or Fallers, and what type of strategy you want to carry out.
- Be sure to follow risk-management guidelines. Stop-loss orders can help to minimise risk and close out trades when there are sudden or unanticipated price moves that are not in favour of your position’s direction.
- Be vigilant of your positions. Any move within the market can have an effect on your trades.
Share risers and fallers
As mentioned, investors are particularly keen to monitor stocks and shares with the highest price moves. This may be due to the fact that the stock market is affected by a wide range of external factors which can cause sudden climbs and falls in a company’s share price. Certain economic indicators that can cause share risers and fallers include the following:
- Interest rates and inflation (CPI, PPI)
- Changes to employment rates (ADP, non-farm payrolls)
- Economy activity and growth (GDP)
Likewise, changes to company fundamentals will have a parallel effect on the share market. This includes things like:
- Earnings reports – this can affect investor sentiment for a particular share and you often see volatile price moves after their release
- P/E ratios – whether they seem overvalued or reasonable
To filter share risers and fallers from the rest of the asset classes featured in our watchlists, simply click on the ‘Type’ tab at the top of the screen and select ‘Shares’. This will show you the top four risers and fallers of the stock market within your current trading day.

Powerful trading on the go
Seamlessly open and close trades, track your progress and set up alerts
Receive alerts for top risers and fallers
Our trading alerts feature allows you to be notified of price moves within the financial markets via email, SMS or push notifications on our mobile app. Aside from price alerts, you can also choose to receive execution alerts for trades that are due to go live, calendar alerts to stay up to date with economic events, and breaking news announcements that may have an effect on the assets that you are monitoring.
Open an account if you would like to sign up for trading alerts, which are available for both desktop and mobile devices.
FAQ
Where can I find the Risers and Fallers watchlists?
To find the Biggest Risers and Fallers on our Next Generation trading platform, navigate to the bar along the top of the homepage that reads ‘Products’. Then select ‘Library’. The two watchlists can be found in the topical section of our product library.
How can I see which stocks are rising today?
To see which stocks have risen the most in the current trading day, open the Biggest Risers watchlist from the product library. You can then filter by ‘Type’, where you can select ‘Shares’. This shows the top four assets within the share market with the largest daily percentage price rise.
Does this feature only monitor share risers and fallers?
No, our Biggest Risers and Fallers watchlists apply to all financial markets that we offer. This includes currencies, indices, treasuries, shares and commodities, as well as our exclusive share baskets. Browse our range of markets.
What strategy is best for falling assets?
In general, traders often open a long position and ‘buy’ when they expect an asset to rise, or open a short position and ‘sell’ when they expect an asset to fall. This is known as short selling. However, shorting can be risky and depends on your level of experience. Discover more trading strategies that you can use for rising and falling instruments.
What are FTSE risers and fallers?
FTSE risers and fallers refer to the shares that have seen the largest price moves, either up or down, that are constituents of the FTSE 100 stock index. These are usually blue-chip or large-cap stocks. Learn more about trading the FTSE 100.
See why serious traders choose CMC
Get tight spreads, no hidden fees, access to 12,000 instruments and more.
FCA regulated
Segregated funds
Learn more
Includes free demo account
