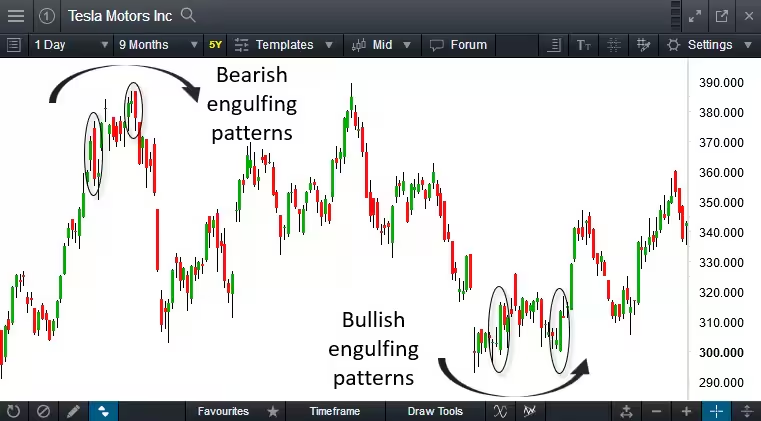
Candlestick patterns confirm market occurrences in conjunction with individual candles. Candlestick patterns are either continuation patterns or reversal patters. Examples of continuation patterns are three white soldiers or three black crows. These are patterns with three bull candles or three bear candles in a row. They indicate that a trend is likely to continue in a particular direction. Three white soldiers signify the continuation of an uptrend. Three black crows signify the continuation of a downtrend.
It is important for traders to be direction agnostic, as a trader has the potential to make a profit (or loss) irrespective of whether the market is rising or falling. Entering a position when the market is falling is known as going short. A trader would usually only initiate a short position when a market trend has reversed from an uptrend to a downtrend.
It is important for traders to be direction agnostic, as a trader has the potential to make a profit (or loss) irrespective of whether the market is rising or falling. Entering a position when the market is falling is known as going short. A trader would usually only initiate a short position when a market trend has reversed from an uptrend to a downtrend.
How to use candlestick charts
The never-ending tussle between buyers and sellers helps in constructing the candlestick line over time. Candlestick charts are often used to make investment and trading decisions, or in some cases, used for making adjustments to one’s trading decisions. These trading decisions could include opening a new trade, closing an existing one, or scaling out of a trade to capture partial profits.
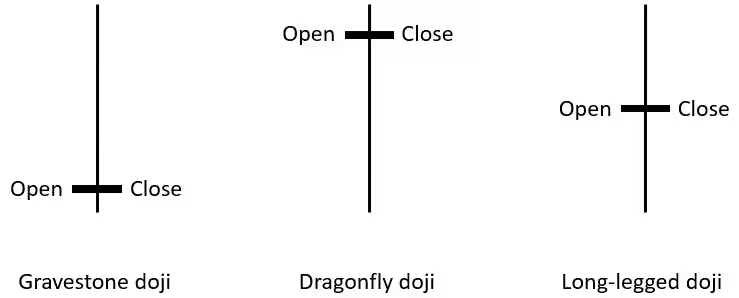
The size of a candlestick’s real body along with its wicks or tails can indicate a market’s volatility. Long wicks or tails in conjunction with a small real body signify a volatile market.
When a candle has long wicks with a relatively small real body the candles appear “spiky”. The long wicks or tails on these candles can signify a rejection of certain price levels. A candle with a small real body and with long wicks or tails on both sides denotes extreme volatility as well as market indecision. Such candles indicate the lack of market trend.
Forex candlestick patterns: an example
Forex candlesticks are especially useful in offering insight into the short-term price movements of the markets, making them a valuable tool for forex day trading strategies. In a typical Japanese candlestick chart, each candlestick represents the open, high, low and close prices of a given time period for a currency pair.
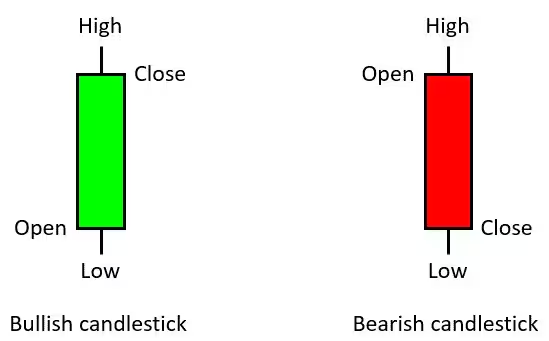
For instance, in a daily candlestick chart for EUR/USD, the wick or shadow at the top of the candlestick would show the highest level prices reached on that day, while the wick or shadow at the bottom of the candlestick would show the lowest level prices reached on that particular day.
The formation of a candlestick requires the open, high, low and close prices of a specific period. For example, a trader would need the daily, open, high, low and close price to generate a daily candlestick. This would be the same for either a weekly or monthly candlestick. For the candlestick to be successfully evaluated, you would need to wait for the closing price of a session.
Candlestick charts can be an important tool for the trader seeking an investment opportunity over a long timeframe. These investment trades would often be based on fundamental analysis to form the trade idea. The trader would then use the candlestick charts to signify the time to enter and exit these trades. For traders with a tighter timeframe, such as trading the fast-paced forex markets, timing is paramount in these decisions. Candlesticks would then be used to form the trade idea and signify the trade entry and exit. Technical analysis using candlestick charts then becomes a key part of the technical trader’s trading plan.