Professional traders talk a lot about Fibonacci numbers and what they reveal about when to buy or sell an investment. The levels, which mirror themselves all over the place in nature, are based on nothing more than simple math, and yet they have a habit of playing out in the market once in a while. In this guide, you’ll learn all about Fibonacci levels, and how you can factor them into your overall strategy.
- CFD Knowledge Hub
- Trading guides
- Can the Fibonacci sequence improve your trading strategy?
Can the Fibonacci sequence improve your trading strategy?

Table of contents
- 1.What is the Fibonacci sequence?
- 2.How are Fibonacci numbers used in trading?
- 3.Do Fibonacci levels in trading actually work?
What is the Fibonacci sequence?
An Italian mathematician named Leonardo Bonacci (a.k.a. Fibonacci) introduced the Fibonacci sequence to the Western world in his 1202 book, Liber Abaci.

Image: The Fibonacci spiral is a graphical representation of the Fibonacci sequence, a series of numbers where each number is the sum of the two preceding ones. (Wikipedia)
The sequence is a list of numbers that follows a simple pattern: you begin by adding zero and 1, and you get 1, and then add 1 and 1, and get two. And you continue, finding the next number by adding the two numbers before it, on and on, toward infinity. Here’s the beginning of the sequence:
0, 1, 1, 2, 3, 5, 8, 13, 21, 34, 55, et cetera…
Remarkably, we can see these numbers pop up all over nature: the number of petals in most flowers matches one of the above Fibonacci numbers, for example. And it’s the same pattern with branches growing on trees, which tend to grow in line with the sequence: one branch turns into two; then one of those branches splits into two again while the other hangs back.
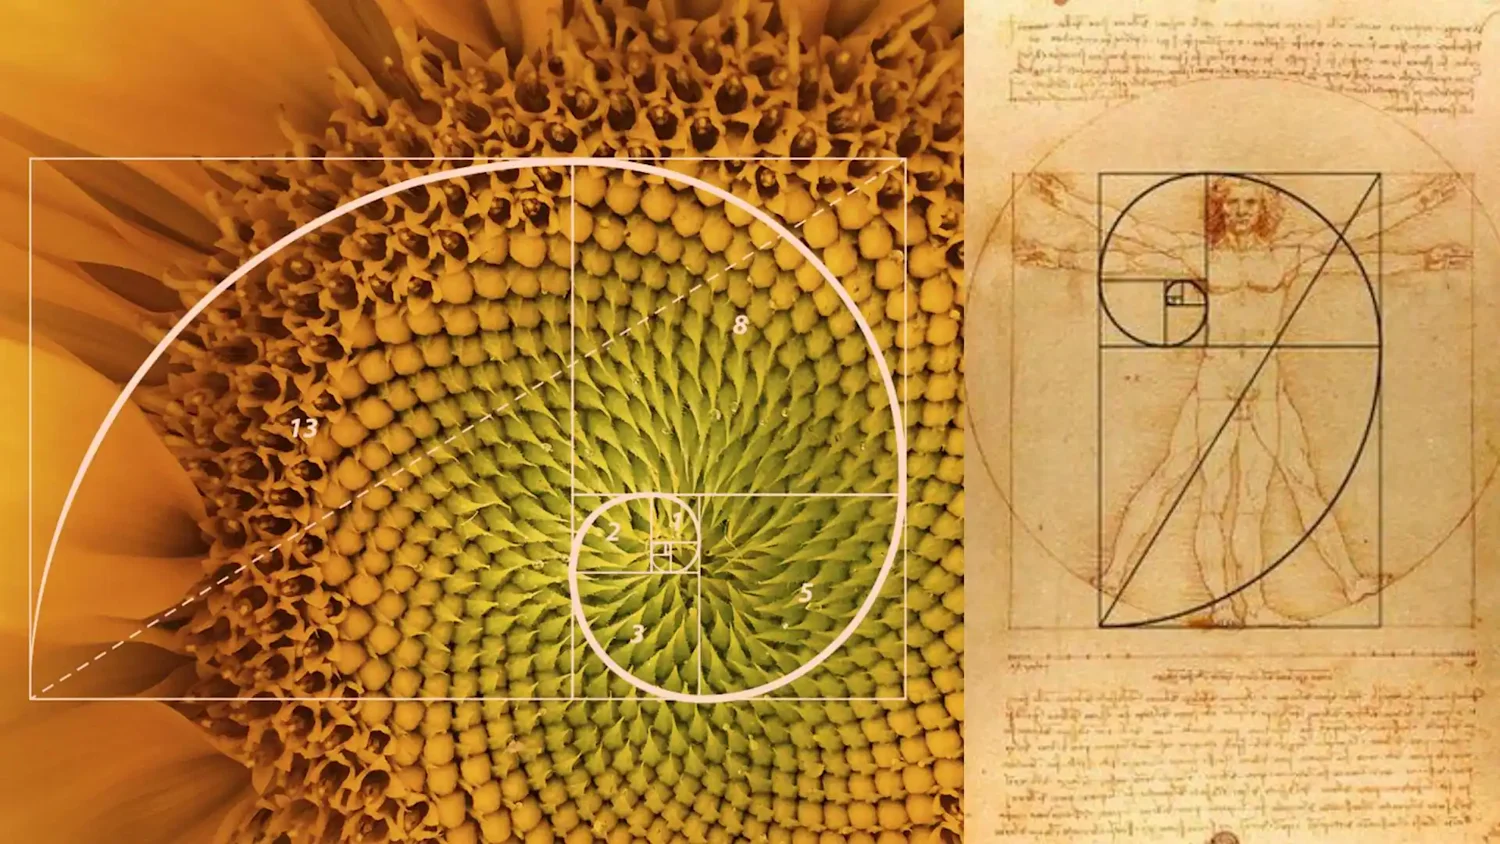
Image: The Fibonacci spiral in nature (NewsBytes)
Here's another interesting thing about the Fibonacci sequence: as the numbers get bigger, you can divide a number in the sequence by the number before it, and your answer will converge toward the same number – 1.618. This is what’s known as the “golden Fibonacci ratio” or what the Greeks call “phi”. On the flip side, if you divide each number by the number after it, those answers converge toward 0.618. And – wouldn't you know it – 0.618 is also the same number you get if you divide 1 by 1.618.
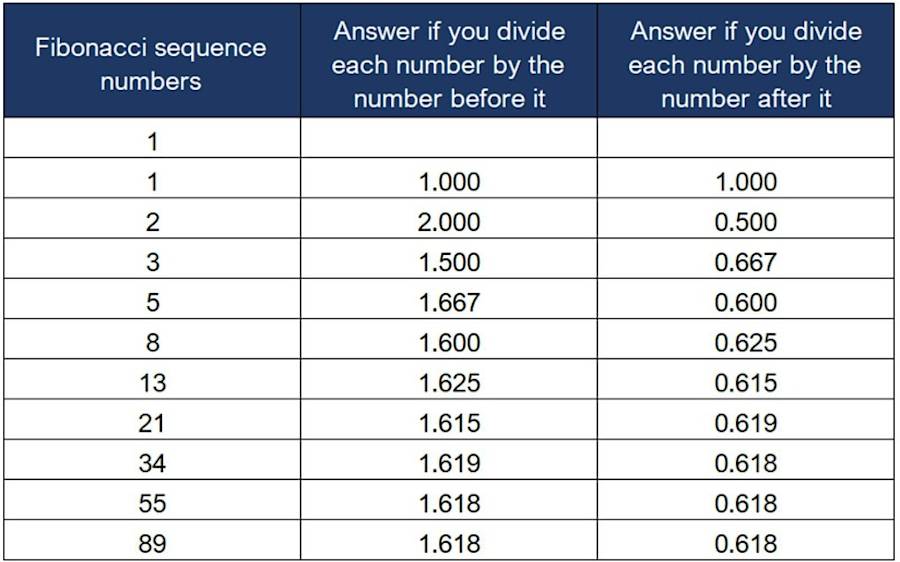
Using Fibonacci numbers to get the golden ratio.
How are Fibonacci numbers used in trading?
Besides the golden ratio, you can derive a range of Fibonacci levels (Fib levels) from the sequence. If you divide one number by the number two places after it, for example, you get 0.382. Three places after it, you get 0.236… et cetera.
Traders use these different Fib levels to tell them when to buy or sell an asset. And because so many of them are looking at these same levels, they tend to work out from time to time as good points to buy or sell. There are two types of Fibonacci tools traders use in their arsenal: Fibonacci retracements and Fibonacci extensions.
1. Fibonacci retracements
Fibonacci retracements are a percentage retracement (or pullback) against the overall trend in the price of an asset. If the price of a widget goes up £100 from its previous low and then starts to drop, for example, that fall would end $61.80 lower if the price stopped at the 0.618 Fib retracement level. In other words, the price would have pulled back 61.80% of its move up (a “bullish” retracement), at which point it would find its next low and resume its uptrend. It’s the same with a move down, except the move retraces back up (a “bearish” retracement) to a key Fib level before dropping back down.
There are five key Fib retracement levels that traders pay attention to: the 0.236, 0.382, 0.5, 0.618, and 0.786. You can use the Fibonacci retracement tool on TradingView to draw these on any price chart. But here’s an example using the price of gold when it began its bear market in 2011. Twice in a row it went down, then back up to the 0.618 Fib level before keeling over again.
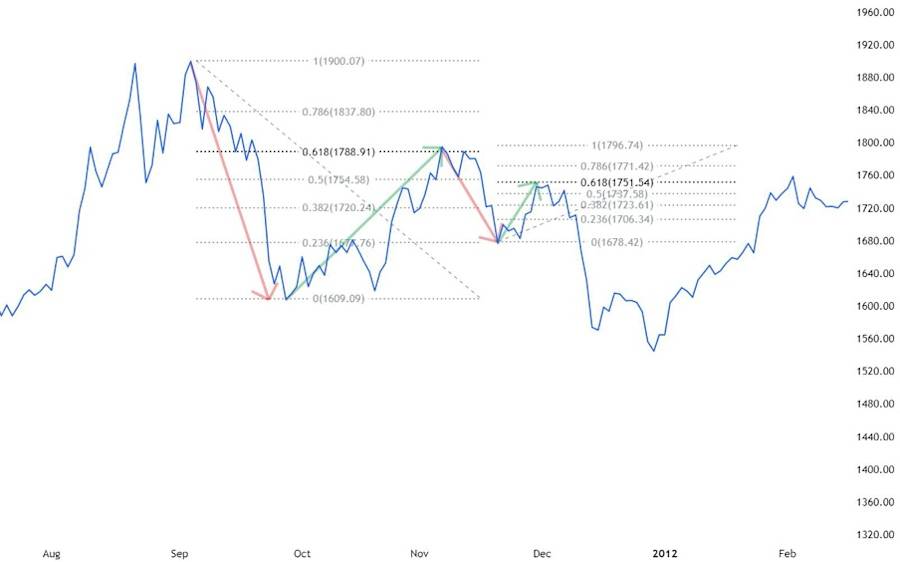
Bearish retracement of the gold price to the 0.618 Fibonacci level in 2011. Chart drawn with TradingView.
And here’s a bullish retracement of gold.
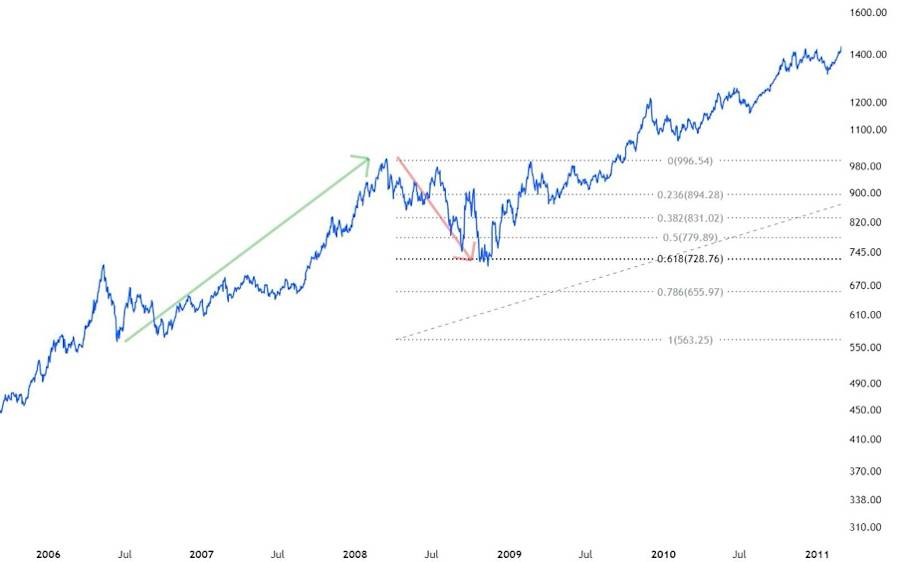
Bullish retracement of the gold price to the 0.618 Fibonacci level in 2008. Chart drawn with TradingView.
Let’s also look at a bearish retracement for Bitcoin in 2018 and 2019.
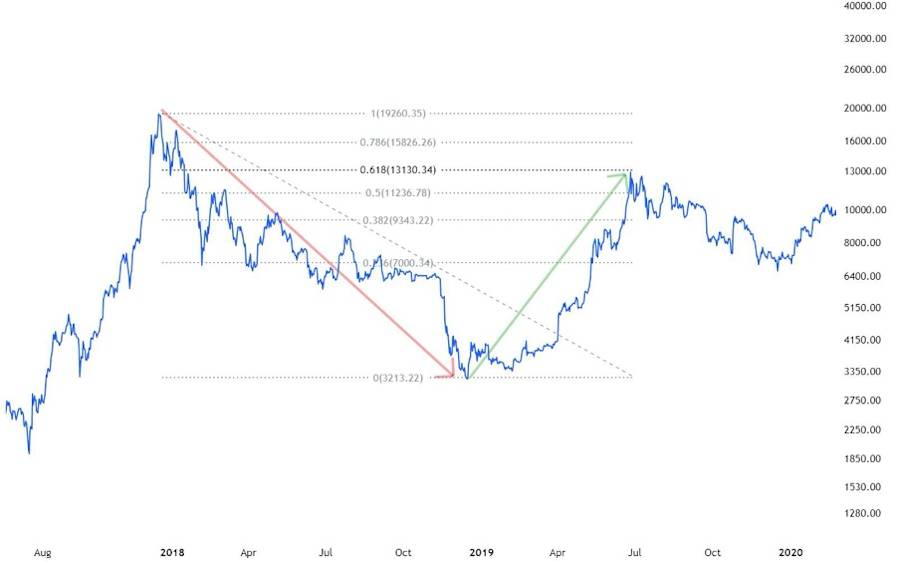
Price of bitcoin retracing to the 0.618 Fibonacci level in 2019. Chart drawn with TradingView.
And, finally, here’s a bearish retracement for the S&P 500, after its peak in December of 2021.
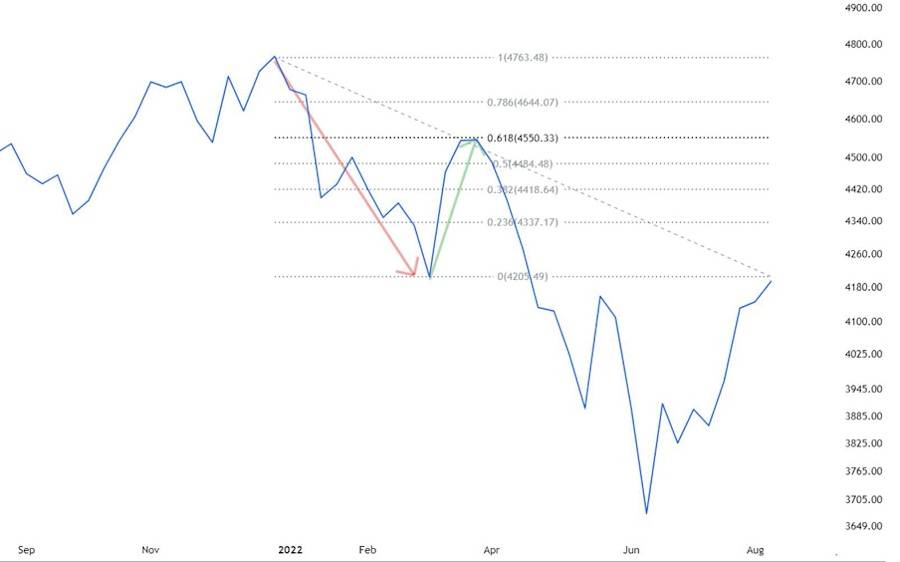
S&P 500 retracing to the 0.618 Fibonacci level in 2022. Chart drawn with TradingView.
2. Fibonacci extensions
Fibonacci retracements measure the pullbacks in the opposite direction of a trend, while Fibonacci extensions measure how far the price might move in the same direction of the trend after it retraces. For example, a 1.618 Fib extension would mean the next leg up in price would have been 161.8% bigger than the one before it. Traders often use Fibonacci extension targets as potential price levels where they’ll want to sell and take profits. Here’s an example of a 1.618 Fib extension on the S&P 500.
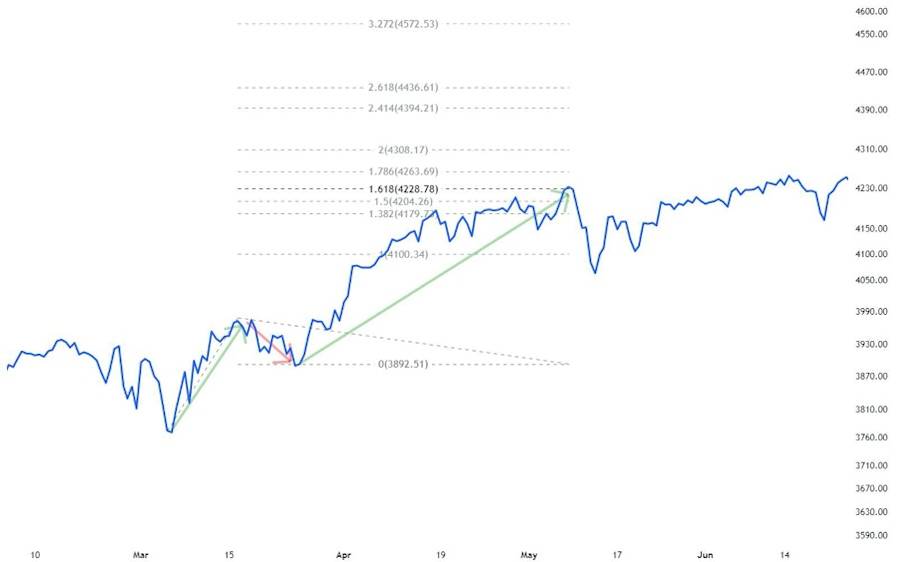
S&P 500 retracing to the 1.618 Fibonacci extension example. Chart drawn with TradingView.
Do Fibonacci levels in trading actually work?
Stock and other asset prices move because of all sorts of factors, so Fibonacci levels should never be the be-all and end-all of your strategy. That said, Fibonacci retracements and extensions can still be a useful tool because so many traders look at them and base decisions, at least in part, on them.
You can also use Fibonacci levels to monitor your trades as you go along – one level at a time – to see how the price reacts at each level. If it moves past the 0.382 Fib, for example, you might look to the 0.5 Fib as your next point of interest to potentially buy or sell, and so on. If you do decide to use Fibonacci levels in your strategy, it’s best to use them along with other types of analysis.
Looking to implement Fibonacci levels into your trading strategy? Charting software makes the process straightforward. Platforms like CMC Markets, MT4, and TradingView allow traders to plot Fibonacci lines with just a few clicks. For example, in an upward trend, select the Fibonacci tool, click on the low point, and drag the cursor to the high. Key levels such as 61.8%, 50.0%, and 38.2% will be automatically displayed on the chart.
In this article, you learned:
Fibonacci levels can help traders identify potential support and resistance zones in trending markets.
Market reactions to these levels may be influenced by how widely they’re followed by traders.
Fibonacci techniques are often used across asset classes to gauge possible price swings and reversals.
They’re best considered alongside other tools and shouldn’t necessarily be the core of your strategy.
Disclaimer: This article provides general information only. It has been prepared without taking account of your objectives, financial situation or needs. It is not to be construed as a solicitation or an offer to buy or sell any financial instruments, or as a recommendation and/or investment advice. It does not intend to support an investment decision and it should not be relied upon by you in evaluating the merits of investing in any financial instruments. You should consider your objectives, financial situation and needs before acting on the information in this article. CMC Markets believes that the information in this article is correct, and any opinions and conclusions are reasonably held or made on information available at the time of its compilation, but no representation or warranty is made as to the accuracy, reliability or completeness of any statements made in this article. CMC Markets is under no obligation to, and does not, update or keep current the information contained in this article. Neither CMC Markets nor any of its affiliates or subsidiaries accepts liability for loss or damage arising out of the use of all or any part of this article. Any opinions or conclusions set forth in this article are subject to change without notice and may differ or be contrary to the opinions or conclusions expressed by any other members of CMC Markets.
Join an award winning CFD providerPractise CFD trading with $10,000 of virtual funds on a risk-free demo account.Access 12,000+ instruments on our award-winning CMC Markets Platform. Including indices, forex and shares.Enhance your CFD trading on MetaTrader4 with CMC Markets and access 175+ forex pairs.Tight spreads and low margin rates.

