
Gold’s decline may have only started
Gold has been consolidating below key resistance levels, but several technical patterns suggest further downside may follow. Declining volatility could also indicate fading safe-haven demand and weakening momentum.
Founder, Mott Capital Management
Gold consolidates below key resistance
With oil capturing more recent attention, volatility in gold has significantly diminished, and it has been moving sideways, consolidating just below the $5,200 to $5,250 level. When examining gold on a more intraday basis, it seems likely to move lower towards the $4,950 area.
Bearish intraday patterns emerge
At least temporarily, on a one-hour chart, gold appears to be forming a rising wedge pattern. Looking further back, there could also be an argument that gold is forming a head and shoulders pattern on the intraday chart.
Therefore, there are two potentially bearish patterns in the shorter term that suggest gold could drift back towards the $4,960 region, and perhaps lower.
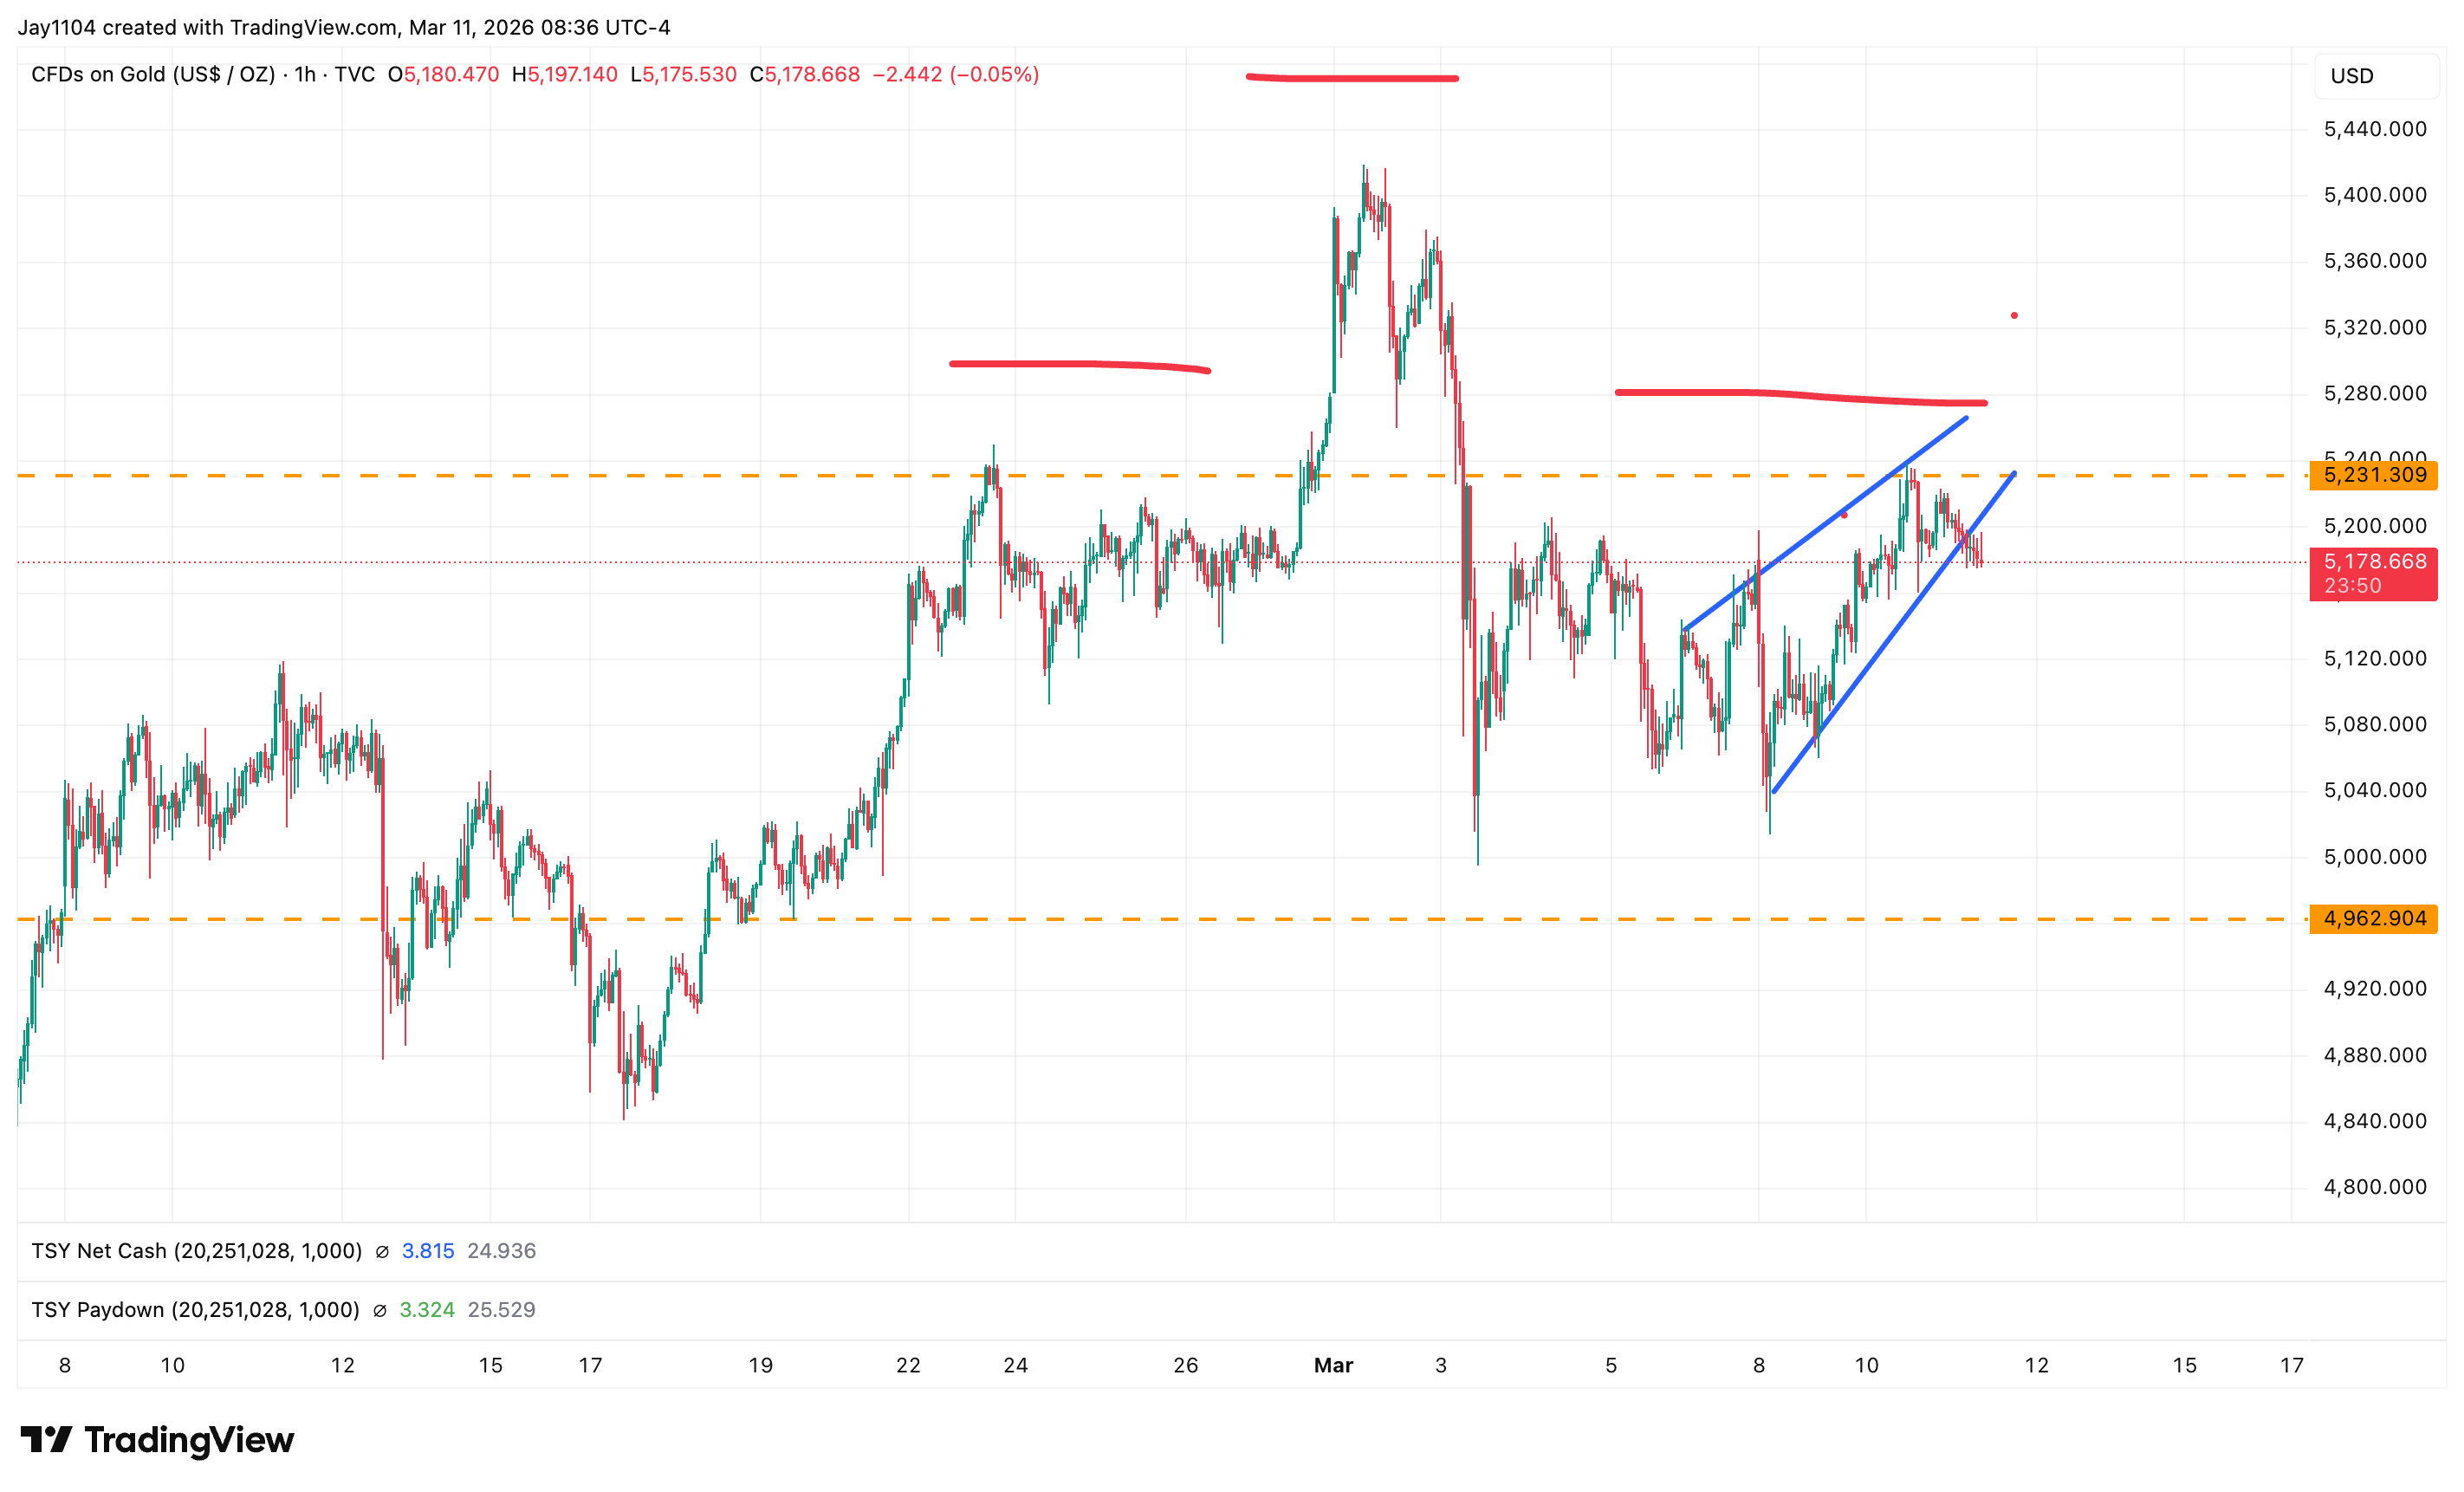
Source: TradingView, 11 March 2026
The daily chart shows a more bearish view; it appears that the precious metal has formed an inverse cup-and-handle pattern to the downside. This would suggest that gold may be heading lower from current levels, with $4,950 as a potential support level. However, gold may ultimately move even lower, potentially back towards $4,650.
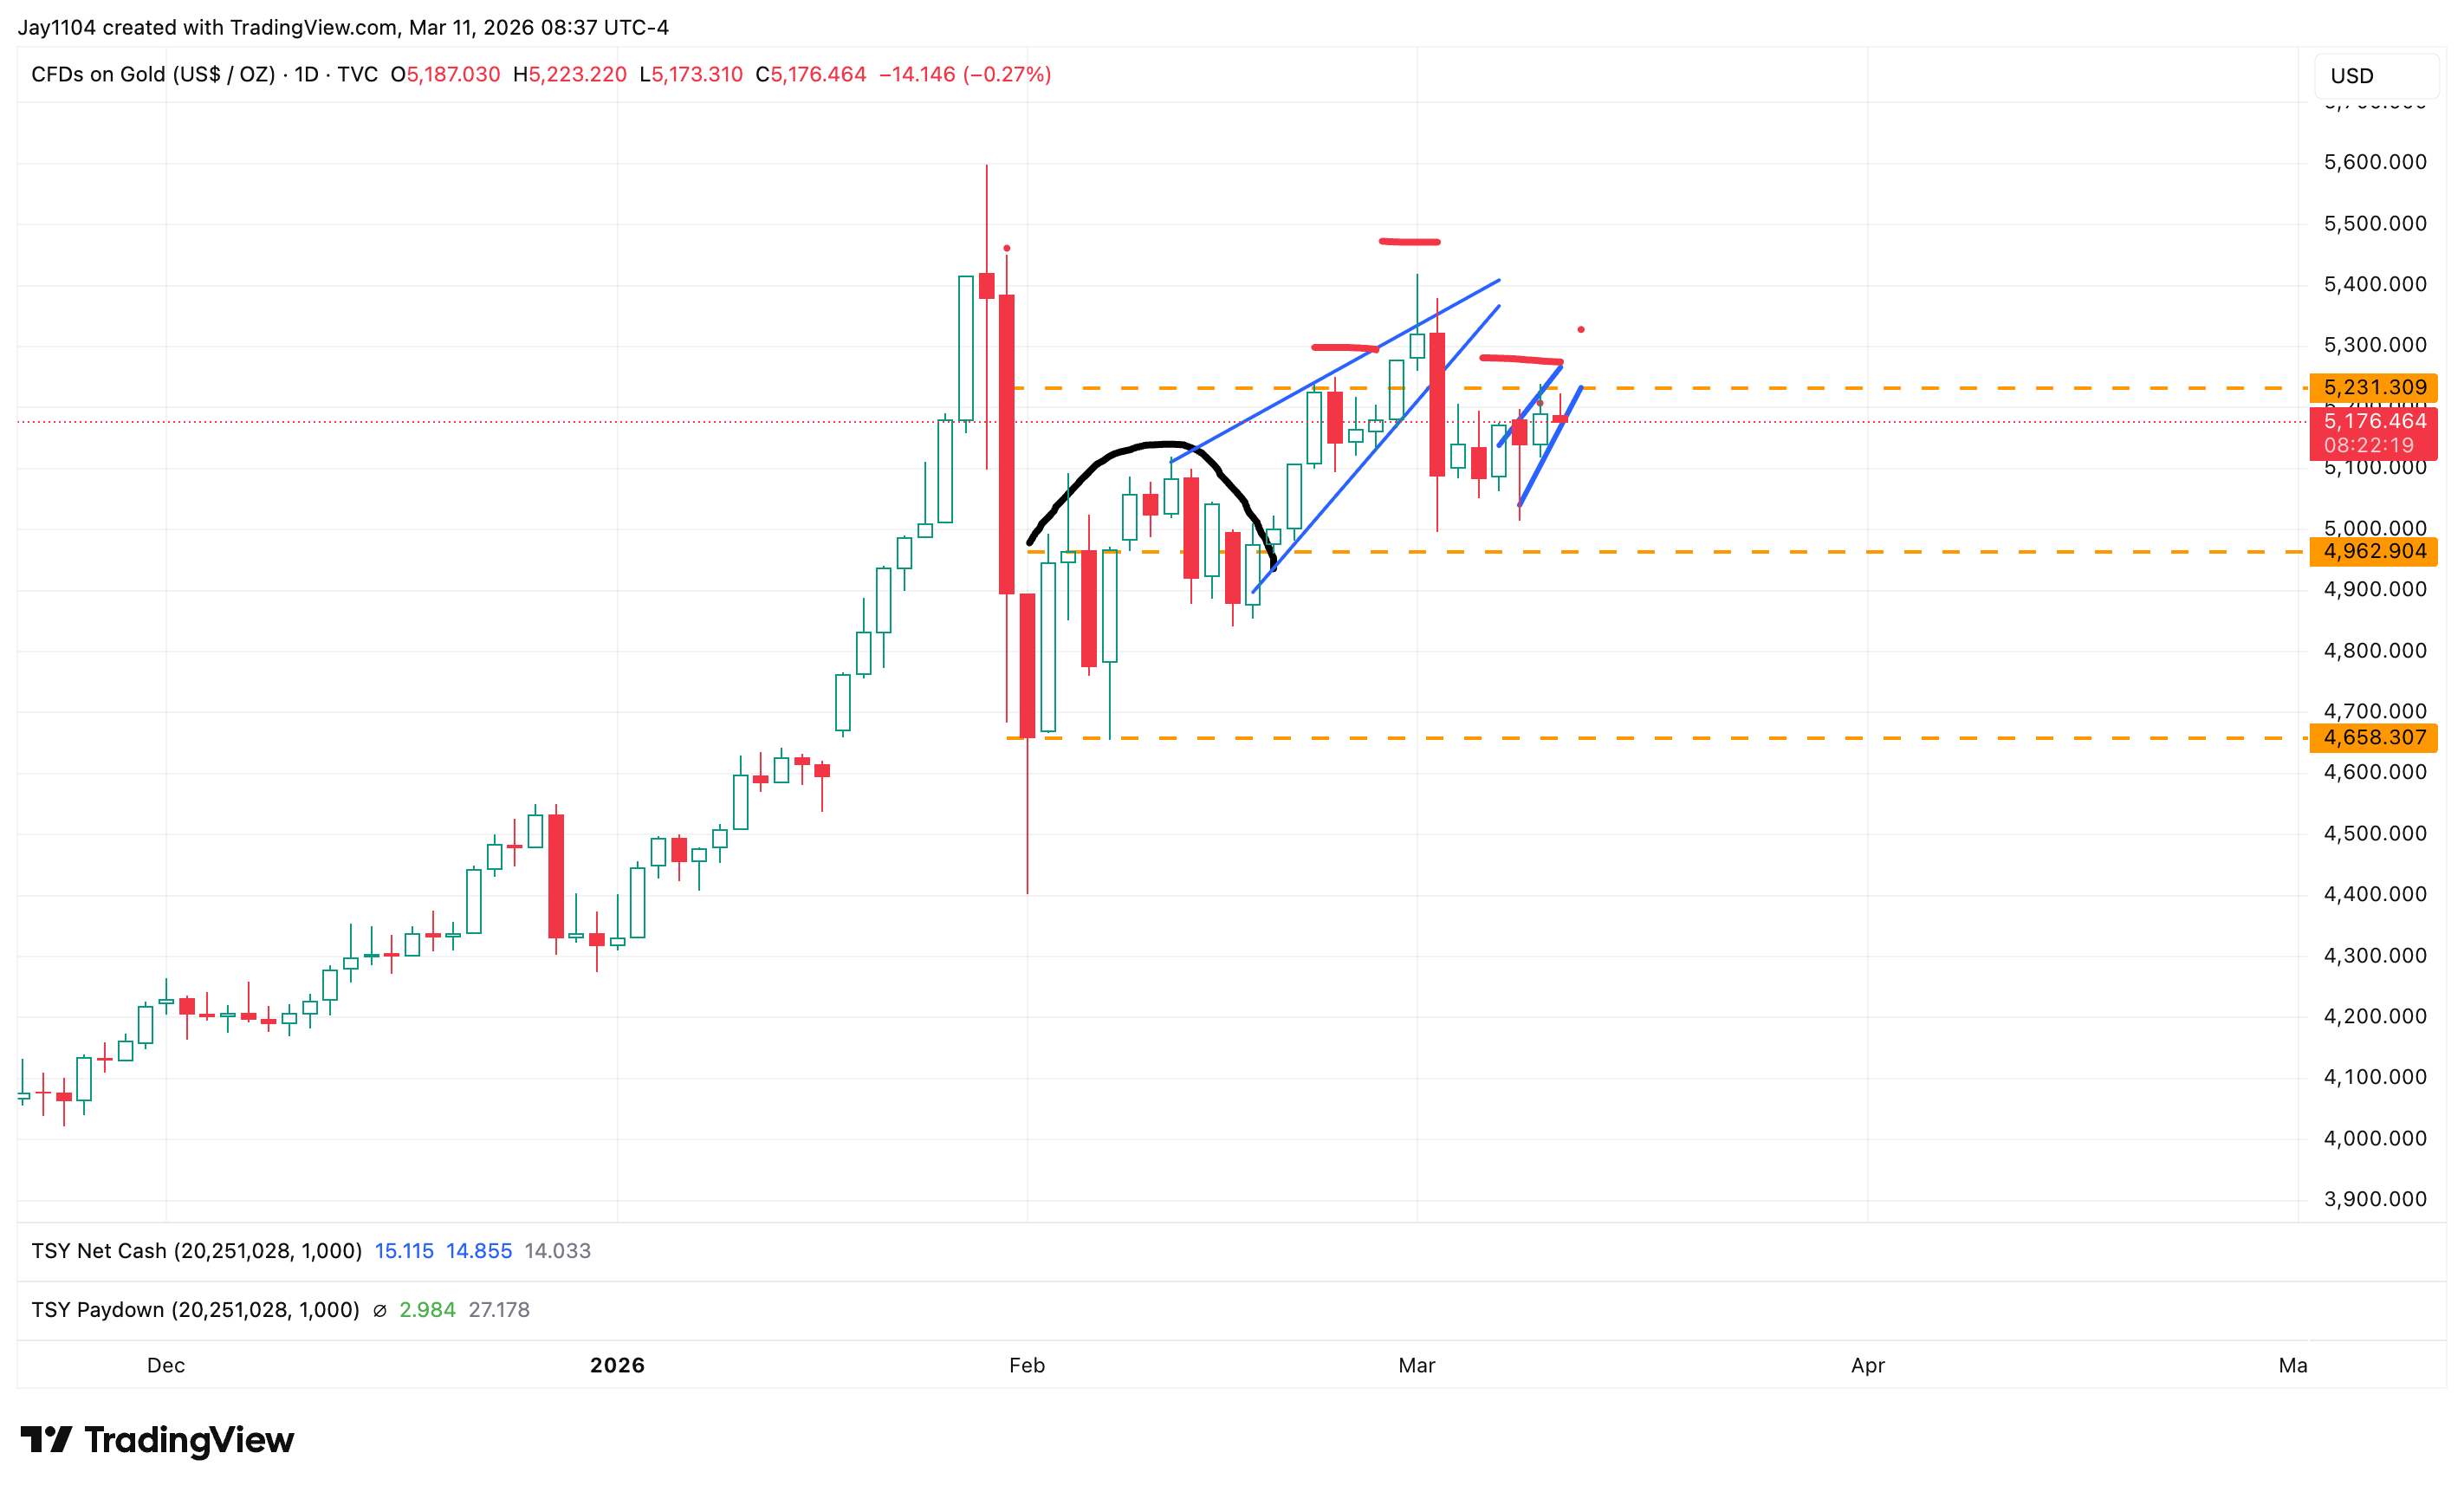
Source: TradingView, 11 March 2026
Falling volatility signals waning momentum
What may be more revealing about the waning interest in gold, at least from a trading perspective, is that the GVZ, the CBOE gold volatility index, has been declining. It is currently around 32, which is well below its January peak.
Falling implied volatility in gold is typically a significant signal because the metal often rises and falls alongside implied volatility, as it is frequently seen as both a fear gauge and a safe-haven asset. When implied volatility declines, it can indicate that gold is losing some of its previous momentum and advantage as a safe-haven investment. More broadly, it may suggest that some of the speculative positioning accumulated in gold is now beginning to unwind.
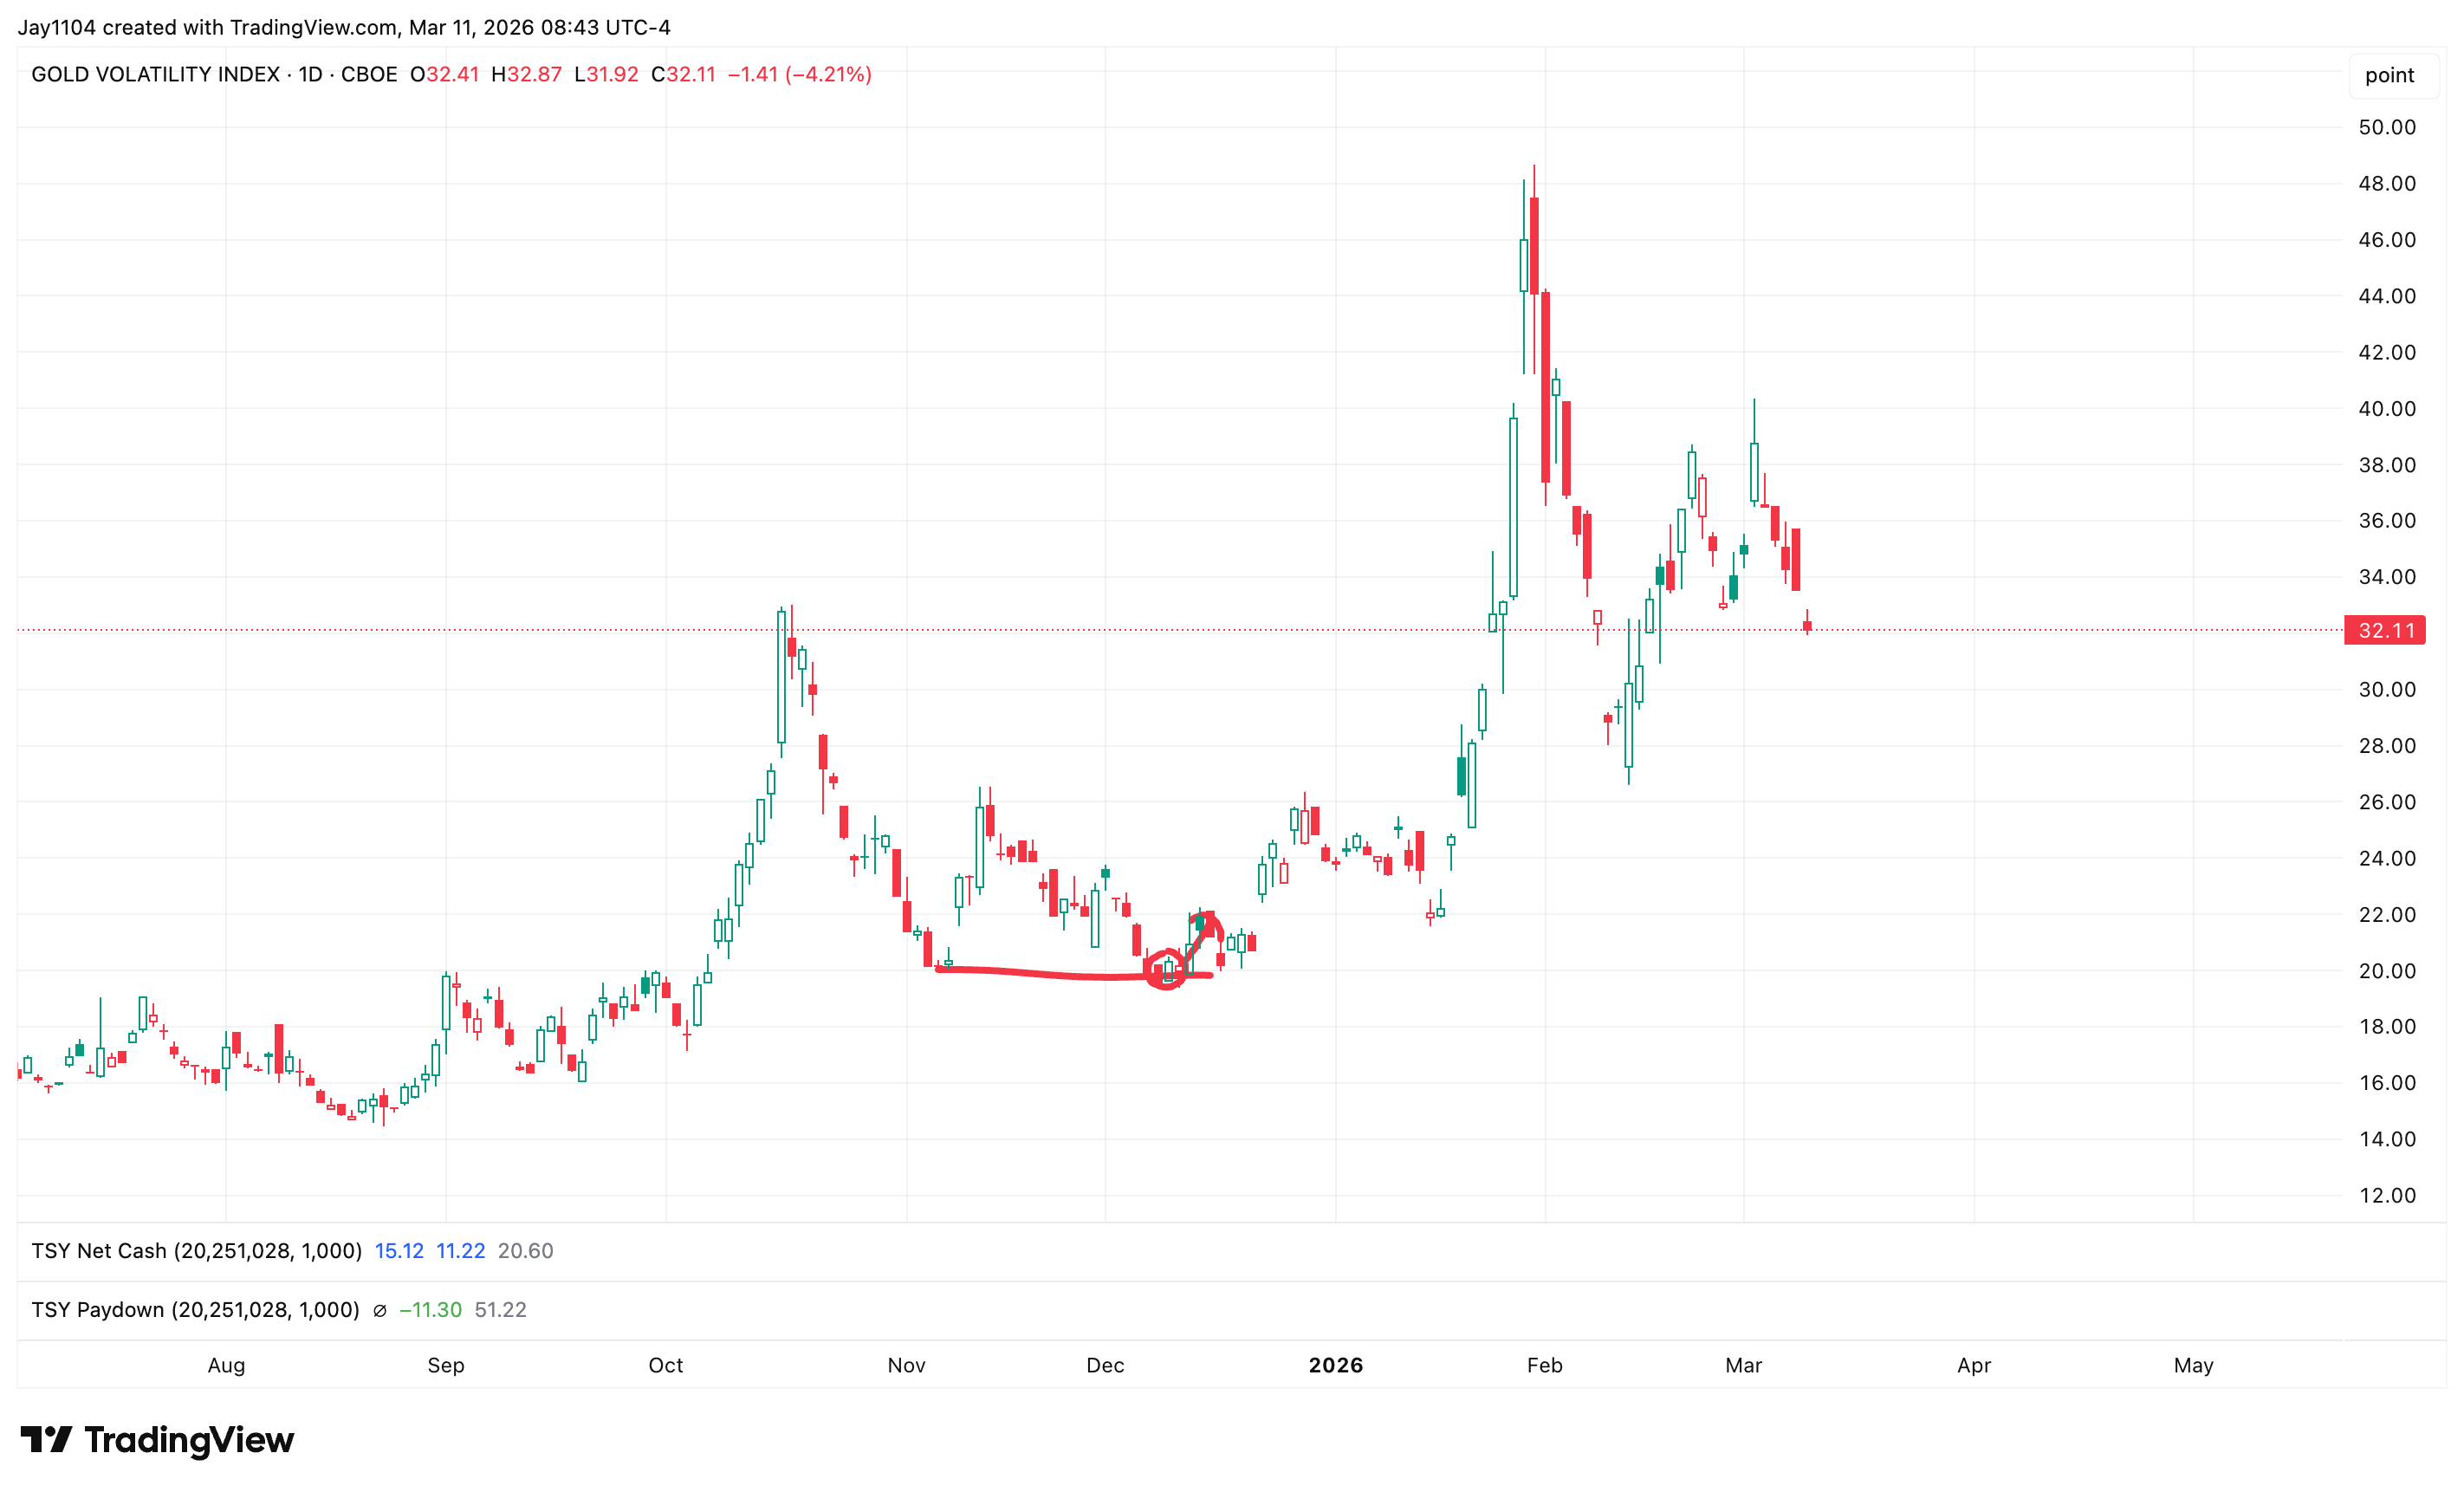
Source: TradingView, 11 March 2026

Gold struggles at $5,000 as momentum fades
Gold remains below $5,000 as momentum fades, increasing the risk of a near term pullback rather than a breakout higher.
War pushes inflation, deficit and rates higher: CPI and 10-year note auction in focus
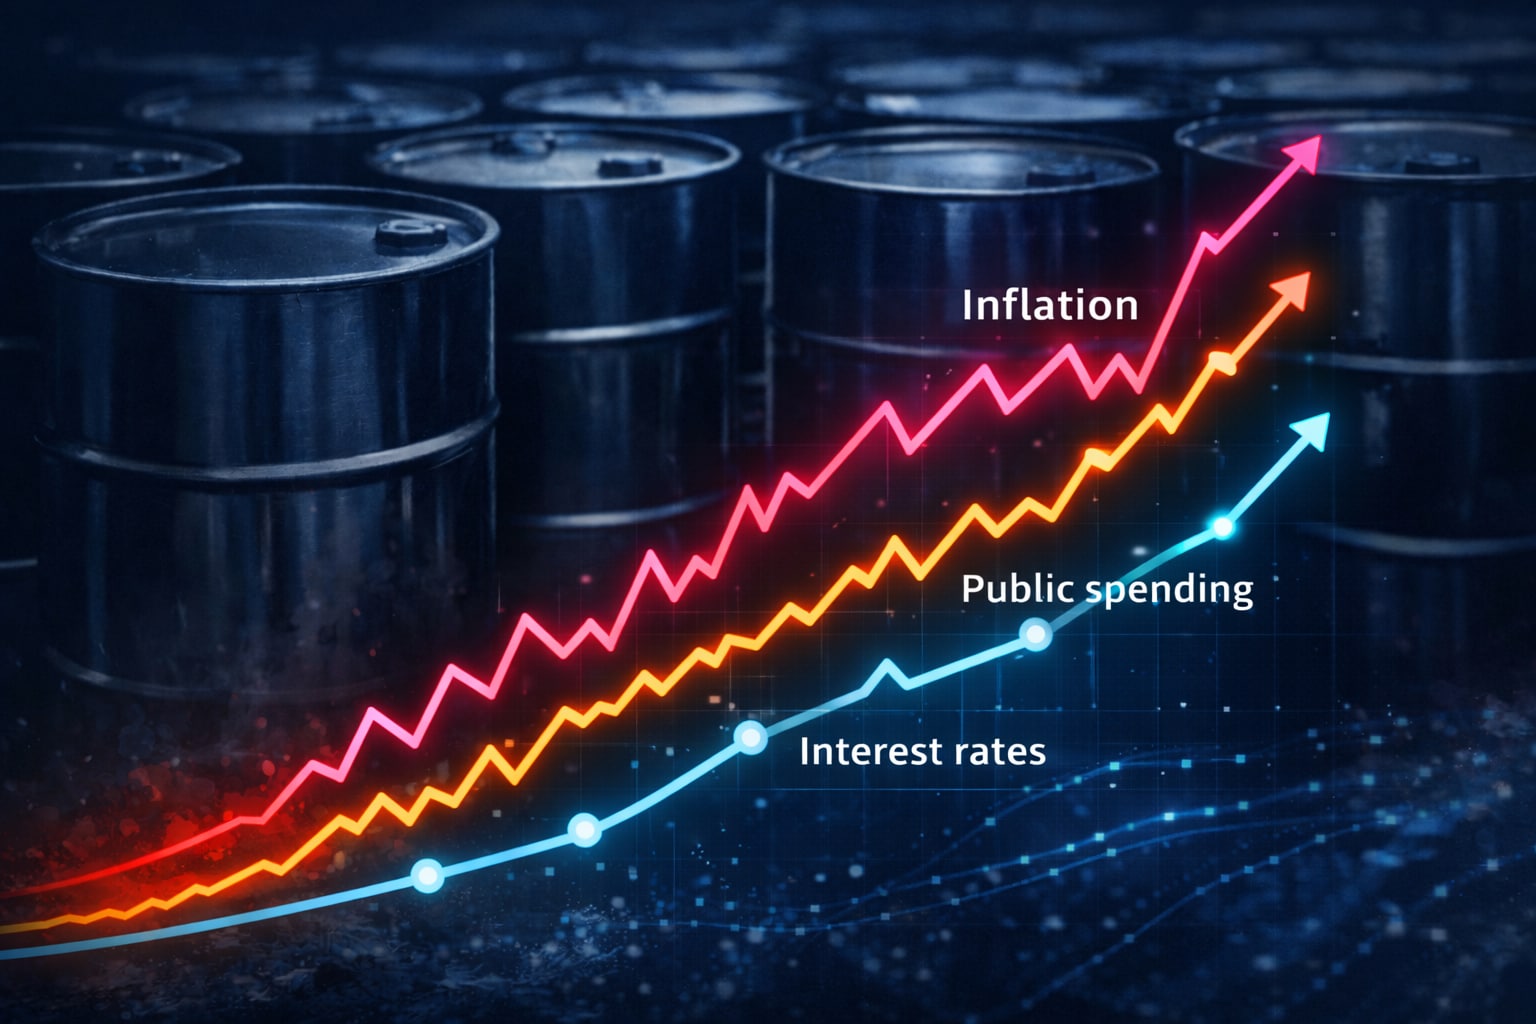
The war in Iran is affecting the interest rate curve and adding inflationary pressure through higher oil prices. Markets are now focused on the US Consumer Price Index (CPI) release, and the 10-year Treasury note auction as key indicators for interest rate expectations.

G7 weighs historic strategic oil reserve release
The G7 is considering an unprecedented release of strategic oil reserves as the risk of a prolonged Strait of Hormuz blockade intensifies. Markets are watching closely as volatility surges and key energy reports this week could shape expectations for prices and supply.