This article is brought to you by TradingView
- CFD Knowledge Hub
- TradingView
- Introduction to technical analysis
Introduction to technical analysis

Introduction to Technical Analysis
Technical analysis is a key component in trading. Every position taken, every order placed, and every decision made by a trader should be backed up by precise criteria derived from a specific analysis that aligns with their trading strategy. Navigating the markets without such analysis is as risky as setting sail without GPS — there’s a high chance of getting lost and losing valuable capital along the way. In this article, we’ll explore what technical analysis is, how to build it effectively, and how to leverage it to enhance your trading strategy. We’ll also draw a comparison with fundamental analysis to understand why so many traders overlook critical signals hiding in plain sight.
Technical analysis, as mentioned, is essential when developing a trading plan. It involves a predictive study of price chart to identify recurring patterns that can serve as the foundation of a trading strategy. In simple terms, traders analyze an asset's behaviour to predict its future trajectory and determine the appropriate trading position.
The first step is to select a suitable chart type. Japanese candlesticks are the most commonly used as they provide a detailed view of price action — each candle shows the opening, closing, high, and low price for a specific period. The selected timeframe depends on the trader’s style: scalpers typically use 1- to 5-minute charts, swing traders rely on 4-hour or daily charts, while long-term investors prefer weekly or monthly charts to seize broader trends.
Once the chart is in place, identifying the prevailing trend in the market — whether bullish, bearish, or ranging — is crucial. This allows traders to plot support and resistance levels, which are foundational to technical setups.
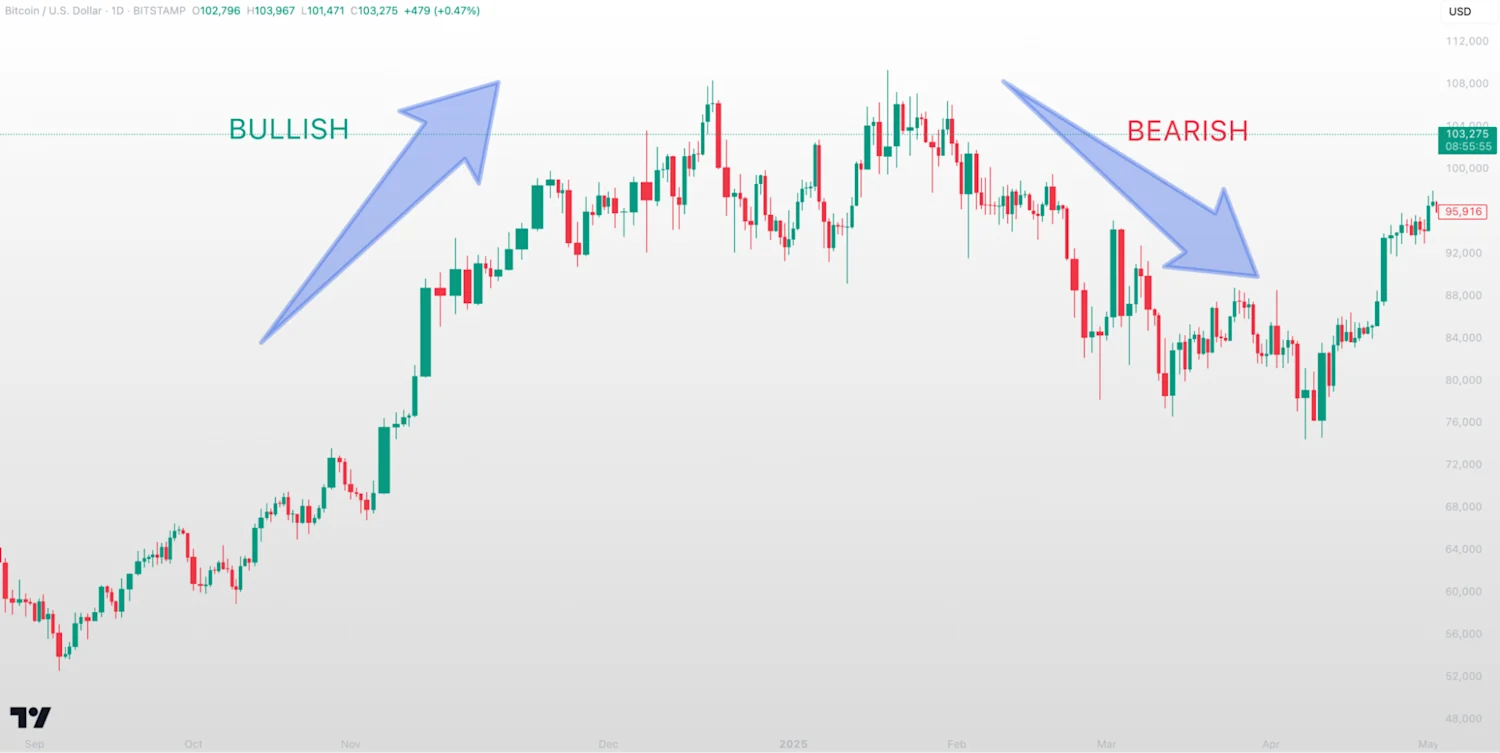
Source: TradingView. The chart illustrates both bullish and bearish market trends. Provided for illustrative purposes only.
A support level is a price zone where the market has historically rebounded, whereas a resistance level is where the price has repeatedly failed to rise. In addition to horizontal levels, drawing trend lines connecting successive highs and lows can help define price channels and enhance pattern recognition.
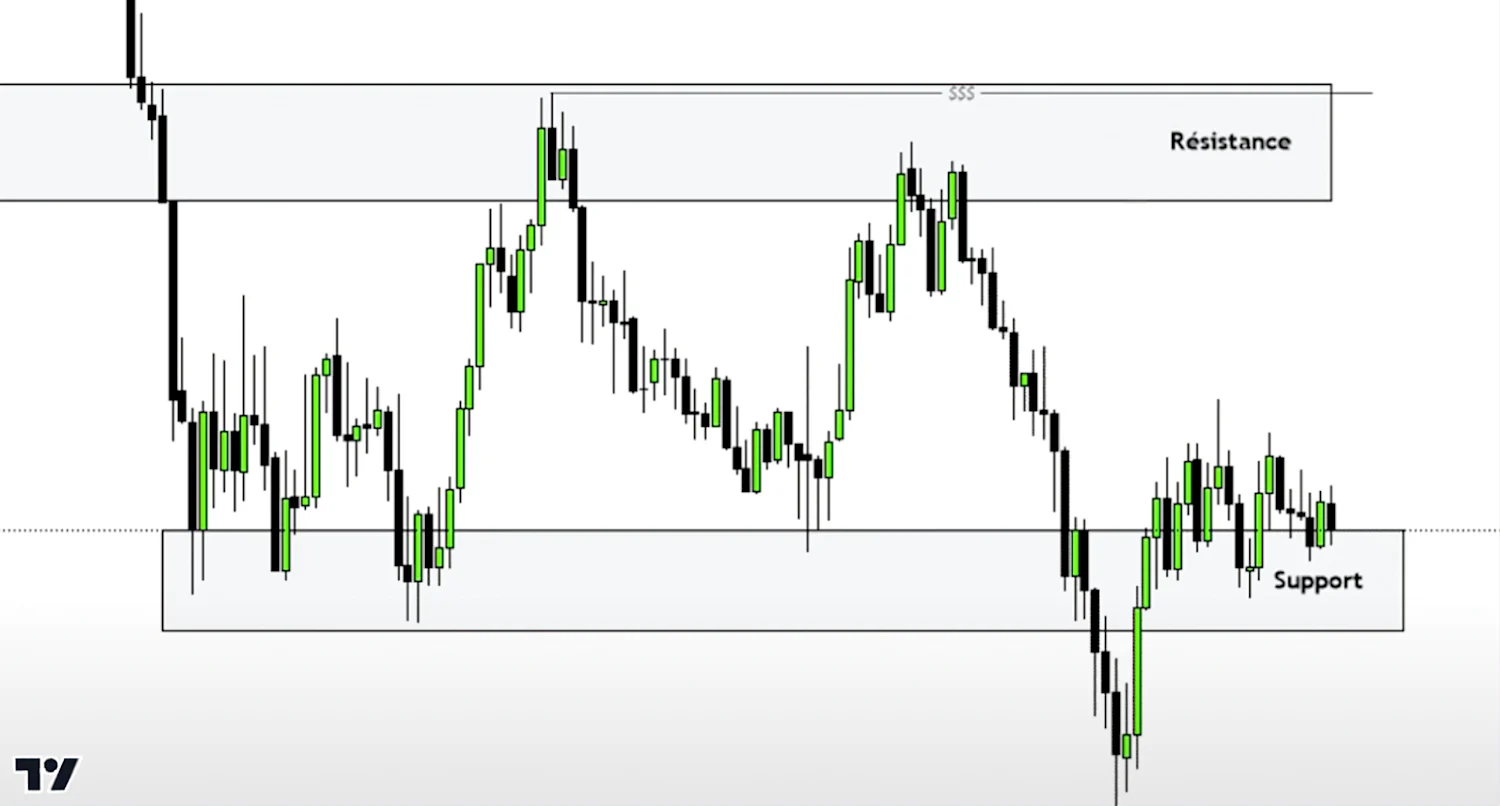
Source: TradingView. Example of support and resistance zones. Provided for illustrative purposes only.
Attention should be also paid to areas of consolidation, which often precede sharp breakouts and can act as strategic entry or exit points.
A proper technical analysis should always lead to a clear trade setup, with an entry point, a stop-loss level, and a take-profit target. A general guideline is to aim for a risk/reward ratio of at least 1.5 or 2, meaning the potential reward would be 1.5 to 2 times greater than the risk taken. Maintaining discipline in following such a plan is just as important as the analysis itself.
It’s also important for traders to diversify their approach. A common mistake among beginners is focusing solely on a single timeframe. Sound analysis always starts with higher timeframes (like daily or weekly) to understand the broader context, and then drills down to lower timeframes (1-hour or 15-minute) for precise entries. This multi-timeframe approach helps avoid trades that go against the prevailing trend and highlights key support and resistance zones more effectively.
Speaking of prevailing trends, it should be noted that technical analysis becomes even more powerful when paired with robust fundamental analysis.
Fundamental analysis is another essential tool of a successful trading strategy. While technical analysis focuses on price charts, candlesticks, indicators, and patterns, fundamental analysis offers a broader, data-driven approach — grounded in macro-economic, financial, industrial and geopolitical data. The core belief is that markets may undervalue or overvalue assets in the short term, but the intrinsic value will eventually be reflected in the price.
For example, renewed tariff wars between major economies — the U.S., China, and the EU — have significantly influenced different asset classes. These trade tensions have triggered massive sell-offs of tech stocks, increased commodity volatility, and pushed gold prices higher as traders sought safe haven to wait out a market storm. While technical analysis might have offered potential entries, traders who didn’t account for these macroeconomic events found themselves in a tight corner.
Therefore, monitoring corporate earnings, merger/acquisition activity, political developments, and even environmental disruptions can offer a significant edge. Armed with this knowledge, traders can make more informed decisions and approach markets with greater confidence.
Here’s the comparison between technical analysis and fundamental analysis:
Criteria | Technical Analysis | Fundamental Analysis |
Objective | Predict price movements | Determine the intrinsic value of an asset |
Method | Study of price charts and technical indicators | Analysis of economic, financial, and industry data |
Time Horizon | Short to medium term | Medium to long term |
Core Assumption | "History repeats itself" — prices reflect all information | Market can misprice assets in the short term |
Common Tools | Moving averages, RSI, MACD, chart patterns | Earnings reports, valuation ratios (P/E, ROE), macro data |
Focus | Market behaviour and momentum | Business fundamentals and economic outlook |
Traders who rely solely on technicals without considering fundamentals often miss the bigger picture. A perfect technical setup in a fundamentally weak company, or a fundamentally strong asset in a technical downtrend, may lead to poorly timed entries and costly mistakes.
It goes without saying that a successful trading journey depends on developing both technical and fundamental understanding of the market. Without deep comprehension, critical thinking, and disciplined practice, traders are prone to overlook valuable signals — often those that are most obvious in hindsight.
Disclaimer: TradingView Inc. (TradingView) is a third-party provider. Any Orders you place on the TradingView System will be transmitted to and executed through the CMC Markets Platform in accordance with the PDS, FSG or IM as relevant and the CMC Markets - Third Party Terms and Conditions - TradingView. Please see these documents along with the TMD at cmcmarkets.com.au. Prices displayed within the TradingView System are indicative only. Any information contained on the TradingView System is provided by TradingView and has not been verified by CMC Markets. CMC Markets shall not be held responsible for any loss that you may incur, either directly or indirectly, arising from any investment based on, or otherwise as the result of the correctness, completeness, accuracy or timeliness of the information provided by TradingView.
Join an award winning CFD providerPractise CFD trading with $10,000 of virtual funds on a risk-free demo account.Access 12,000+ instruments on our award-winning CMC Markets Platform. Including indices, forex and shares.Enhance your CFD trading on MetaTrader4 with CMC Markets and access 175+ forex pairs.Tight spreads and low margin rates.

