This article is brought to you by TradingView
- CFD Knowledge Hub
- Trading guides
- A practical guide to buying the dip
A practical guide to buying the dip

Table of contents
- 1.When is the market really bottoming out?
- 2.Risk management when buying the bottom
In the first half of 2025, retail investors made record net purchases of around $155 billion in U.S. stocks and ETFs, with a total traded value of $6.6 trillion. Despite economic and geopolitical uncertainties, the share of Americans owning stocks has risen to 62%, close to the highs seen after 2007.
Throughout 2025, following S&P 500 corrections of more than 10%, retail investors increased their buying, helping to stabilise the market and shorten drawdown periods. It would seem that some retail investors today are less hesitant during market dips and may continue buying under such conditions. Many came of age during a prolonged bull market supported by the low interest rates that followed the 2007–2008 crisis and lasted until 2021. Expansionary monetary policies, such as quantitative easing, which injected liquidity into the financial system, boosted investors’ risk appetite in a market that grew increasingly overheated, with stock valuations at all-time highs.
However, history shows that “buy the dip” can lead to significant losses in major crises. Premature buying during bear markets often triggers margin calls, intensifying selling pressure and pushing prices even lower.
Identifying genuine market bottoms can be challenging, and while each case is unique, recurring patterns may provide some context for investors seeking to proceed more cautiously when markets appear to be at a low.
When is the market really bottoming out?

Source: TradingView. Past performance is not a reliable indicator of future performance. Images provided for illustrative purposes only.
During the 2020 pandemic crisis, the S&P 500 reached its absolute low at the peak of a steep drop.
Only when strong buying volumes emerged and the VIX (CBOE Volatility Index, or “fear index”) began to decline did prices regain upward momentum. The VIX measures implied volatility in the S&P 500 over the next 30 days, based on option prices, and typically spikes when investors anticipate large market swings — especially to the downside.
The same thing happened during the recent crisis caused by the U.S.–China trade war in spring 2025:
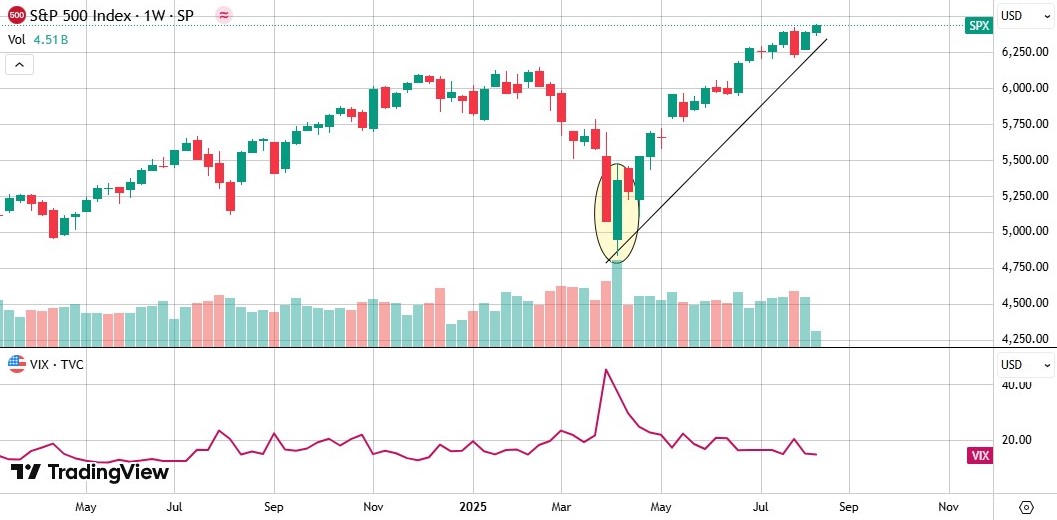
Source: TradingView. Past performance is not a reliable indicator of future performance. Images provided for illustrative purposes only.
Massive volume inflows, followed by a sharp drop in the VIX back toward normal levels, signaled a shift back to an upward trend.
Both of these were “fast” bear markets with record-breaking recoveries.
In contrast, the 2007–2008 subprime crisis followed the same general pattern but stretched over several years. Buying at a false low then would have led to heavy losses — it took at least four years for the market to return to its previous highs.

Source: TradingView. Past performance is not a reliable indicator of future performance. Images provided for illustrative purposes only.
Risk management when buying the bottom
Correct position sizing is essential. While there are several methods, you need to define the maximum acceptable loss — either as a fixed dollar amount or as a percentage of the portfolio.
Example for a $10,000 portfolio:
Maximum risk per trade: 1% ($100)
Entry price: $50
Stop-loss: $40
Risk per share: $50 − $40 = $10
Position size = $100 / $10 = 10 shares
In this case, you would buy 10 shares at $50 each ($500 total exposure). If the price fell to $40, the loss would be about $100 (1% of the portfolio).
Once a potential bottom has been identified, some traders manage uncertainty by entering positions in tranches — for example, allocating a portion initially and then adding further portions if prices decline further. This approach is sometimes viewed as a way to reduce the risk of committing all capital at a single level, although outcomes can still vary.
Stop-loss orders should be placed at well-defined technical support levels, not too close to the entry point, to avoid being triggered by short-term volatility. The ATR (Average True Range) can help set an appropriate buffer.
Maintain portfolio diversification and a cash reserve to handle margin calls or unexpected expenses.
Predefine your exit rules — whether through partial profit-taking, trailing stops, or periodic rebalancing.
Finally, keep a record of your trades, noting your rationale, observed patterns, and outcomes. This helps identify and correct possible behavioural biases.
Conclusion
“Buy the dip” can be a profitable strategy in generally bullish markets, given it’s applied with discipline, proper sizing, and risk controls. However, it can be disastrous in markets facing structural problems or when leverage is used.
Success hinges on three pillars: discipline (clear entry and exit rules), position sizing, and flexibility (incremental entries rather than large, all-at-once bets on presumed absolute bottom). Still, even with these measures, markets can continue to fall, and losses remain a possibility.
Disclaimer: TradingView Inc. (TradingView) is a third-party provider. Any Orders you place on the TradingView System will be transmitted to and executed through the CMC Markets Next Generation Platform in accordance with the PDS, FSG or IM as relevant and the CMC Markets - Third Party Terms and Conditions - TradingView. Please see these documents along with the TMD at cmcmarkets.com.au. Prices displayed within the TradingView System are indicative only. Any information contained on the TradingView System is provided by TradingView and has not been verified by CMC Markets. CMC Markets shall not be held responsible for any loss that you may incur, either directly or indirectly, arising from any investment based on, or otherwise as the result of the correctness, completeness, accuracy or timeliness of the information provided by TradingView.
Join an award winning CFD providerPractise CFD trading with $10,000 of virtual funds on a risk-free demo account.Access 12,000+ instruments on our award-winning CMC Markets Platform. Including indices, forex and shares.Enhance your CFD trading on MetaTrader4 with CMC Markets and access 175+ forex pairs.Tight spreads and low margin rates.

