Oil finds support as volatility falls, but risks remain high
Oil prices are showing signs of stabilisation as geopolitical tensions ease slightly, with volatility declining from recent peaks. However, the market remains sensitive to developments in the Middle East, leaving downside risks firmly in place.
Founder, Mott Capital Management
Geopolitical tensions drive recent volatility
Oil prices have been very volatile in recent weeks due to escalating tensions in the Middle East. Currently, signs of de-escalation have caused oil prices to fall, though some might argue that oil is beginning to establish a natural floor amid this new environment of increased geopolitical risk.
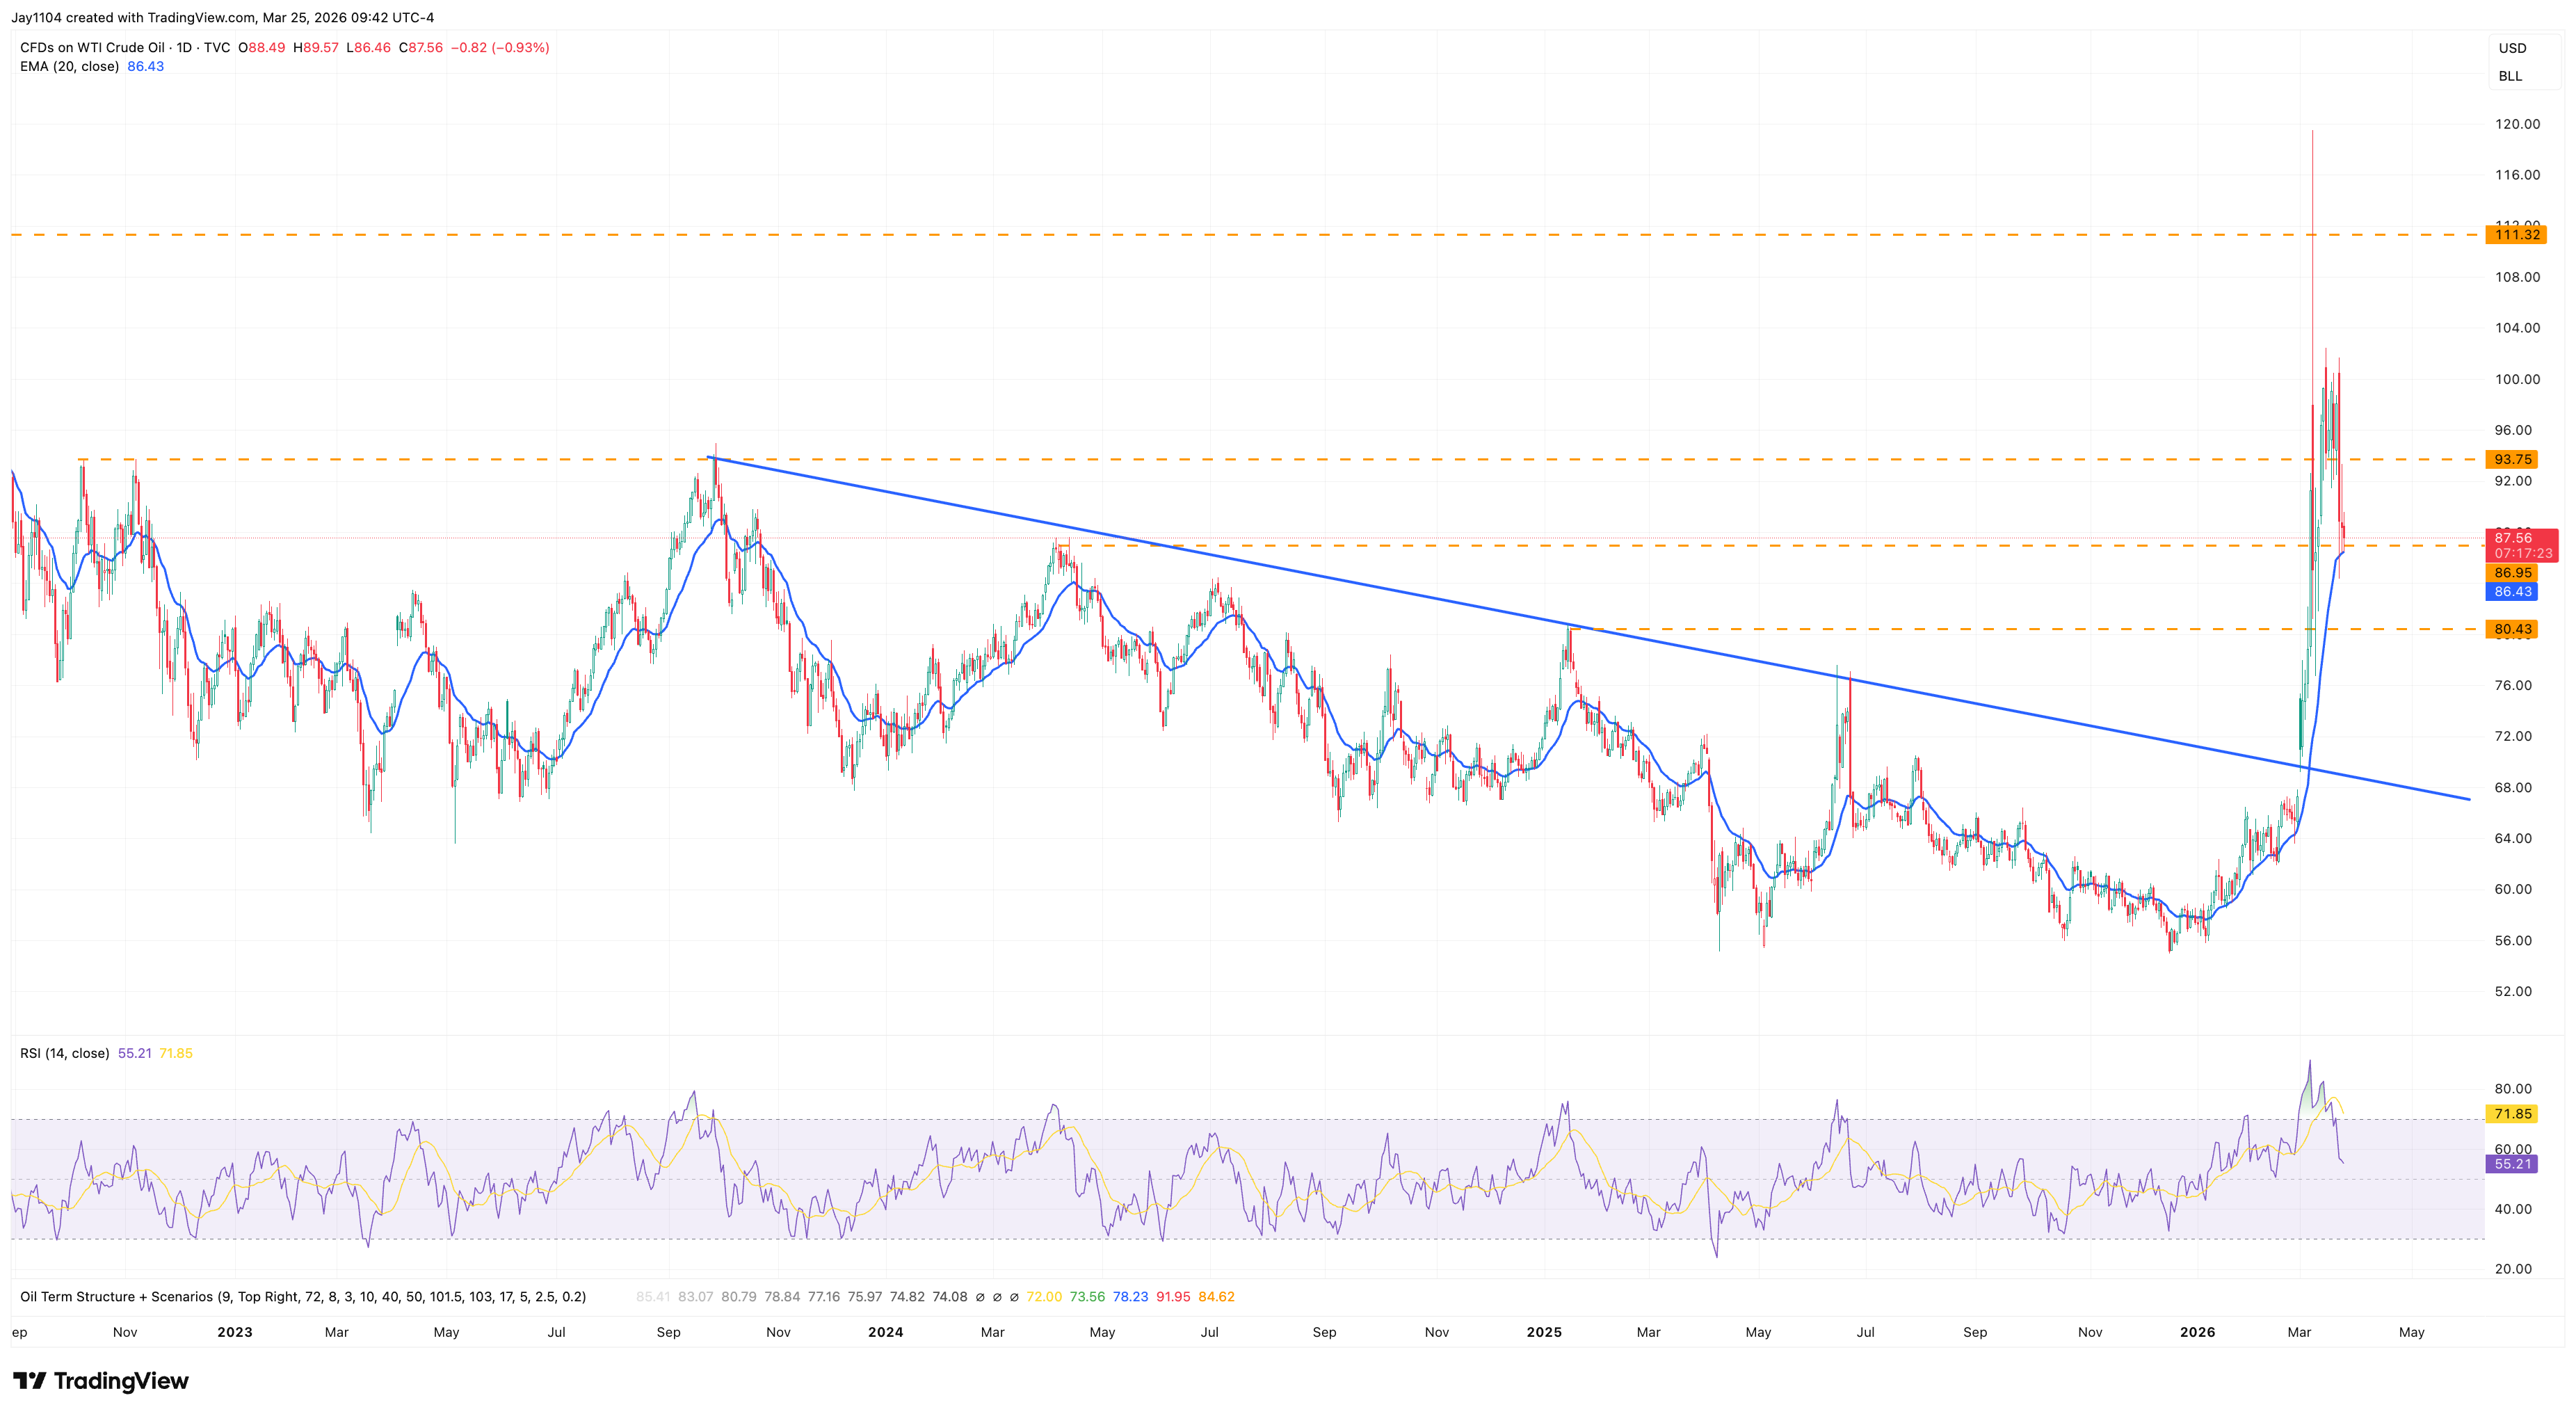
Technical levels point to emerging support
WTI Oil had been holding fairly steadily above the 10-day exponential moving average for some time before breaking below that level on 23 March. It now seems that WTI is trying to find support in the $86 to $88 range, which also aligns with the 20-day exponential moving average. This slightly differs from the 20-day simple moving average, but it does appear to provide at least some support for now.
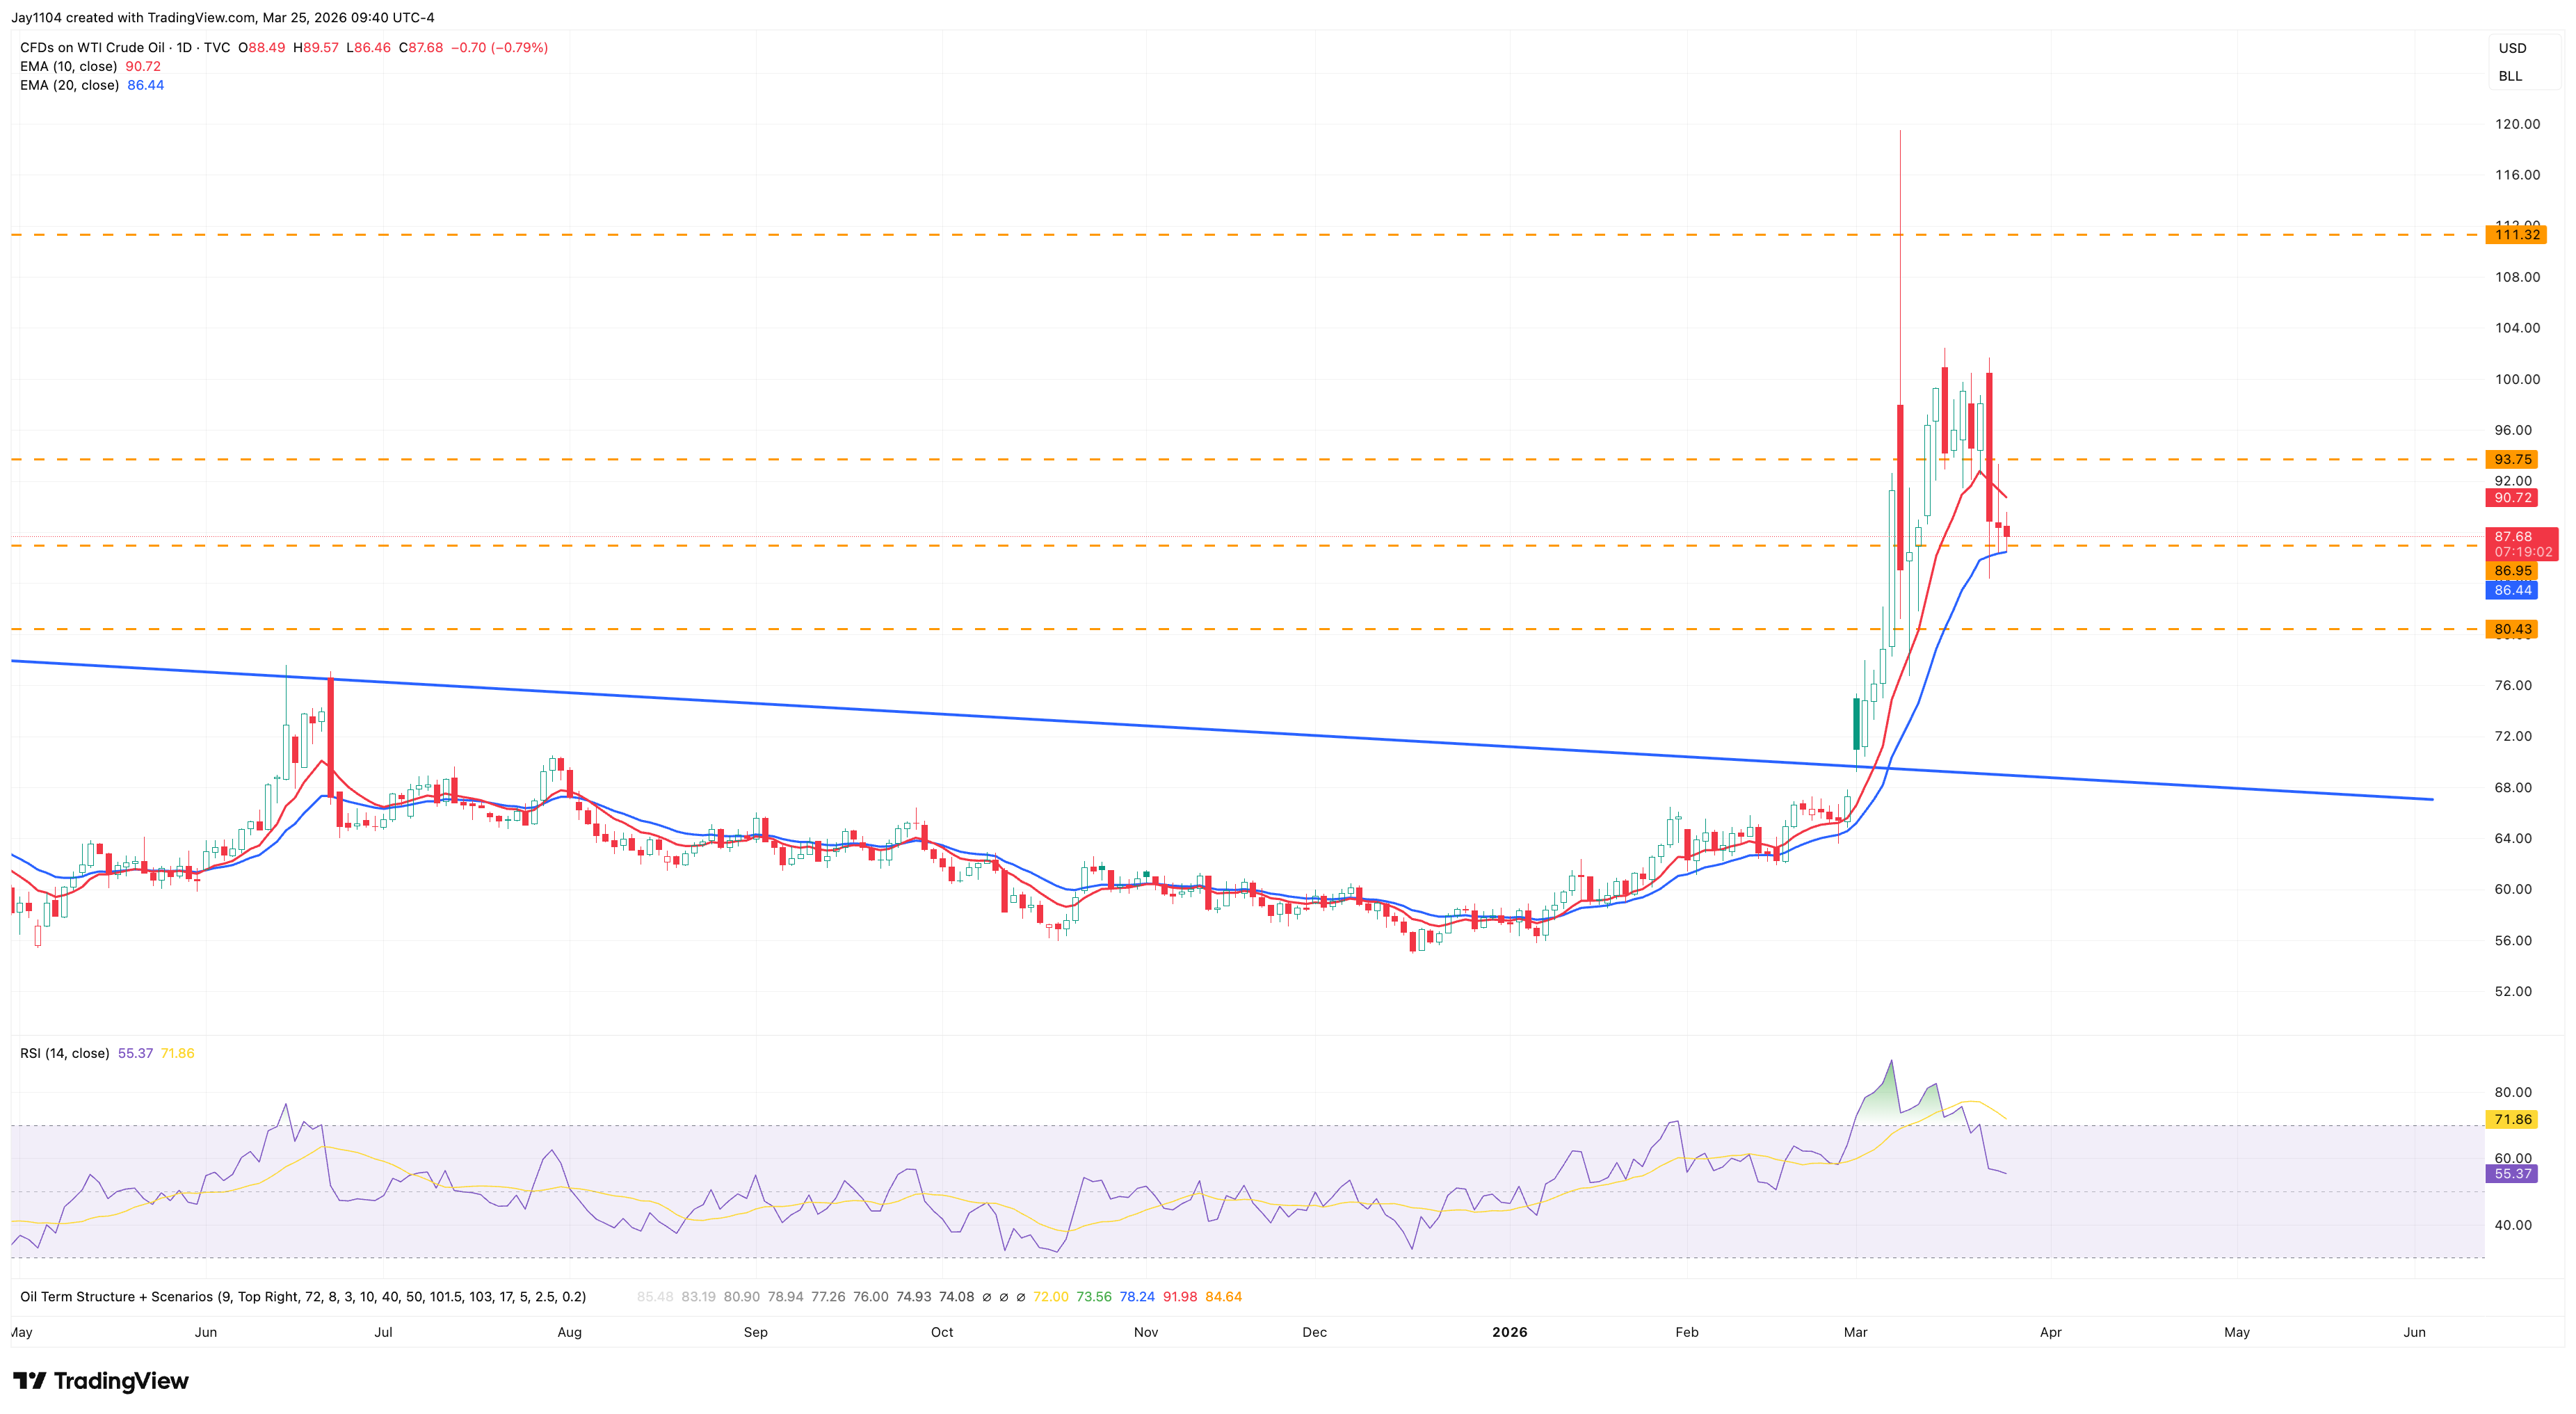
Source: TradingView, 25 March
Volatility eases but remains elevated
That is worth noting, especially if volatile headlines from the Middle East continue and price movements start to shrink as volatility is reassessed downward. The OVX, the CBOE crude oil volatility index, has dropped sharply over the past few sessions and is now trading around 90, well below its recent peak near 130. Although this still indicates elevated implied volatility, it also suggests that conditions are beginning to diminish.
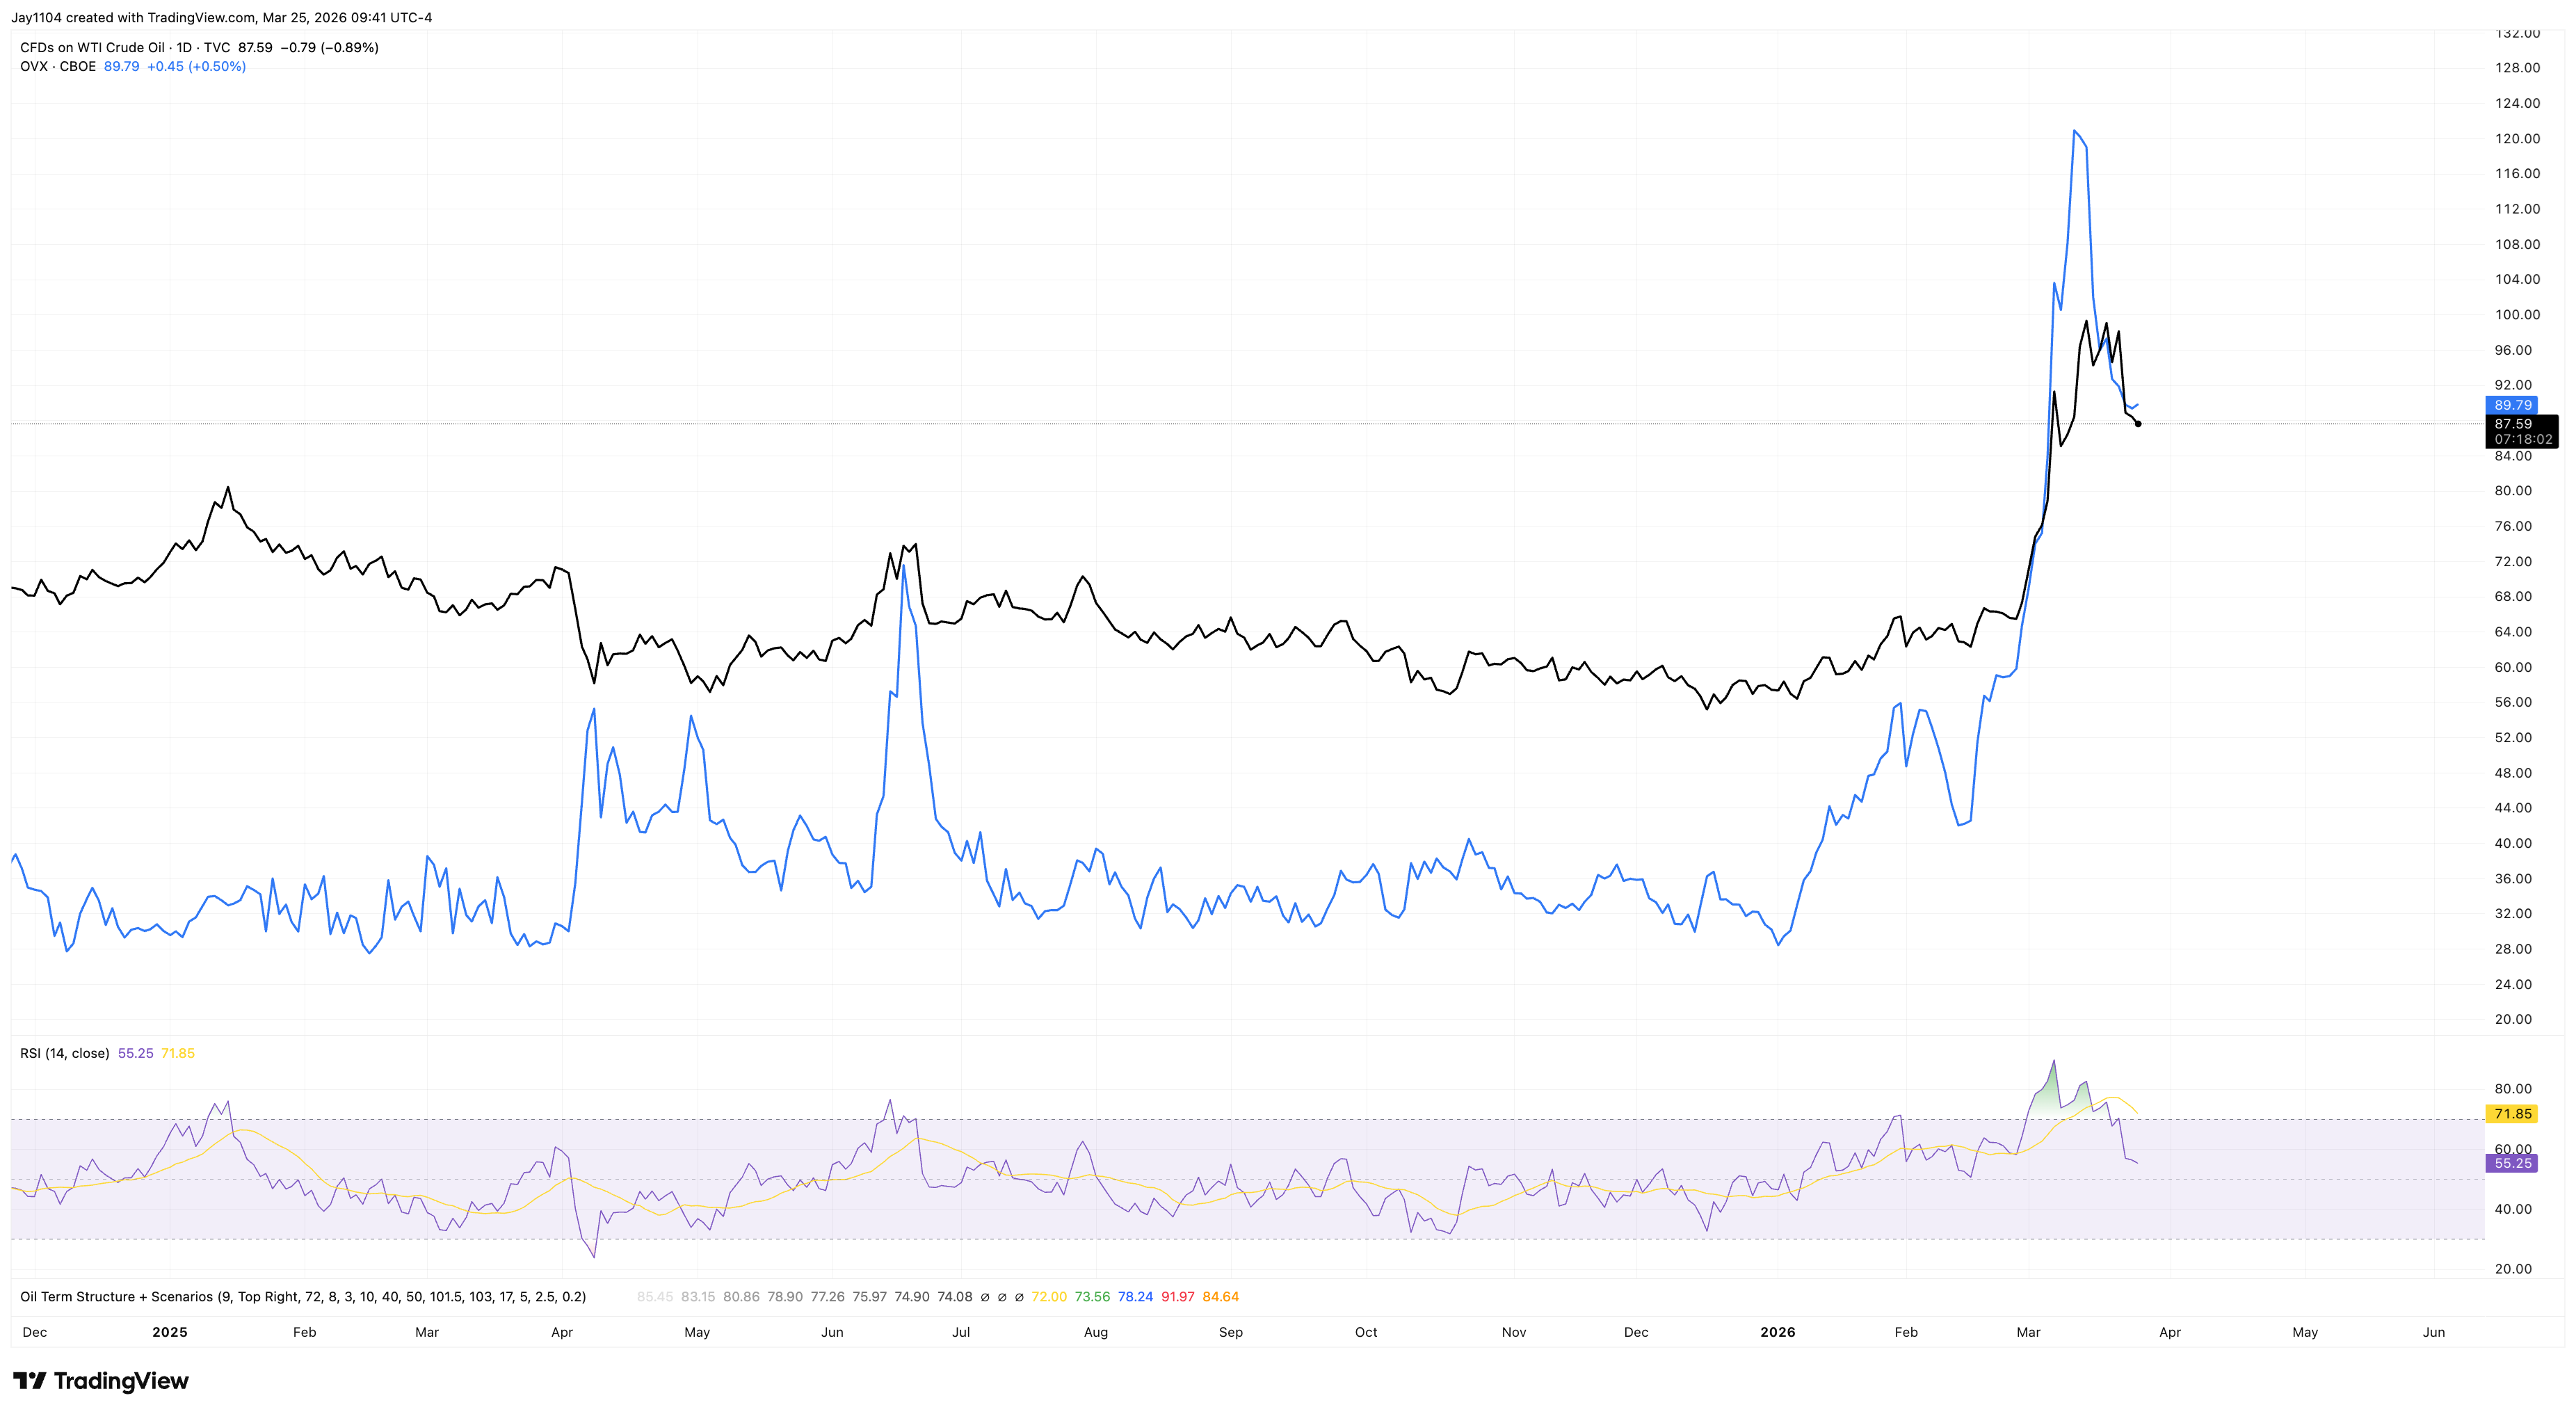
Source: TradingView, 25 March
Key levels to watch in the near term
In the coming days, it will be important to observe whether implied volatility continues to decline and whether oil prices stabilise around current levels. It is possible that the $86 level in WTI becomes a medium-term floor. However, a break below $86 and the 20-day exponential moving average would be bearish and could open the door to a sharper decline, potentially towards $80 – retracing a significant portion of the gains seen on 6 March, when oil prices increased by nearly 16%.
Source: TradingView, 25 March

DAX sell-off accelerates – US ultimatum to Iran fuels escalation and weighs on equity markets
Geopolitical escalation linked to a US ultimatum to Iran has triggered a sharper decline in the DAX, as investors reduce risk exposure. Rising oil prices and inflation concerns are key transmission channels driving weakness in European equity markets.

The Week Ahead: Inflation watch, Flash PMIs, Carnival earnings
Welcome to Michael Kramer’s pick of the key market events to look out for in the week beginning Monday 23 March.
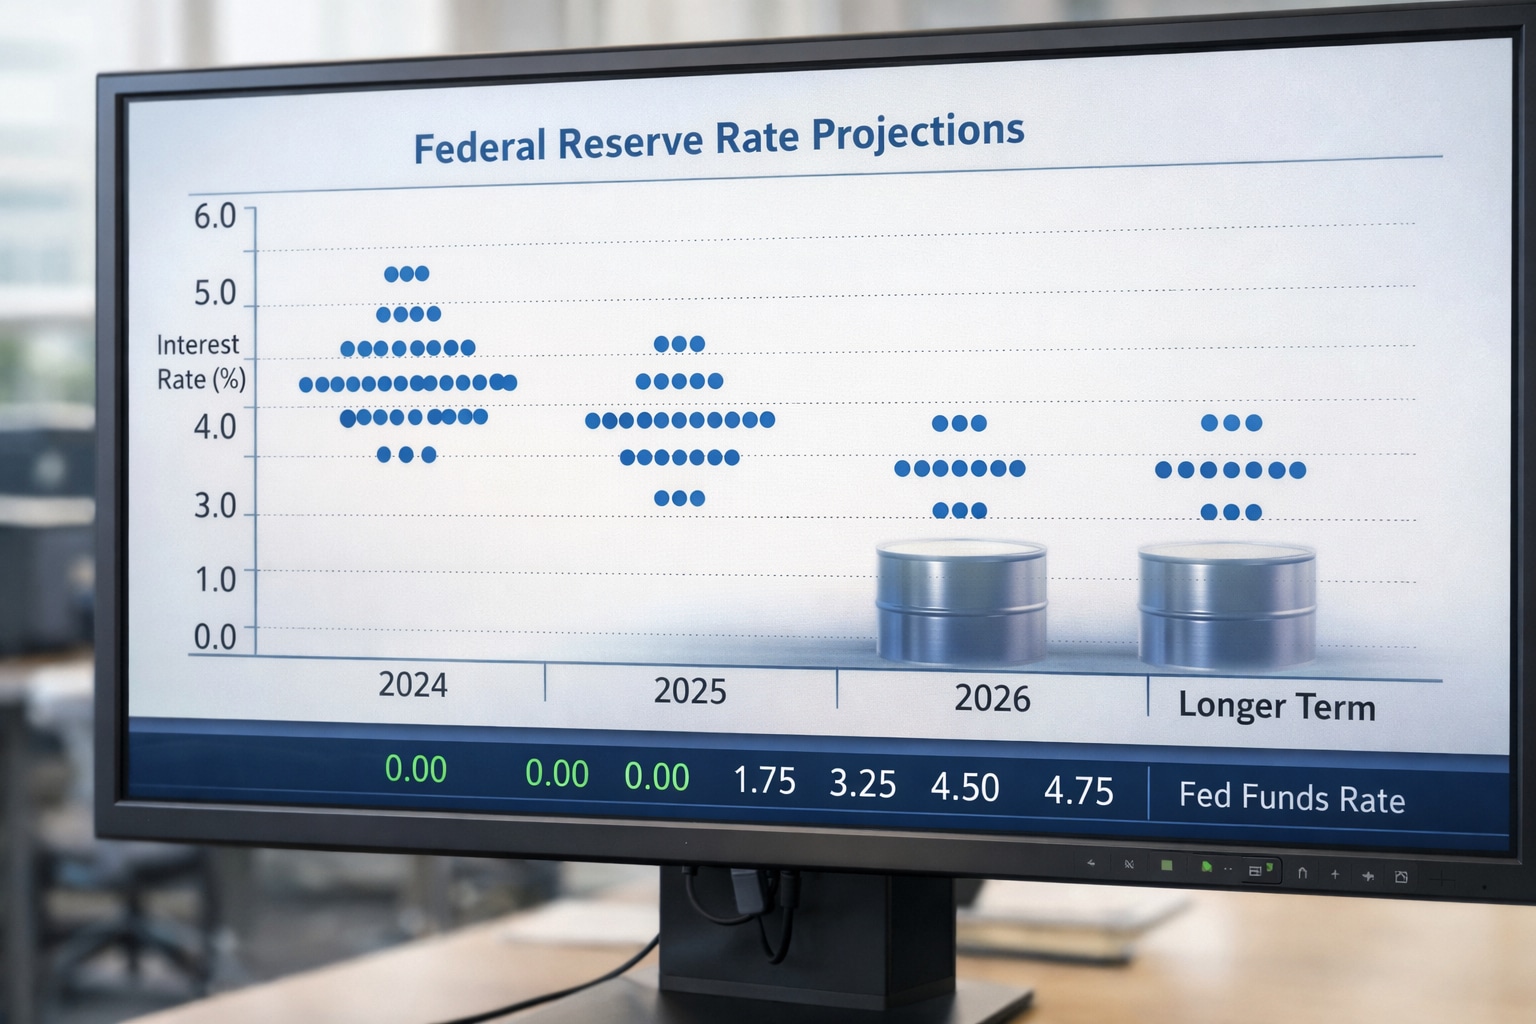
The Fed calibrates the oil shock: PCE at 3.00% and an end to rate cuts in 2026?
Fed rate decision and projections at 5pm, followed by Powell at 5:30pm. Financial conditions remain loose, and higher oil could push Personal Consumption Expenditures (PCE) towards 3.00%. Will the dot plot signal no rate cuts in 2026?