
S&P 500 and Nasdaq 100 hit record highs, but volume is lagging
S&P 500 and Nasdaq 100 have broken above their previous record highs after a sharp V-shaped rebound from the 30 March lows. The move appears to have been driven partly by short-covering, but low volume and narrow market breadth may mean the breakout still needs firmer confirmation.
Market Analyst
Record highs after a V-shaped rebound
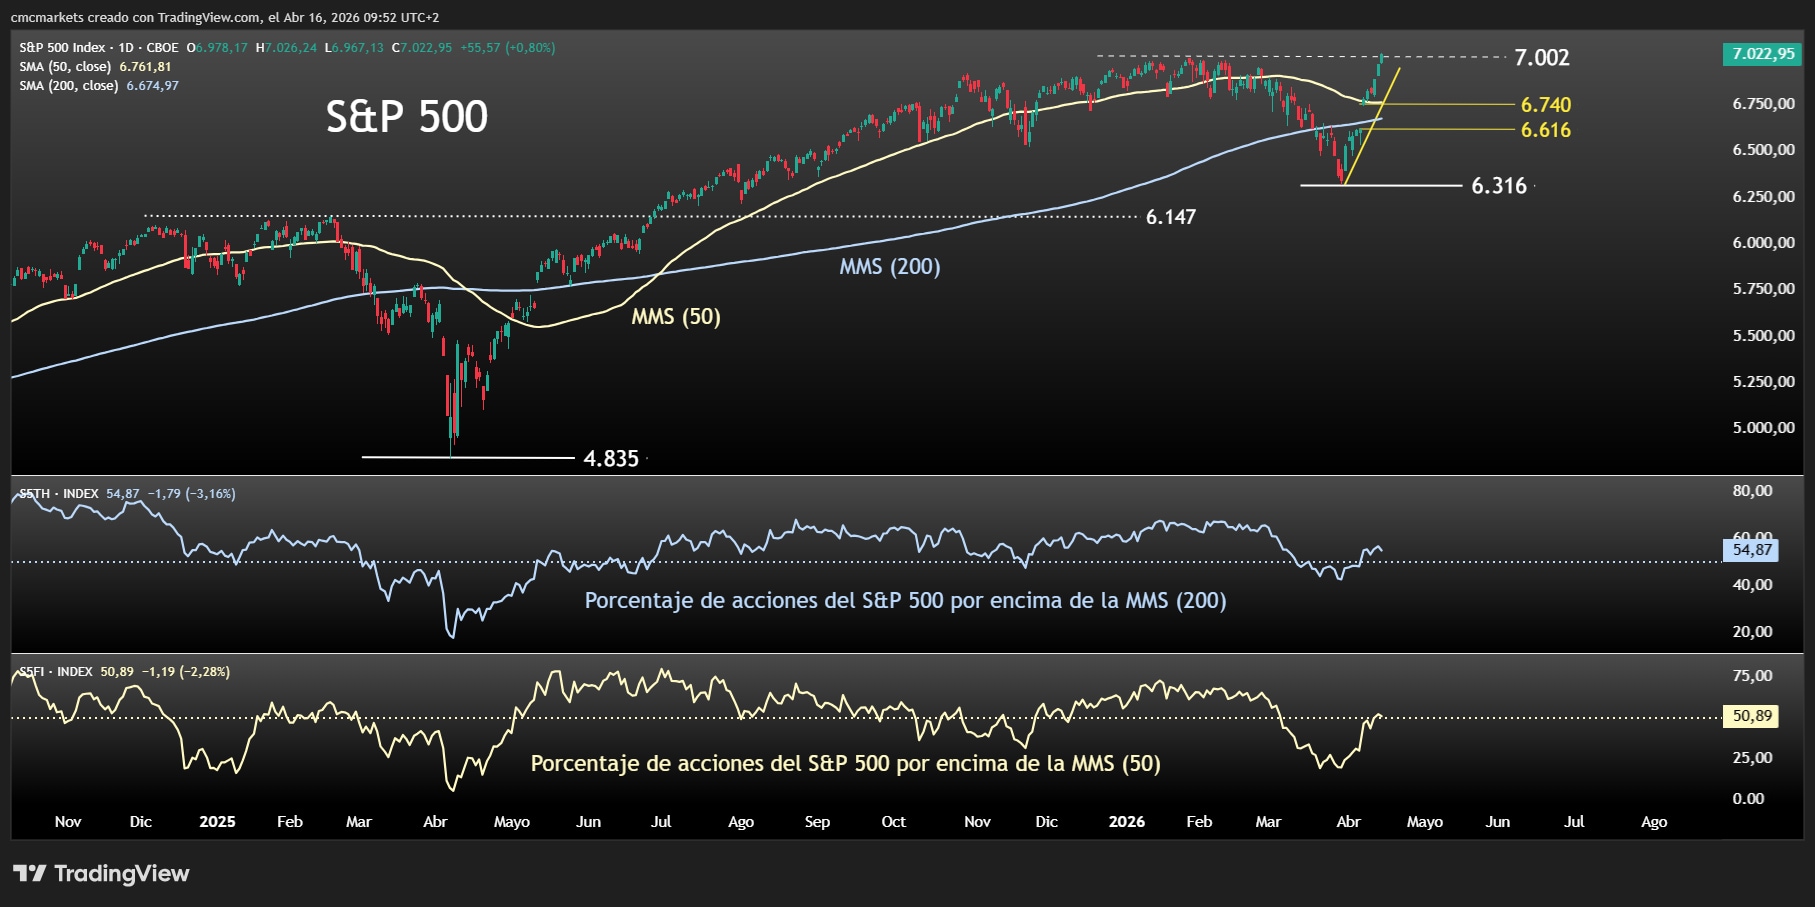
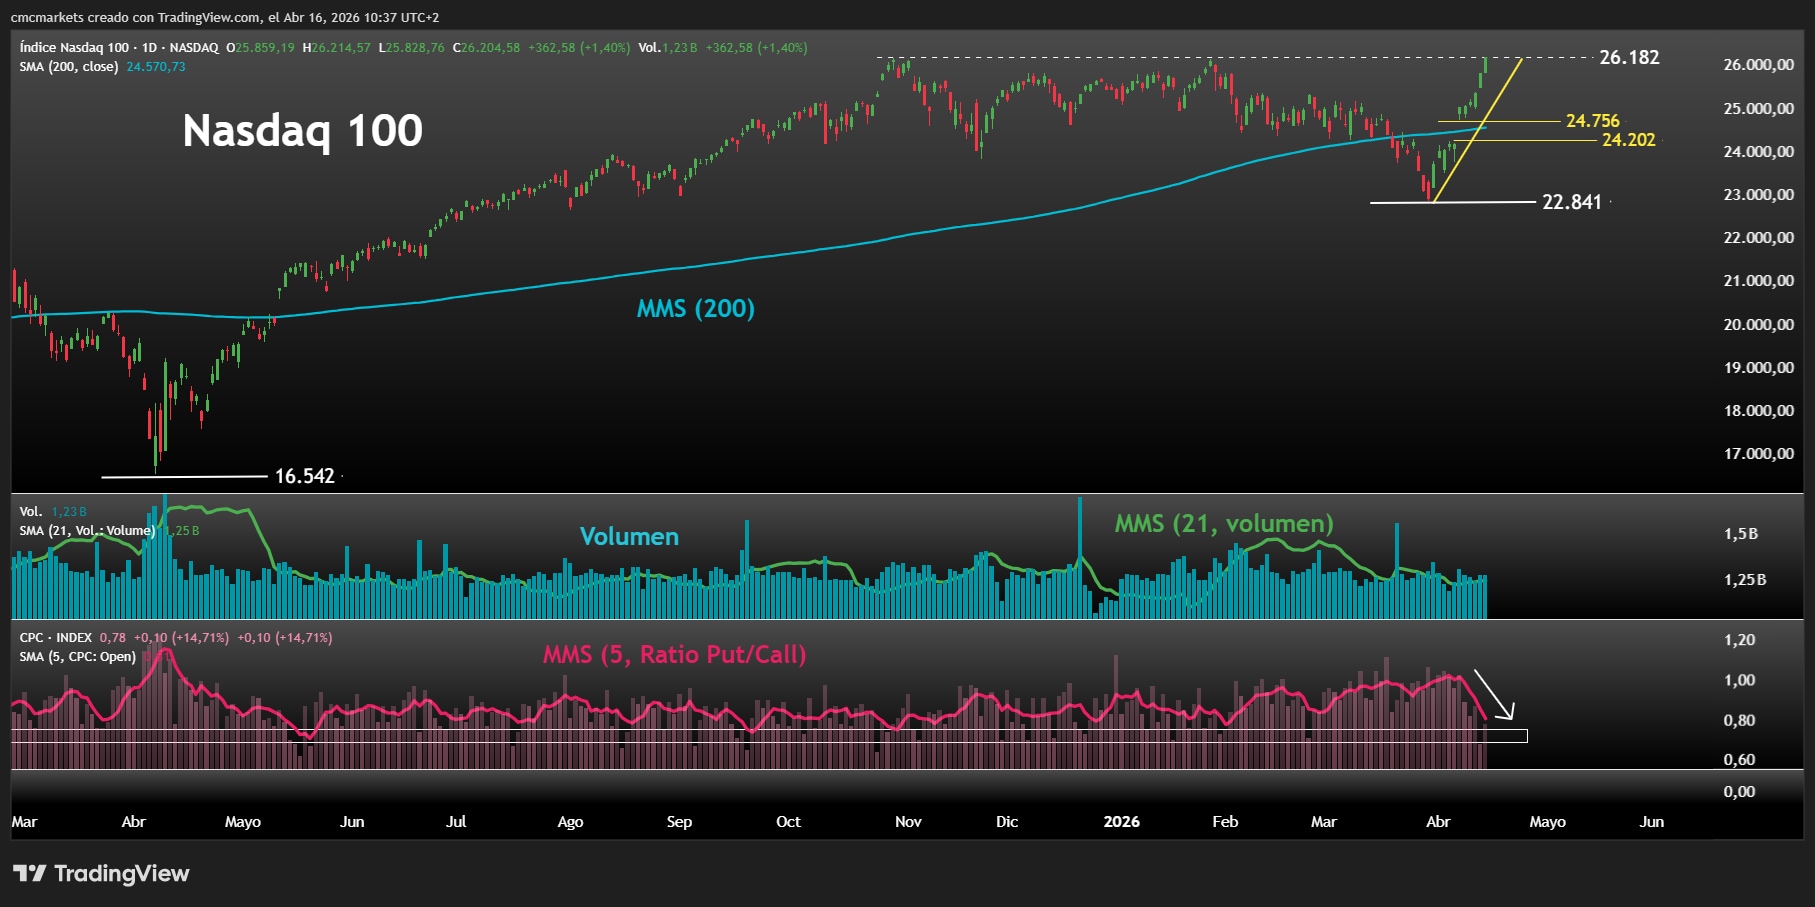
S&P 500 and Nasdaq 100 have climbed sharply from their 30 March lows at 6,316 and 22,841 points respectively, and both indices have now moved above their previous record highs at 7,002 and 26,182. The rebound has been fast enough to put both benchmarks back into fresh-high territory rather than leaving them in a typical relief rally below the old peak.
Source chart: S&P 500 daily chart showing the share of index members trading above their 50-day and 200-day simple moving averages, via TradingView on 16 April 2026.
The breakout still lacks broad confirmation
The move is strong, but the source analysis argues that trading volume has not expanded enough to confirm the strength of the breakout. Market breadth also remains relatively narrow, with a limited share of S&P 500 constituents trading above their 50-day and 200-day moving averages even as the headline index pushes into new highs.
Source chart: Nasdaq 100 daily chart showing volume and the five-session CBOE total put/call ratio, via TradingView on 16 April 2026.
Short-covering may have amplified the rally
Part of the recovery may have been driven by investors closing bearish positions rather than by a broad, conviction-led risk-on move. The article points to a sharp fall in the VIX from 31 to 17, a five-session CBOE put/call ratio dropping from above 1 to below 0.80, and a decline of more than 25 points in SKEW towards annual lows as signs that short-covering may have helped fuel the rally.
That does not invalidate the move, but it may make the breakout more vulnerable if follow-through demand fails to appear once those mechanical flows fade.
The 8 April gap is the key support zone
From a technical perspective, the source argues that price still has the final say. If the indices can consolidate above their former highs, the market may continue in a broader uptrend. If not, the first important support zone sits at the bullish gap opened on 8 April: 24,756 to 24,202 points for Nasdaq 100 and 6,740 to 6,616 points for S&P 500.
As long as those ranges hold, the technical deterioration may remain limited. A break below the lower end of those gaps would increase the risk of a deeper setback and could even bring a possible 'death cross' back into view, with the 50-day simple moving average falling below the 200-day line.

FTSE 100 opens flat as Middle East risks continue to dominate sentiment
The FTSE 100 opened broadly unchanged around 10,700 as Middle East risks continued to dominate sentiment, supporting energy and mining stocks while investors watched Segro, 3i Group and the ECB.
DAX remains range-bound as investors sell both good and bad news
The DAX remains trapped around 25,000 as investors use both strong and weak earnings news to reduce risk, while elevated energy prices and today's ECB decision keep sentiment cautious.

EUR/USD faces the ECB at key support as Lagarde takes centre stage
EUR/USD is testing the base of a long-running range as markets expect the ECB to keep rates unchanged at 2.25%. With Brent near $95, investors will focus on whether Christine Lagarde softens her hawkish tone or keeps inflation risk front and centre.