Outlook 2026: Steepening yield curve, strong metals may push FTSE higher
As part of our series exploring the outlook for key financial instruments and markets in the year ahead, our market analyst Michael Kramer assesses what might come next for the FTSE 100 and GBP/USD, following a strong 2025 for both.
Founder, Mott Capital Management
As part of our series exploring the outlook for key financial instruments and markets in the year ahead, our market analyst Michael Kramer assesses what might come next for the FTSE 100 and GBP/USD, following a strong 2025 for both.
Both the FTSE 100 and the British pound experienced a reasonably strong year, with the FTSE rising by approximately 20% and the pound gaining roughly 8% against the US dollar. This came despite a challenging economic backdrop, with the unemployment rate rising, inflation remaining elevated, and economic growth essentially stalling. Even so, the FTSE could continue to benefit through 2026, given its heavy weighting toward financials and its increased exposure to rising metal prices.
Higher 10-year rates
Much of the outlook for both the pound and the FTSE is likely to be determined by the path of UK interest rates. UK 10-year gilt yields effectively stalled in 2025, moving largely sideways and remaining near their highest levels since 2008, reflecting a stagflation-like environment. This has occurred despite the Bank of England cutting rates six times since August 2024, and with markets currently pricing in one, and possibly two, additional rate cuts in 2026. That said, the rate-cutting cycle may be nearing its end.
If the cutting cycle is nearing completion as economic conditions begin to improve, UK 10-year yields could rise again in 2026. From a technical perspective, the 10-year gilt appears positioned for such a move. Yields have repeatedly struggled to break above 4.9%, but more importantly, price action suggests the potential formation of a pennant pattern. If this pattern resolves in line with the broader long-term uptrend, a sustained break above 4.9% could open the door to a move towards approximately 5.25%.
UK Government Bonds 10yr yield & RSI chart
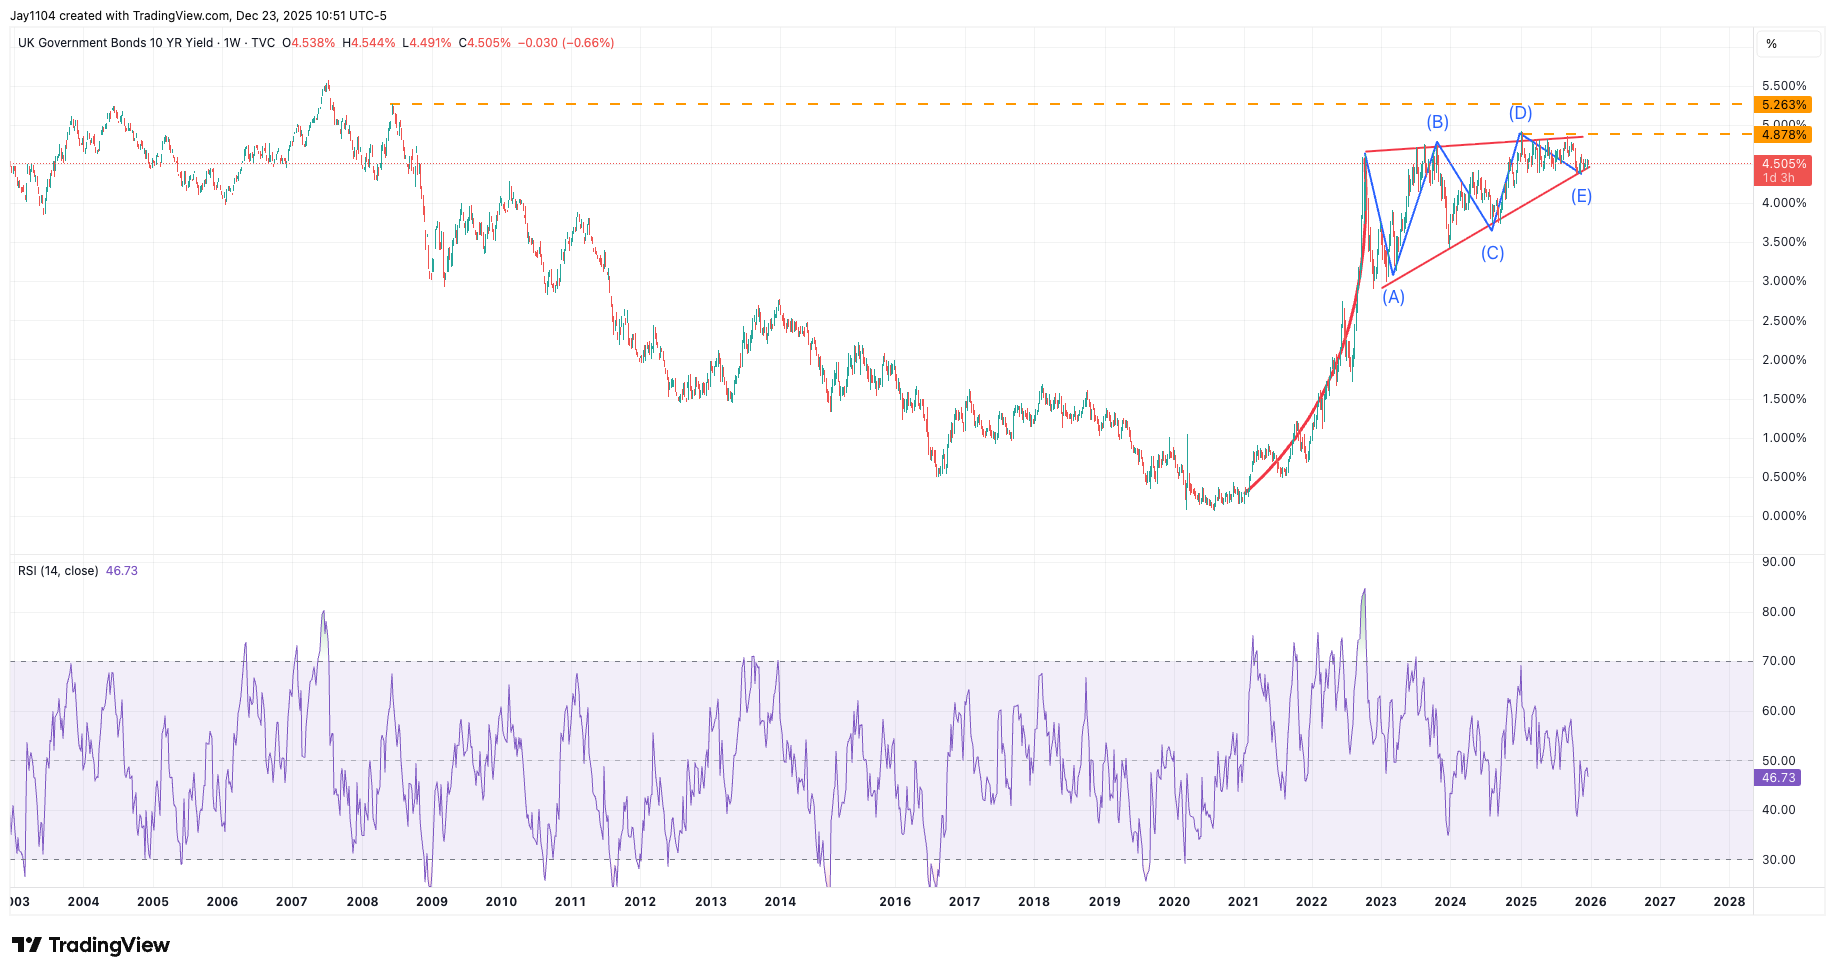
Source: TradingView, 23 December 2025
Could the FTSE rise further?
A steeper yield curve would undoubtedly be positive for the FTSE, and more specifically for the financial sector within the index. In addition, the sharp rise in metals such as copper, silver, and gold could support higher revenues and profits for the mining sector, which in turn may help lift the broader UK equity market.
From a technical perspective, the FTSE 100 has formed a bullish continuation pattern known as an ascending triangle. The index would need to break above 9,950 to confirm the breakout. If that occurs, the FTSE could move higher. Measuring the potential move from the base of the triangle to resistance suggests upside of roughly 7%, targeting around 10,620, which could provide a strong start to 2026.
UK 100 index & RSI chart (Jul 2022-23 Dec 2025)
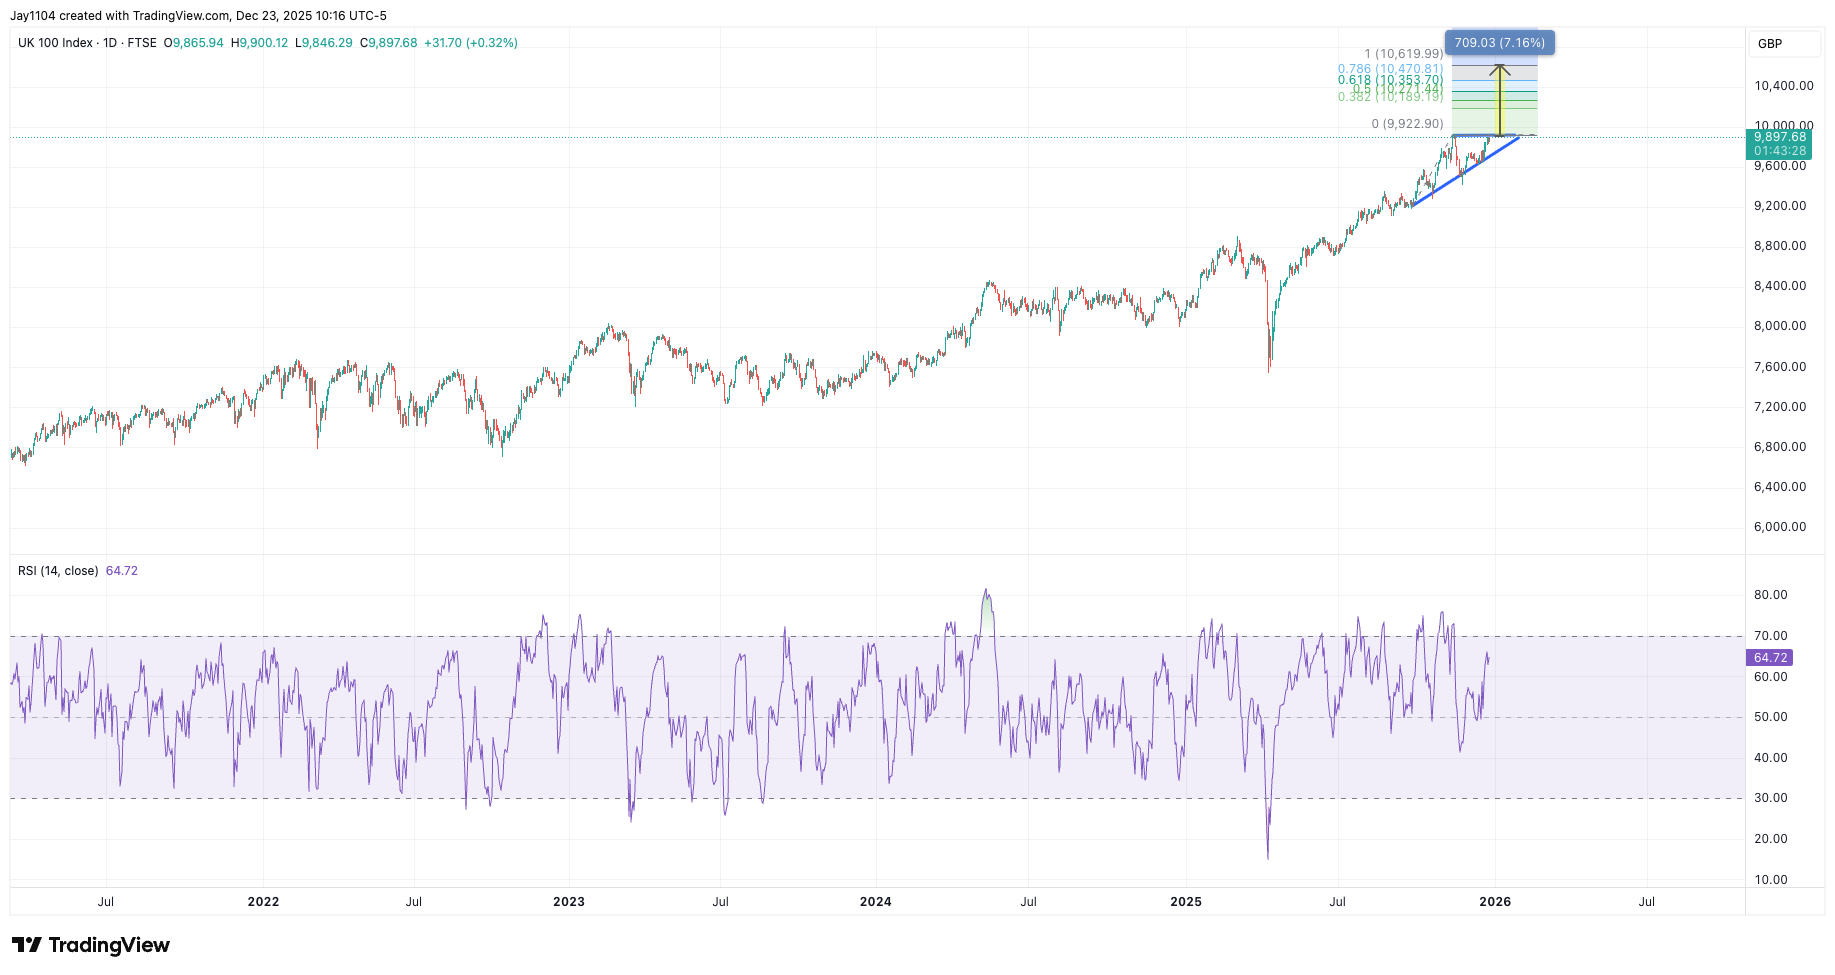
Source: TradingView, 23 December 2025
If metals such as copper continue to move higher, as they did in 2025, this could provide further support to the FTSE 100 over the course of the year. Over time, the FTSE 100 has shown a strong relationship with copper prices, and with copper trading at record highs, this could bode well for the index.
UK 100 index and RSI (Sep 2023-23 Dec 2025)
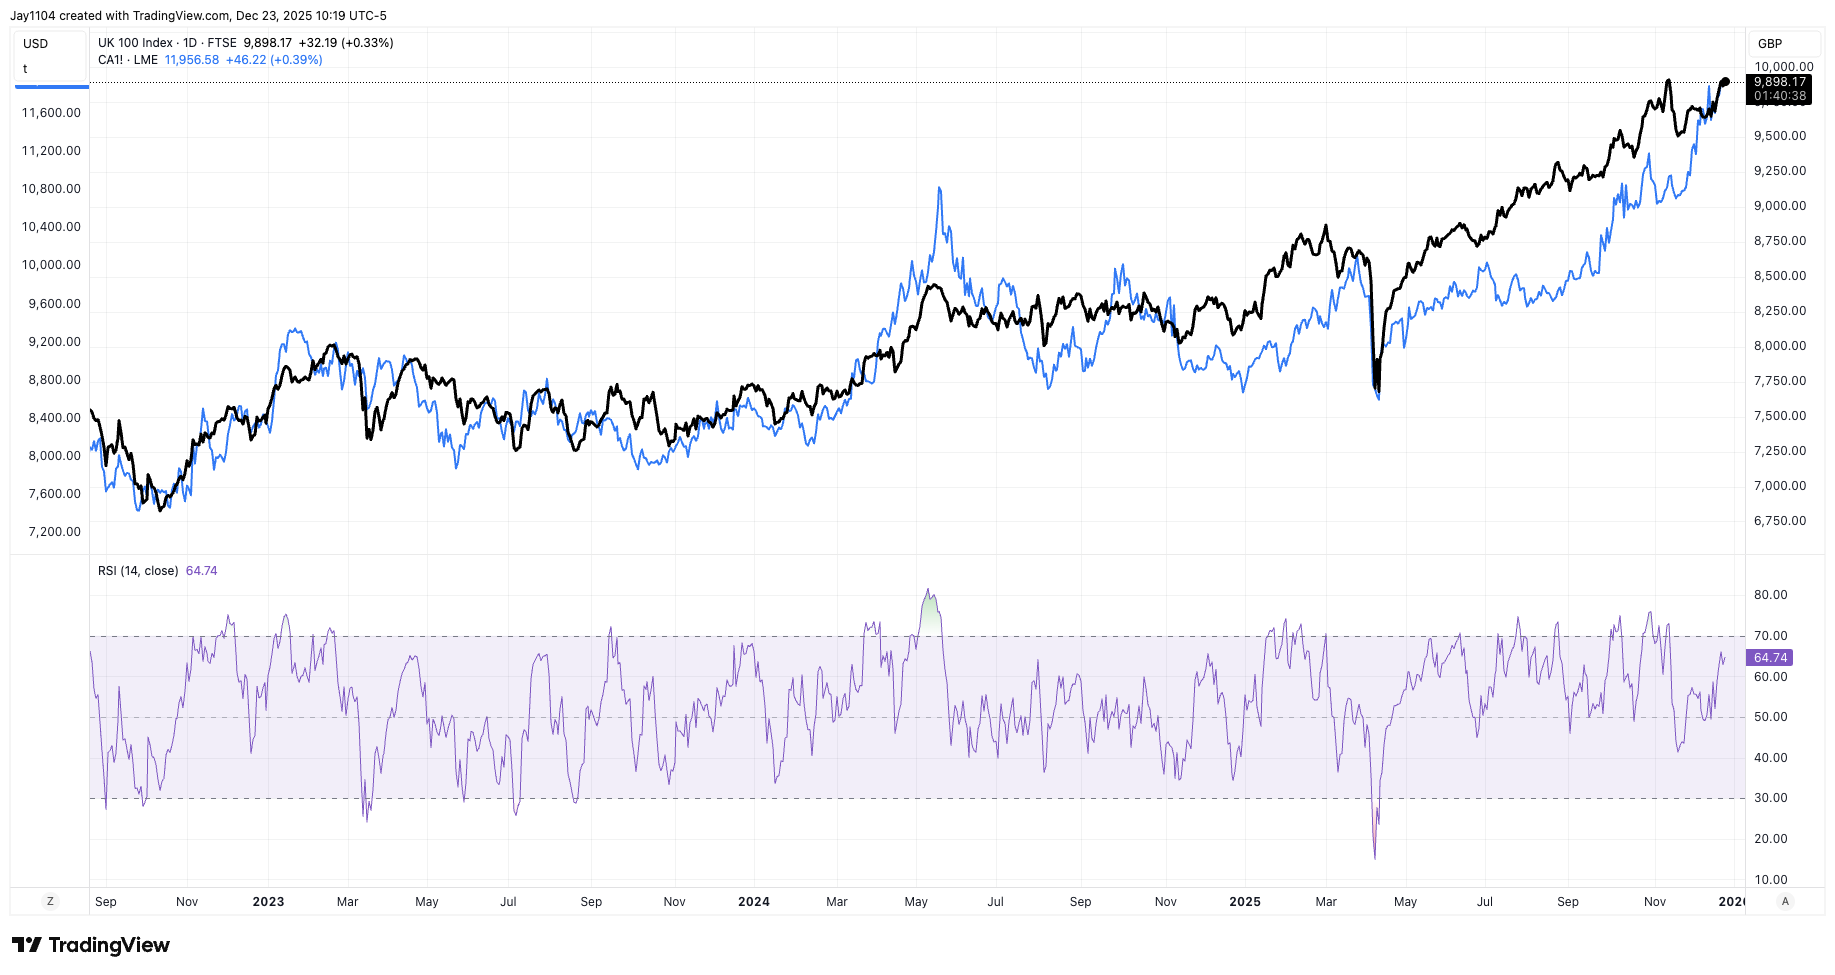
Source: TradingView, 23 December 2025
Copper could perform even better in 2026 if the US dollar continues to weaken. The dollar index has pared recent gains, and the British pound has clearly benefited as a result. GBP/USD has recently broken out of a downtrend and begun to move higher. The key test for the pound, however, lies around $1.355, a level at which it has struggled on several occasions in recent months.
Will GBP/USD extend gains?
From a technical perspective, what may matter more for the pound is that it has avoided a double-top pattern taking hold. The pound came close to confirming this bearish formation when it briefly fell below the neckline at $1.317, but it reversed from that level and moved higher. The failure to sustain a break below the neckline can be viewed as a bullish development, suggesting that the broader uptrend could remain intact into 2026.
GBP/USD & RSI chart (Sep 2025-23 Dec 2026)
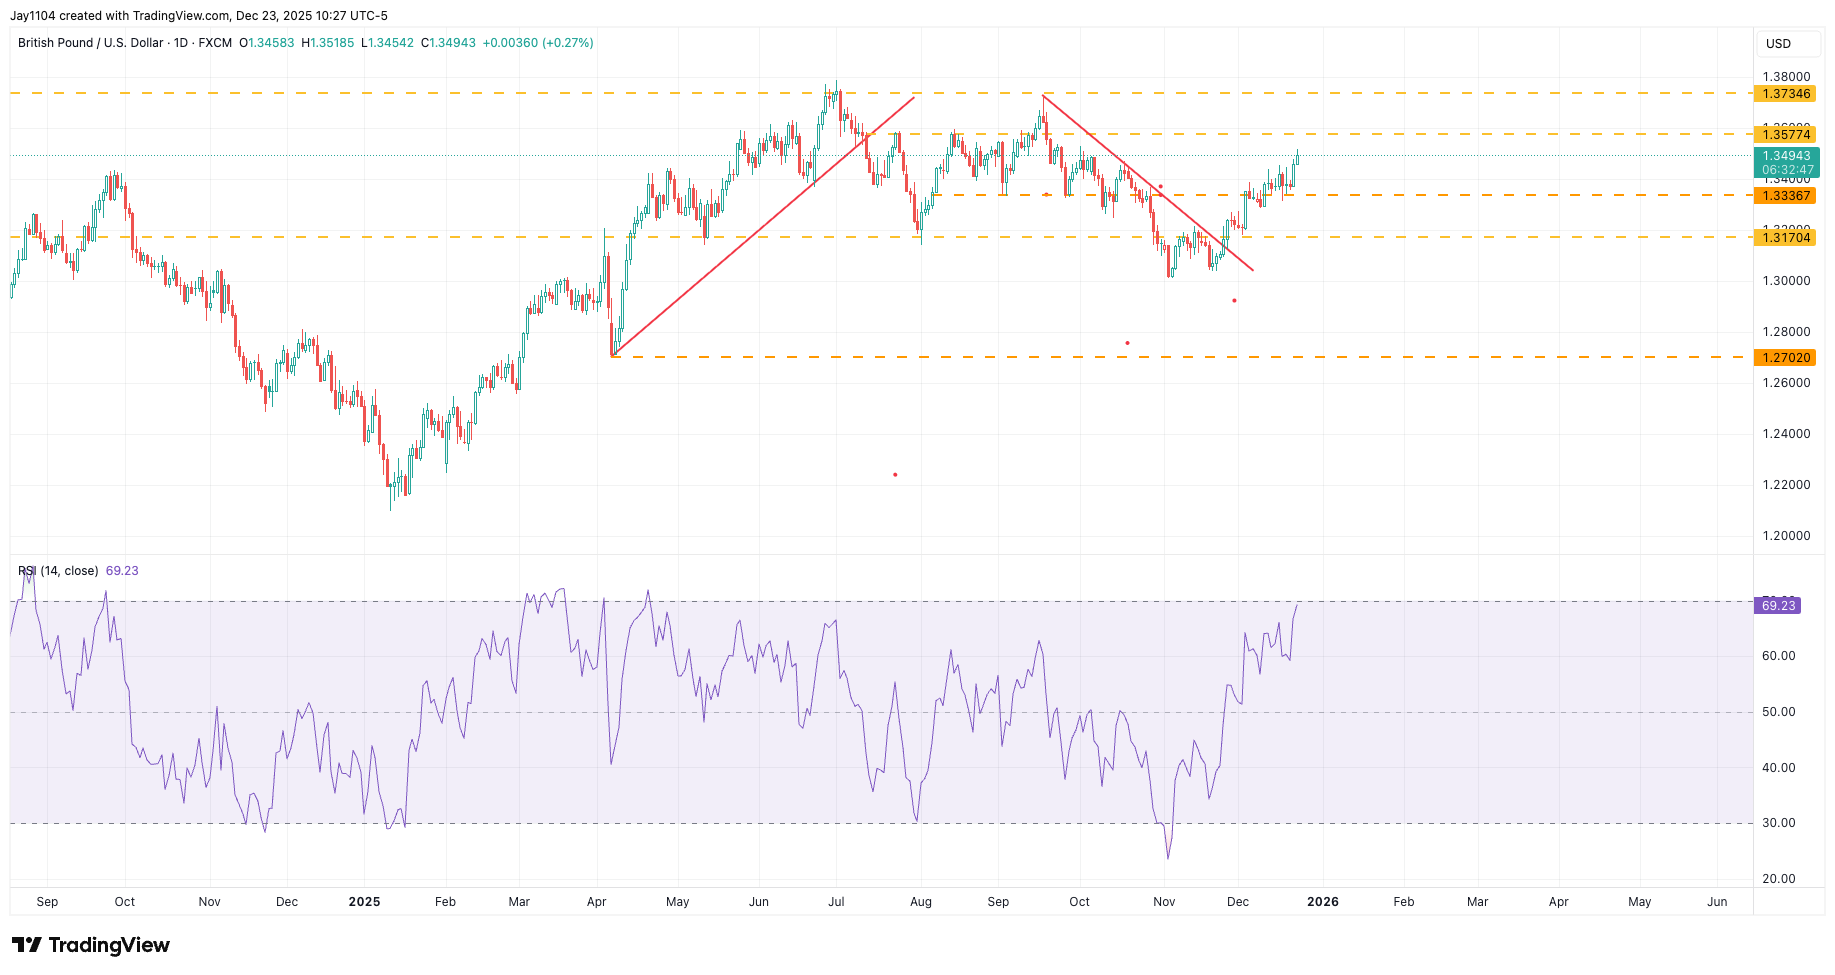
Source: TradingView, 23 December 2025
A move above $1.357 could open the door for the pound to advance towards $1.373, a resistance zone it has failed to break since January 2022. This is likely to prove a more challenging area for the pound to move beyond. However, if it were to clear that level, the pound could strengthen further, potentially pushing back towards $1.42 against the US dollar.
GBP/USD & RSI chart (Jul 2020-Dec 2025)
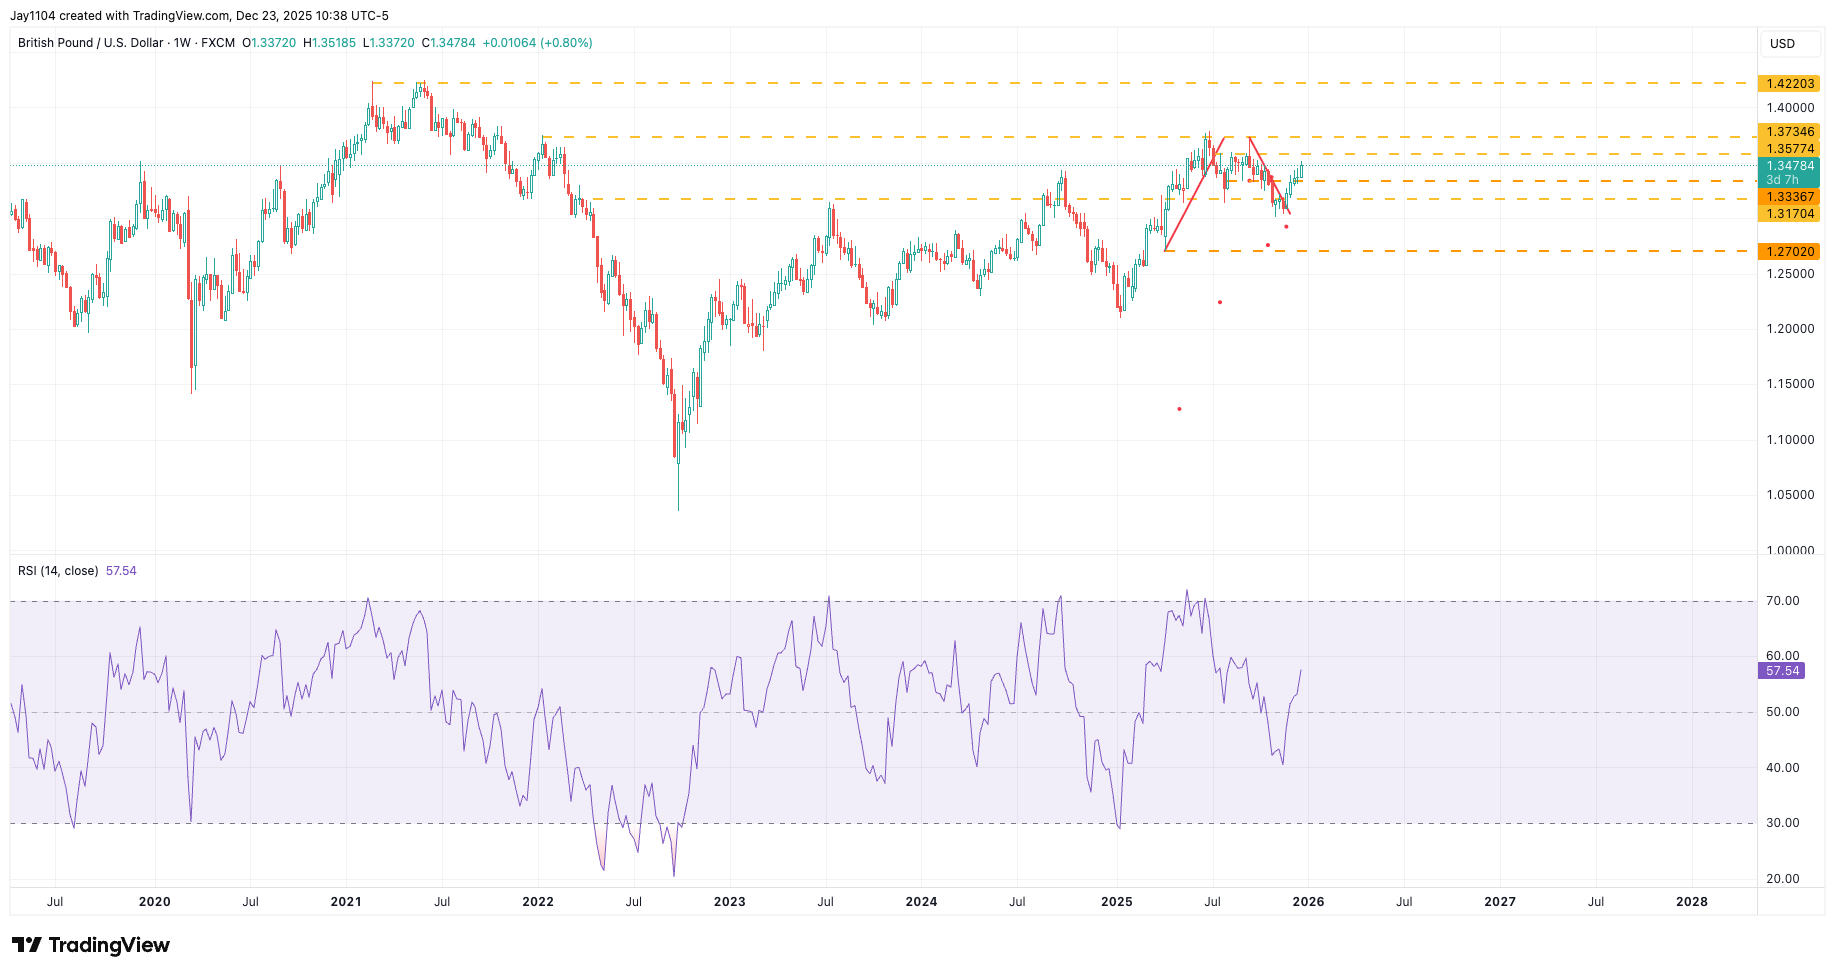
Source: TradingView, 23 December 2025
That said, economic conditions are likely to evolve over the next 12 months, and monetary policy will continue to adjust accordingly. Markets are inherently fickle, and even the best-constructed outlooks can change at short notice. What appears promising today can quickly fade tomorrow, making flexibility and a willingness to adapt one's view essential to successfully navigating the year ahead.

DAX seen opening slightly lower as Fed keeps rate hike option alive
The DAX is expected to open modestly lower after the Federal Reserve left rates unchanged but kept further tightening on the table, while investors digest mixed results from Meta, Microsoft and Airbus ahead of a packed macro calendar.