
Oil’s rally faces its first technical test, as support region nears
WTI oil prices have surged amid escalating geopolitical tensions, but the rally is approaching an important technical support zone that could determine whether the trend continues or begins to cool.
Founder, Mott Capital Management
Oil rally driven by geopolitical tensions
West Texas Intermediate (WTI) oil has surged amid rising tensions in the Middle East and the conflict involving the United States (US) and Israel with Iran. The price trend has been characterised by a steady rise, with the 10-day exponential moving average (EMA) acting as support and the upper Bollinger Band serving as resistance.
In addition, previous levels that acted as strong support or resistance have continued to influence price action.
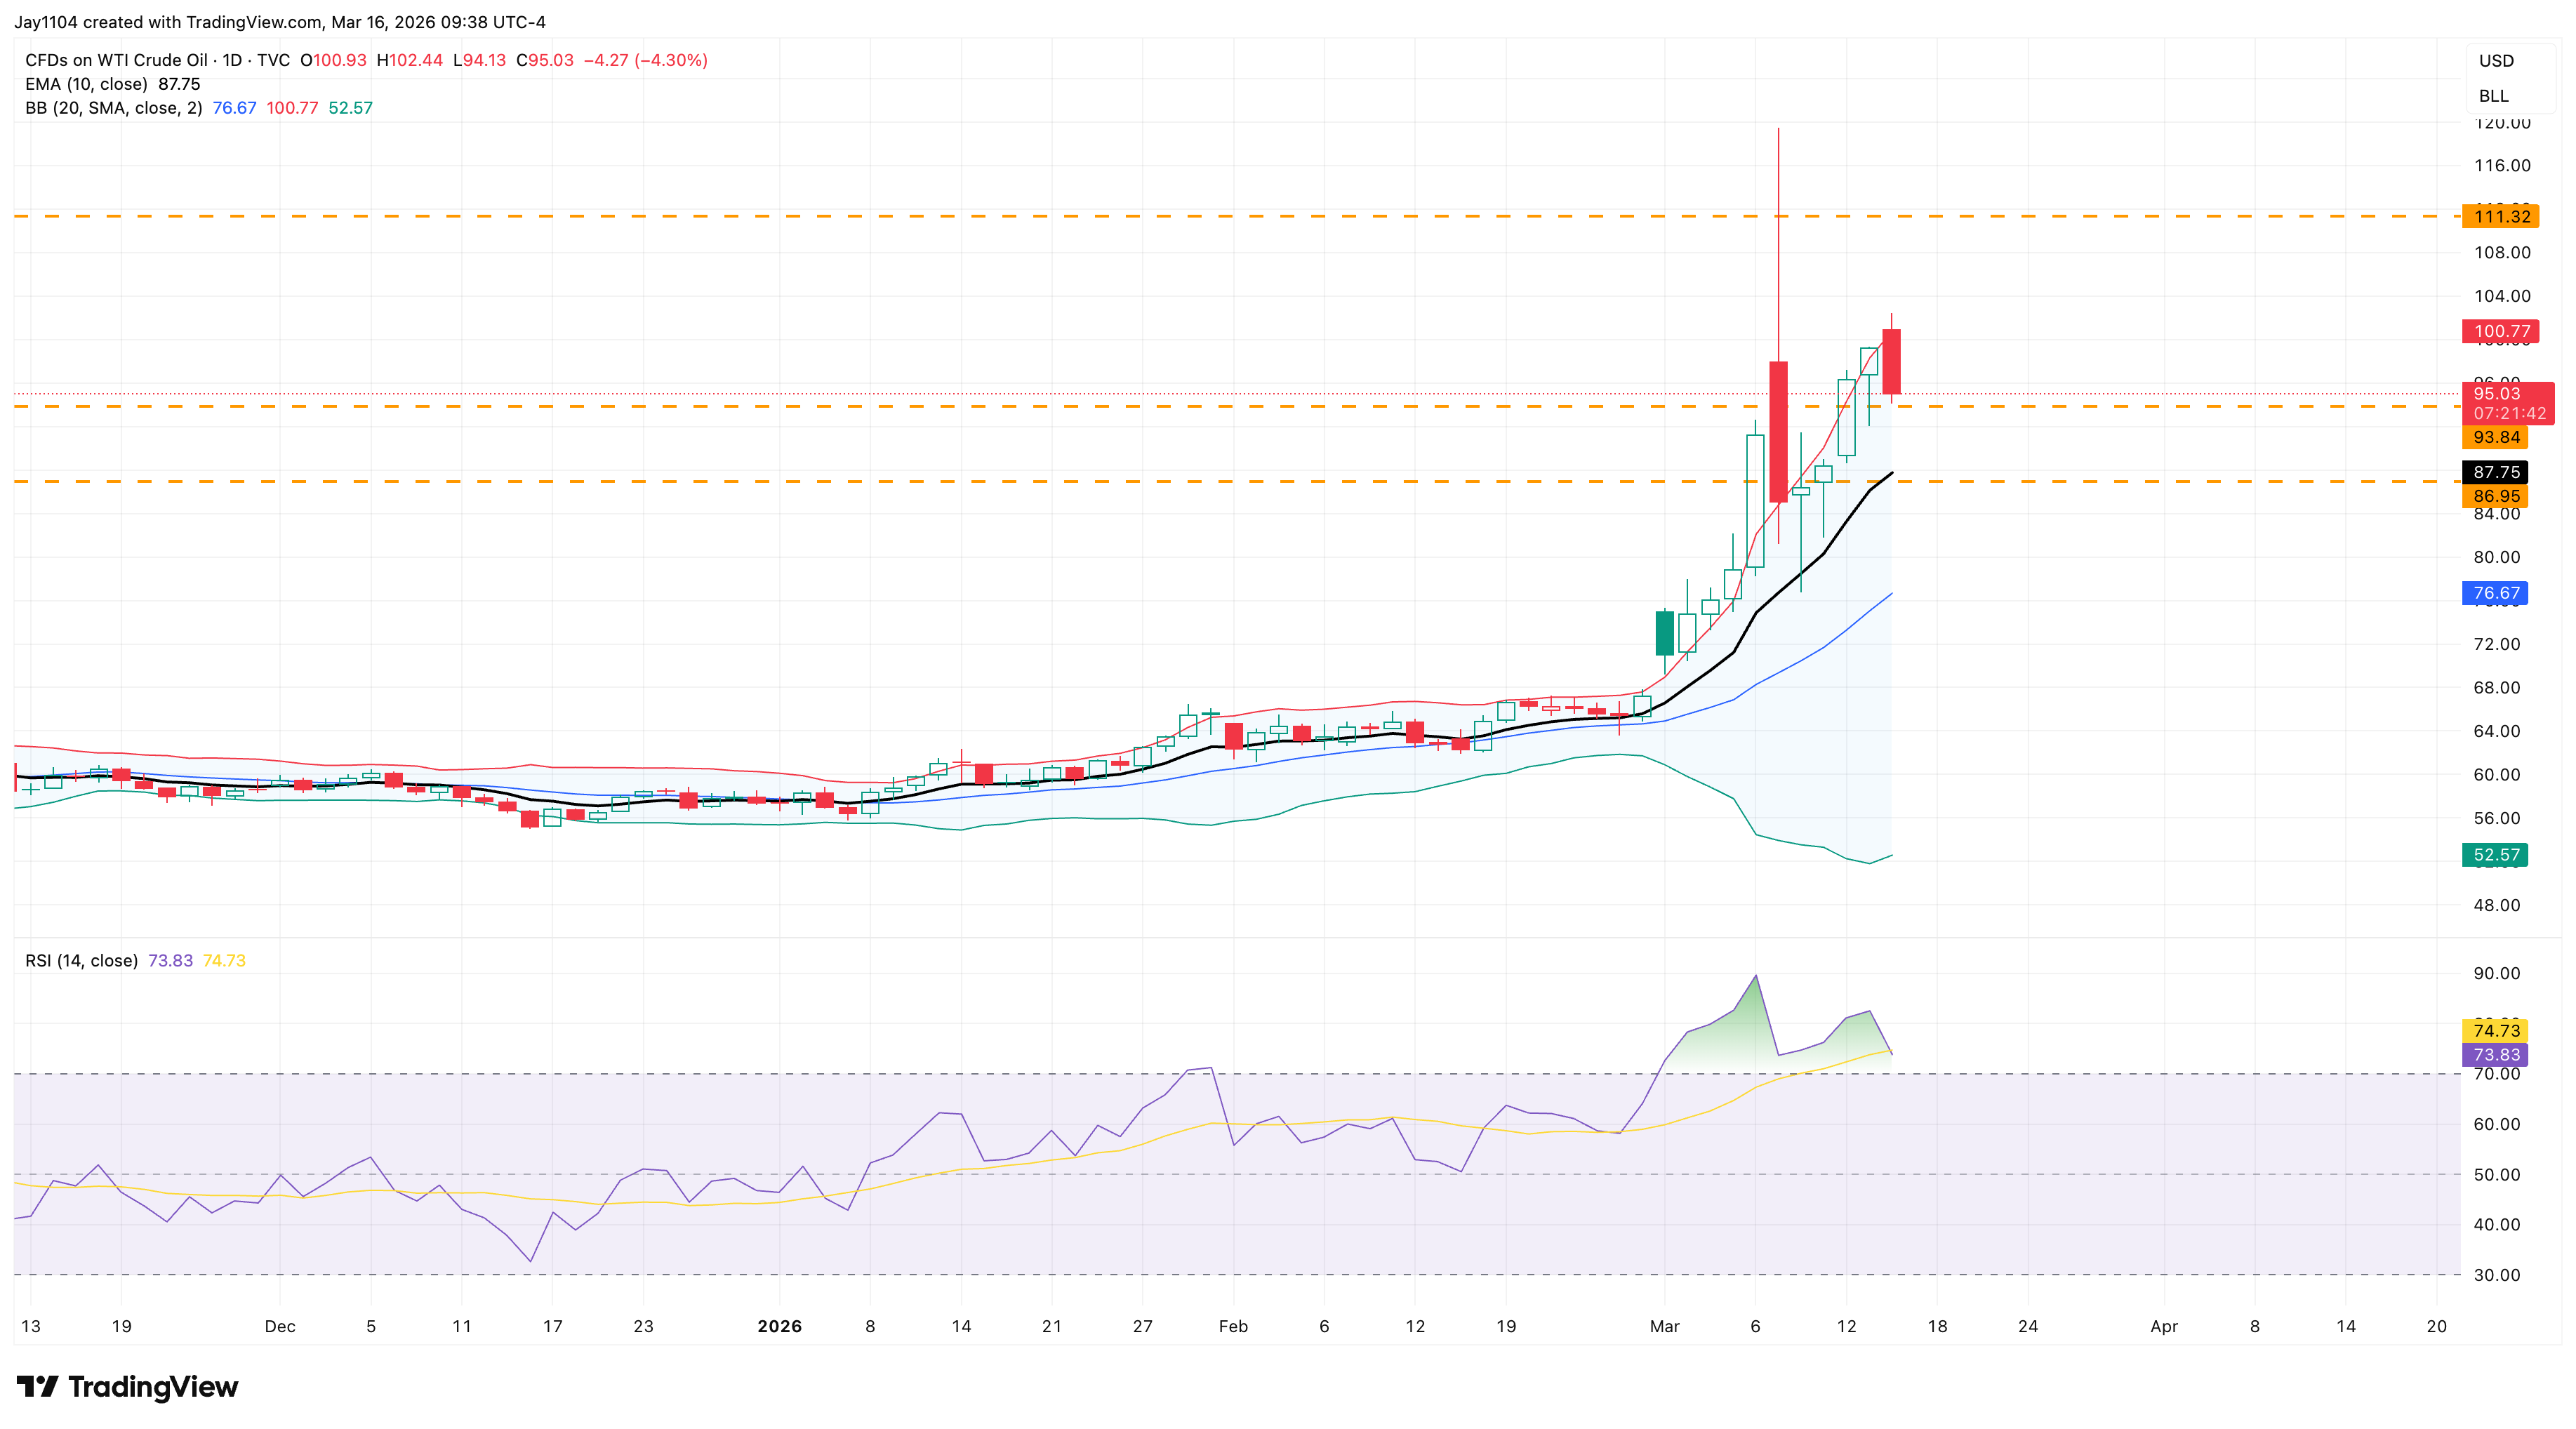
Key support zone around $94
Although oil prices declined by nearly 5% in early trading on 16 March, the price remains above a key support region between $94 and $94.50. This level has acted as both support and resistance since October 2022.
A move below $94 would signal a potential test of the 10-day exponential moving average, which has held firmly since the recent commodities breakout.
10-day EMA could be the decisive test
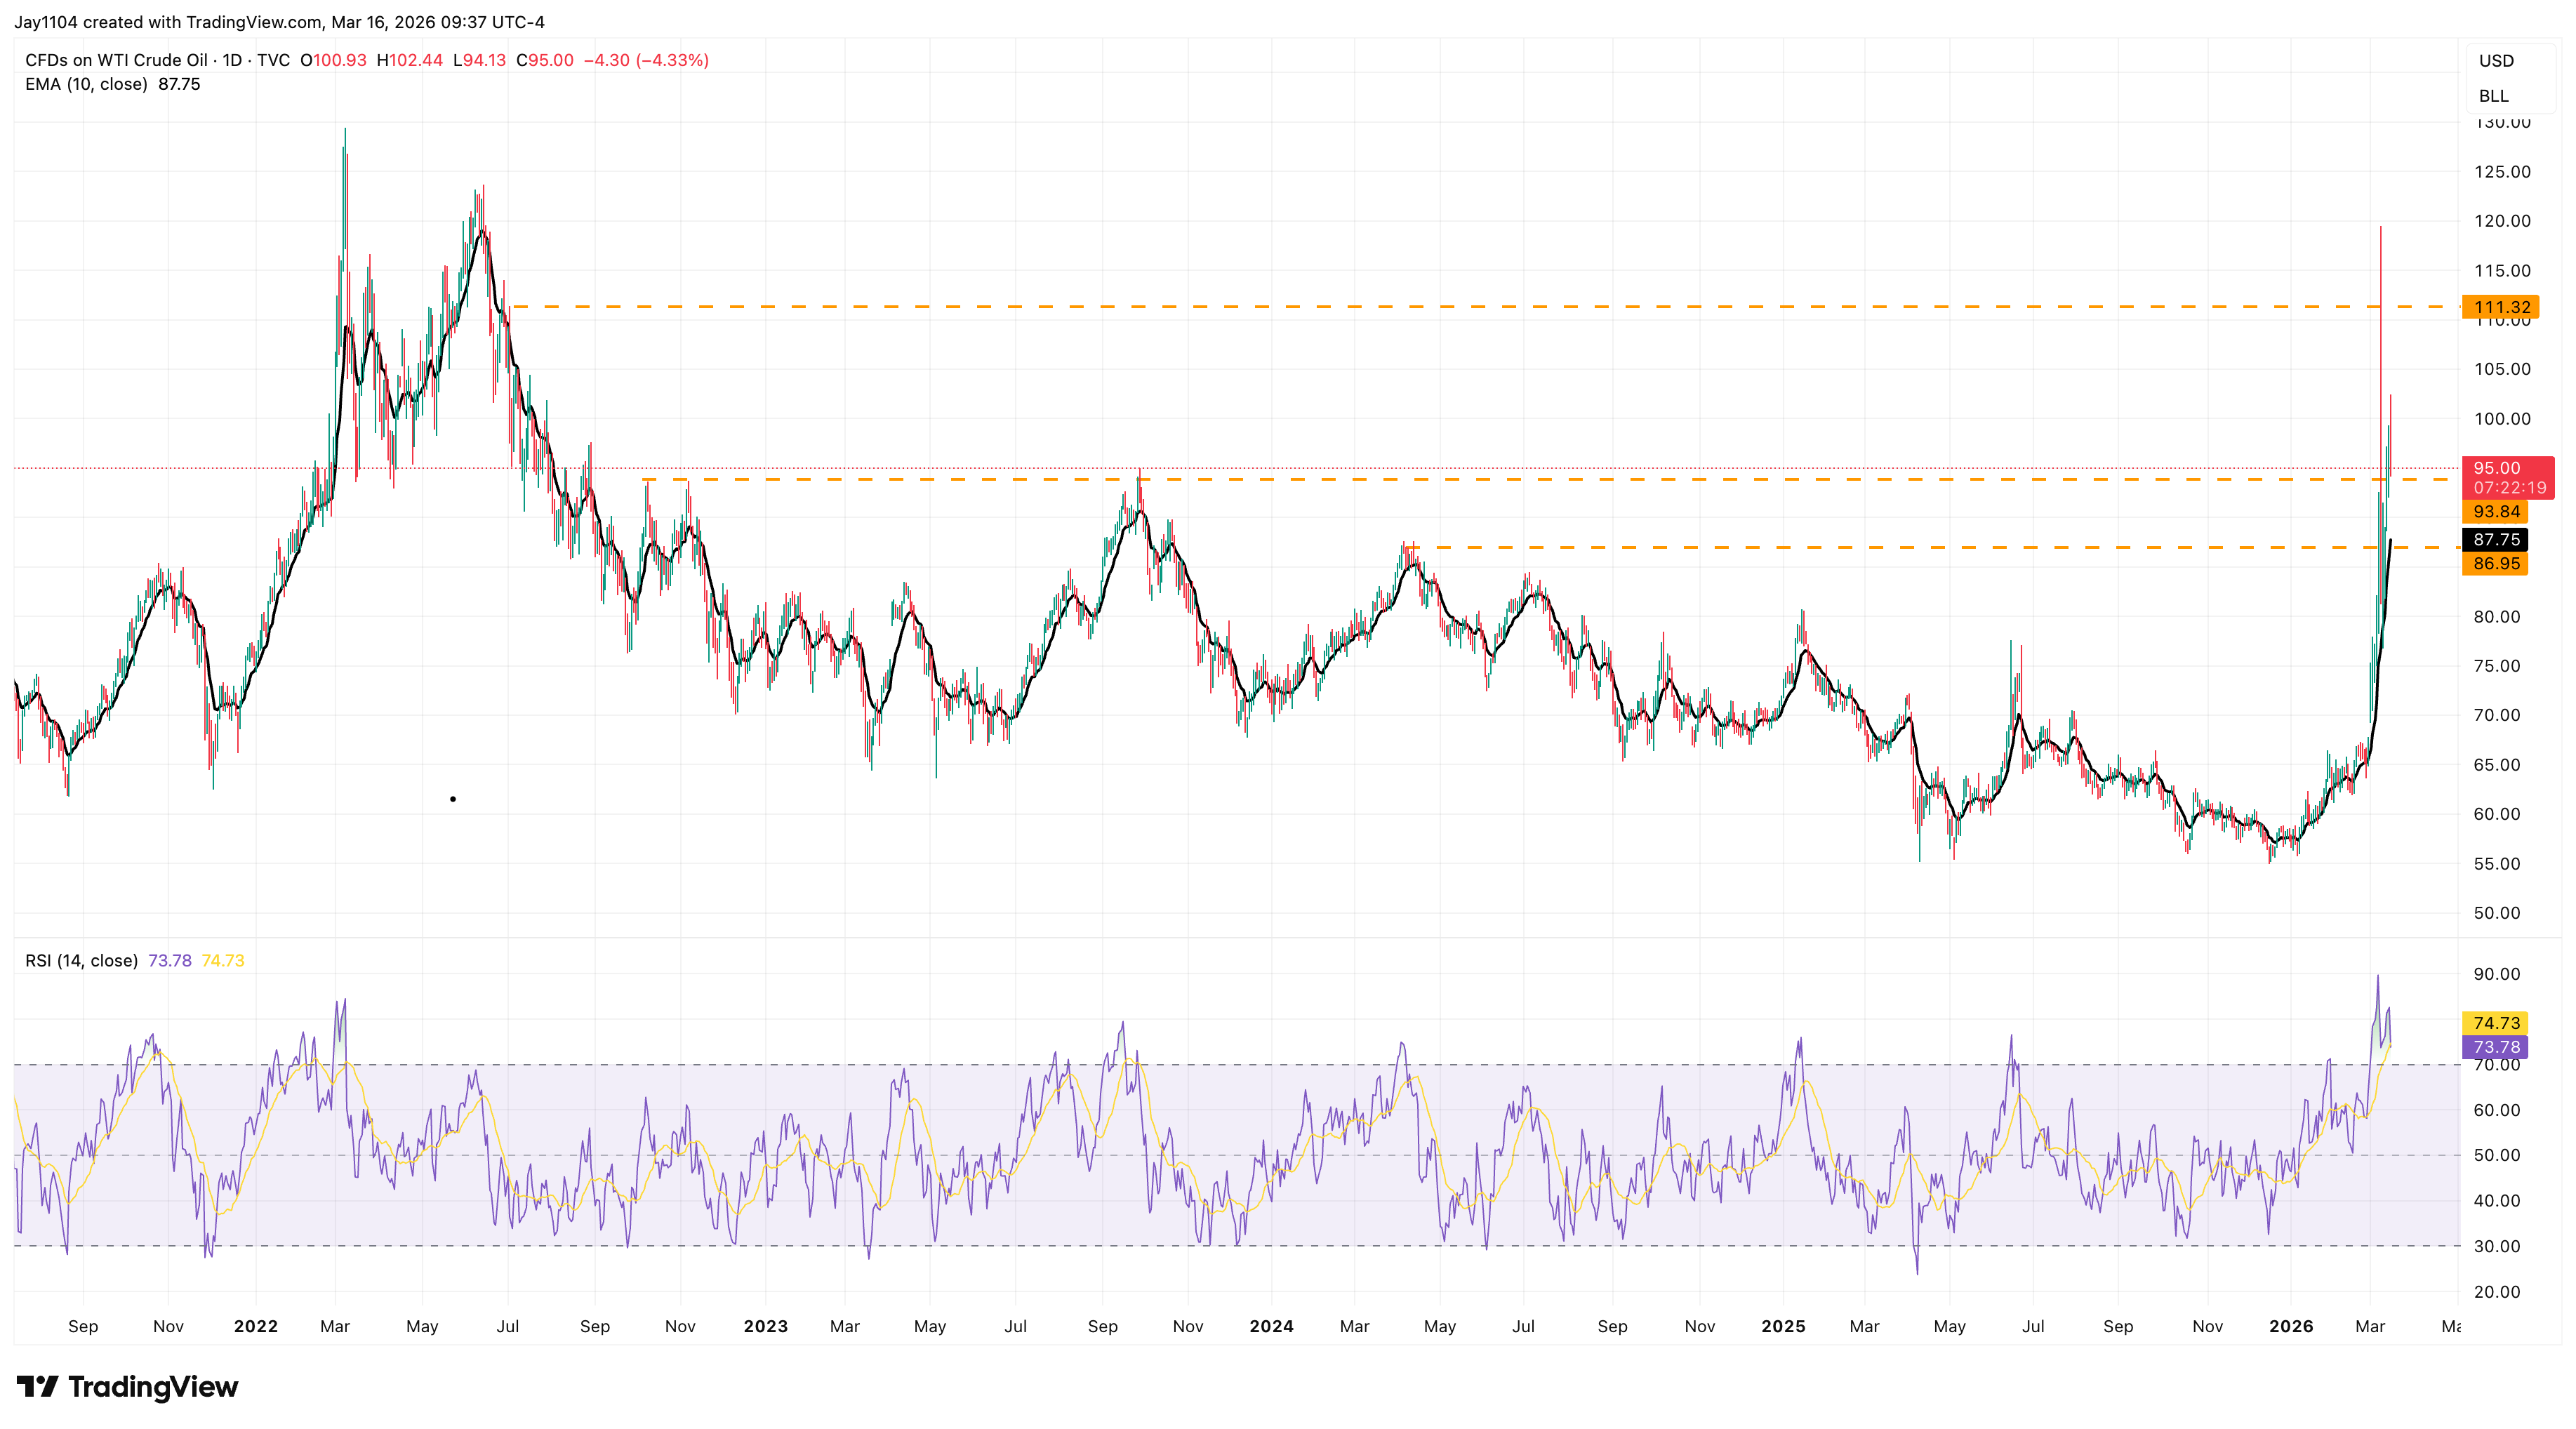
The more significant test of oil’s rally is likely to occur at the 10-day exponential moving average. WTI has not traded below this level since mid-February.
More importantly, the 10-day exponential moving average intersects with another support level around $87.75, which dates back to April 2024.
A break below both this support level and the moving average could lead to a retest of the 20-day simple moving average (SMA). That level currently sits at around $76.70 and would place oil roughly in the middle of the upper and lower Bollinger Bands.
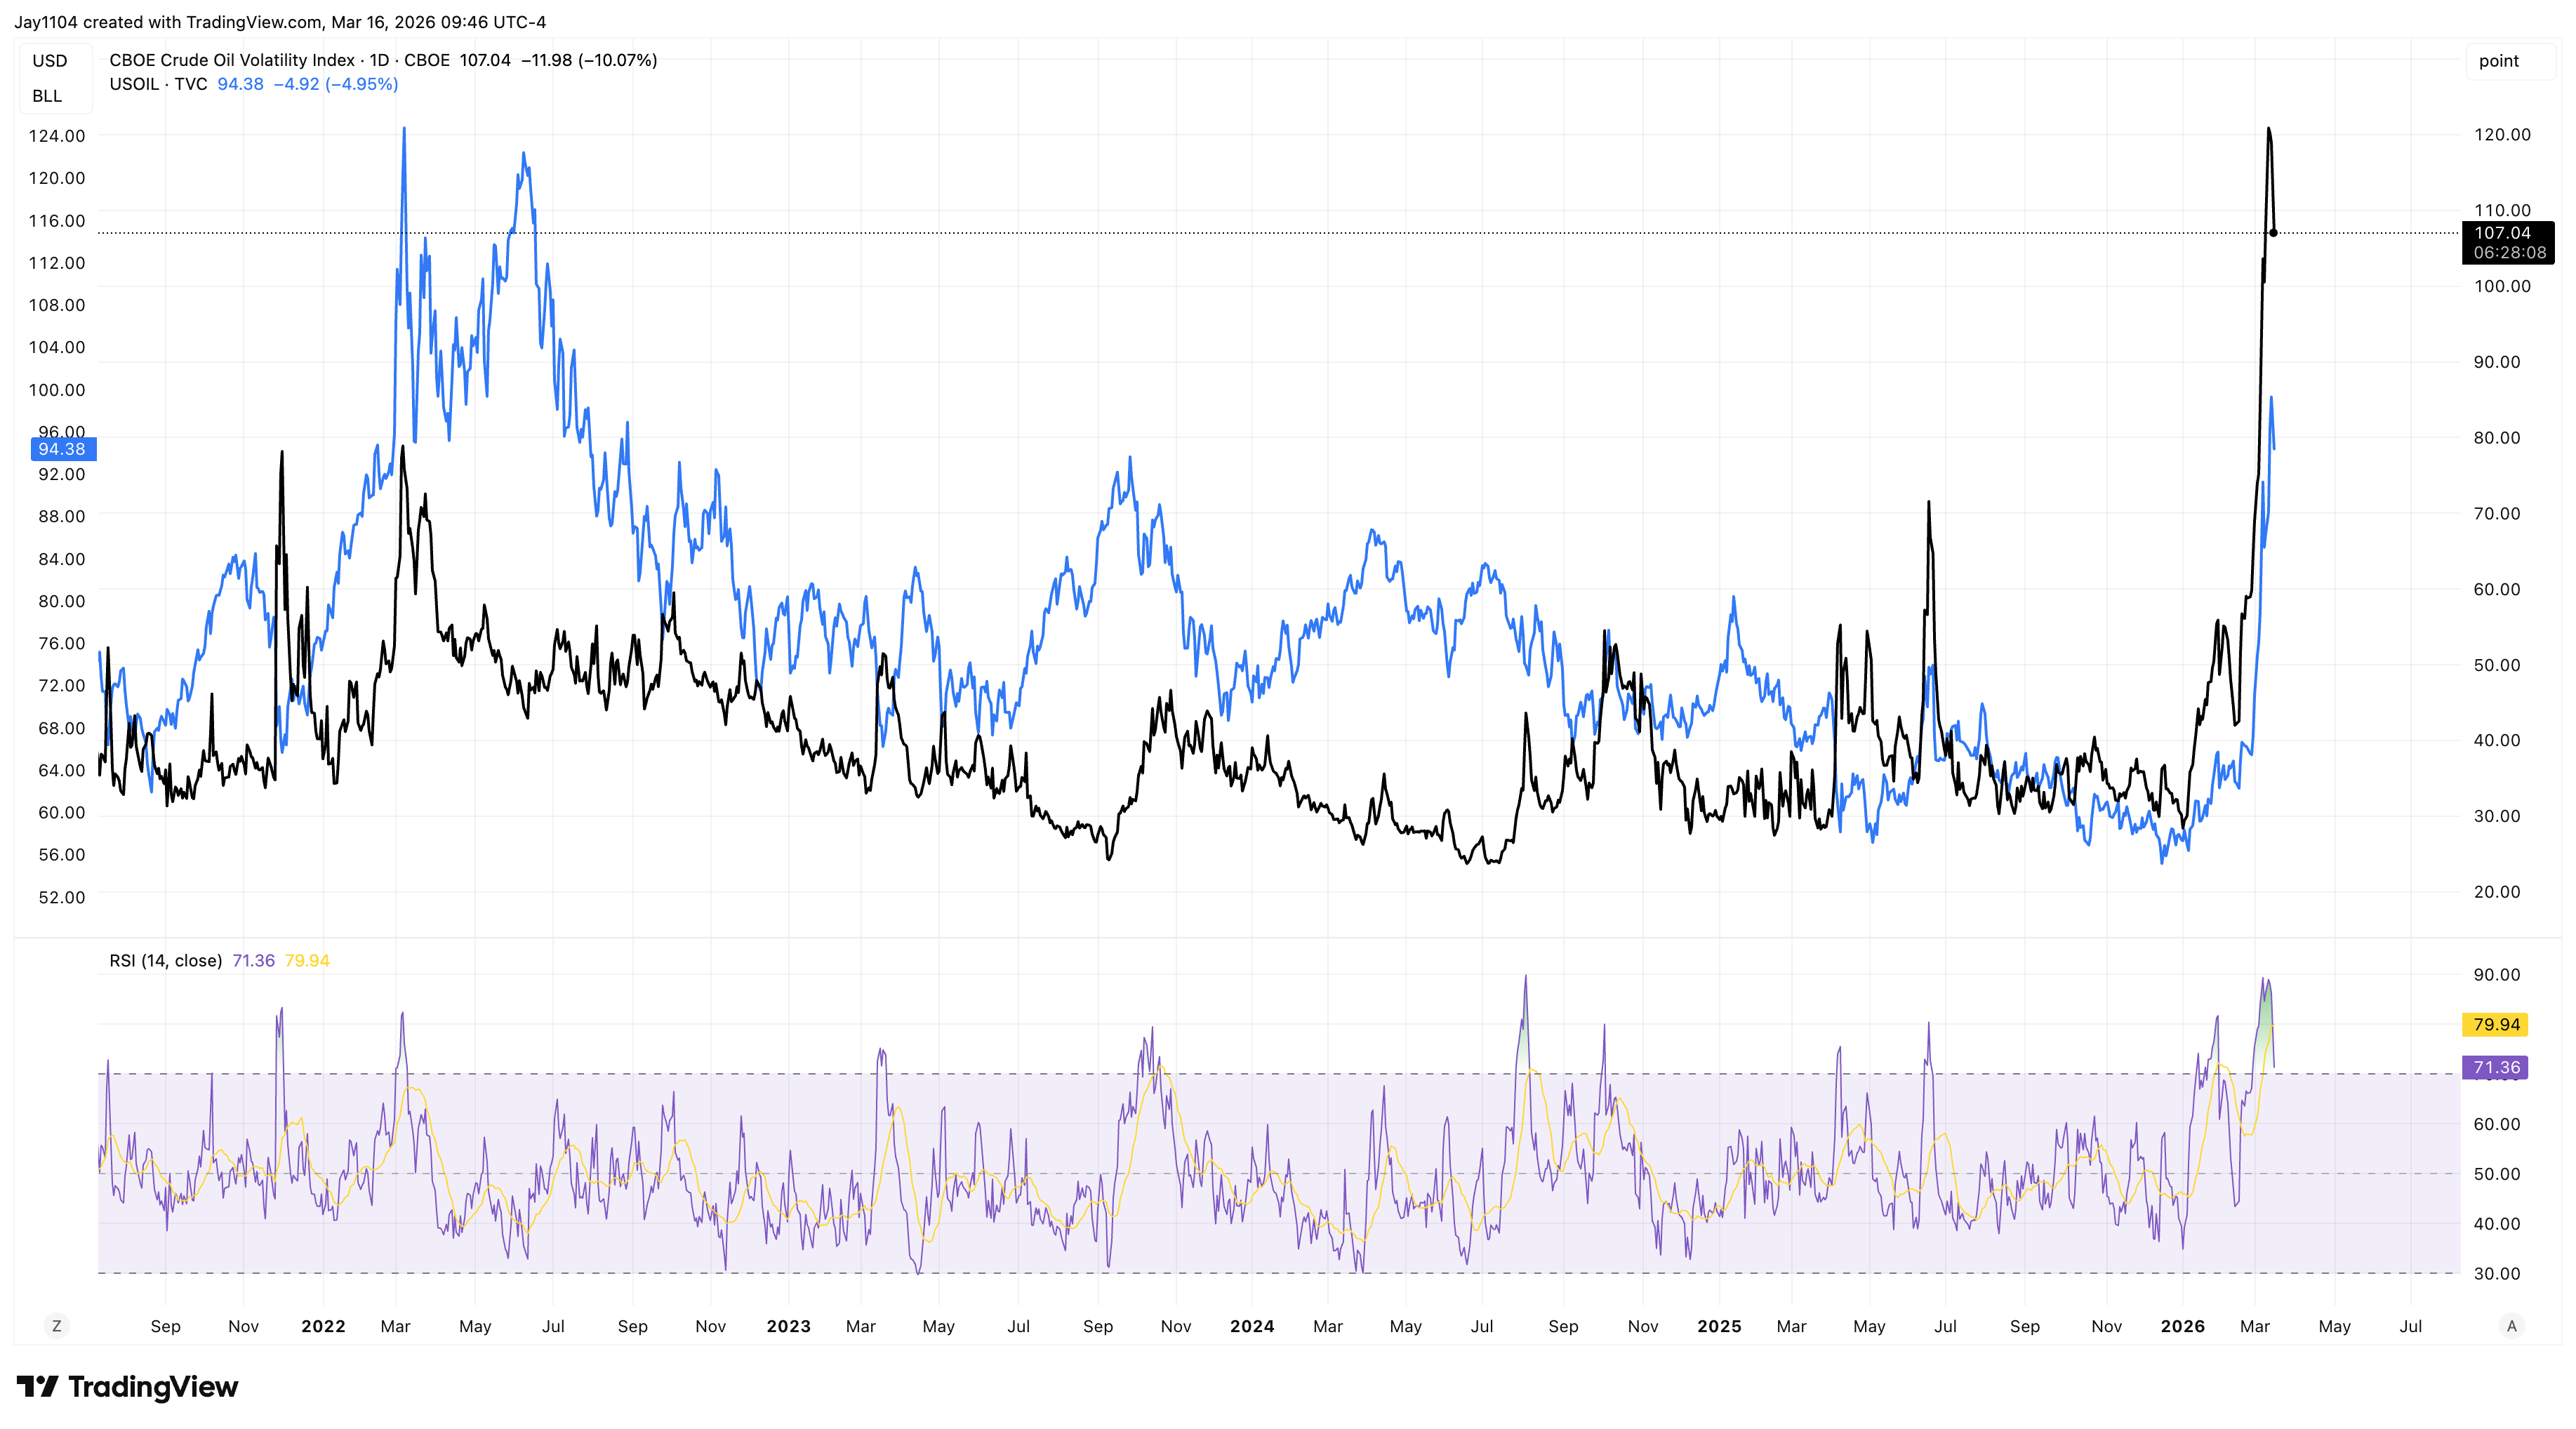
Volatility surge signals heightened market stress
Implied volatility for oil, as measured by the CBOE Crude Oil Volatility Index (OVX), has surged above 100. Historically, periods of heightened geopolitical tension have pushed both oil prices and implied volatility higher. One example occurred in early 2022 when Russia invaded Ukraine.
If implied volatility begins to decline, it could indicate that some of the initial market jitters are fading. While that would not necessarily imply lower oil prices, it could suggest that the market is settling into a trend with smaller and more stable price movements.

Iran war among the biggest geopolitical shocks in 50 years
The conflict involving Iran has pushed the Geopolitical Risk Index (GPR) to levels only seen during the most severe geopolitical crises of the past half century. While equities have remained resilient so far, the duration of the conflict will likely determine whether markets can maintain that strength.

The Week Ahead: Micron earnings; Fed, BoE rate decisions; UK labour market data
Welcome to Michael Kramer’s pick of the key market events to look out for in the week beginning Monday 16 March.

G7 weighs historic strategic oil reserve release
The G7 is considering an unprecedented release of strategic oil reserves as the risk of a prolonged Strait of Hormuz blockade intensifies. Markets are watching closely as volatility surges and key energy reports this week could shape expectations for prices and supply.