Loading...
Loading...
Gold's latest rally has started to run out of steam around $4,450, with the 200-day moving average near $4,510 acting as potential resistance. Support around $4,320 and $4,000 remains critical, while rising real yields are adding a fundamental headwind.

Founder, Mott Capital Management
Gold's rally has recently run out of steam, stalling around $4,450 and facing multiple challenges from both technical and fundamental standpoints.
Those headwinds may lead to a reversal lower and a push back towards $4,000.
Gold's 200-day simple moving average sits just above the current price action, near $4,510, and is likely to act as a strong technical resistance level.
While it is possible for the 200-day moving average to rise a little further, it is more likely that, sooner rather than later, it will start to turn lower, given the sharp decline that gold witnessed starting in March. However, if gold breaks through the 200-day moving average, it could extend towards $4,600 and perhaps $4,765.
Meanwhile, the 10-day exponential moving average has been acting as a support region around $4,320, coinciding with a support-resistance zone at $4,325 since the end of March.
Should that support level break, it is likely to lead to gold prices falling back to the more important support level at $4,000.
Gold - Cash, December 2025 – present
Source: TradingView, 17 August 2026
More recently, gold has faced a fundamental headwind in the form of rising real yields, which are the difference between nominal rates and inflation expectations.
Rising real yields tend to have an inverse relationship with gold over time. The iShares TIPS Bond ETF (TIP) has tracked gold well recently, and declines in TIP indicate that real yields are rising. While this is not a perfect indicator, it provides a reasonable gauge that should be watched closely over time, especially if the two diverge, as they have more recently.
Gold and iShares TIPS Bond ETF, September 2025 – present
Source: TradingView, 17 August 2026

The deterioration in the US fiscal position is keeping pressure on long-term interest rates and the US dollar. Gold is using that backdrop to break above its July highs, reviving the debasement trade narrative.
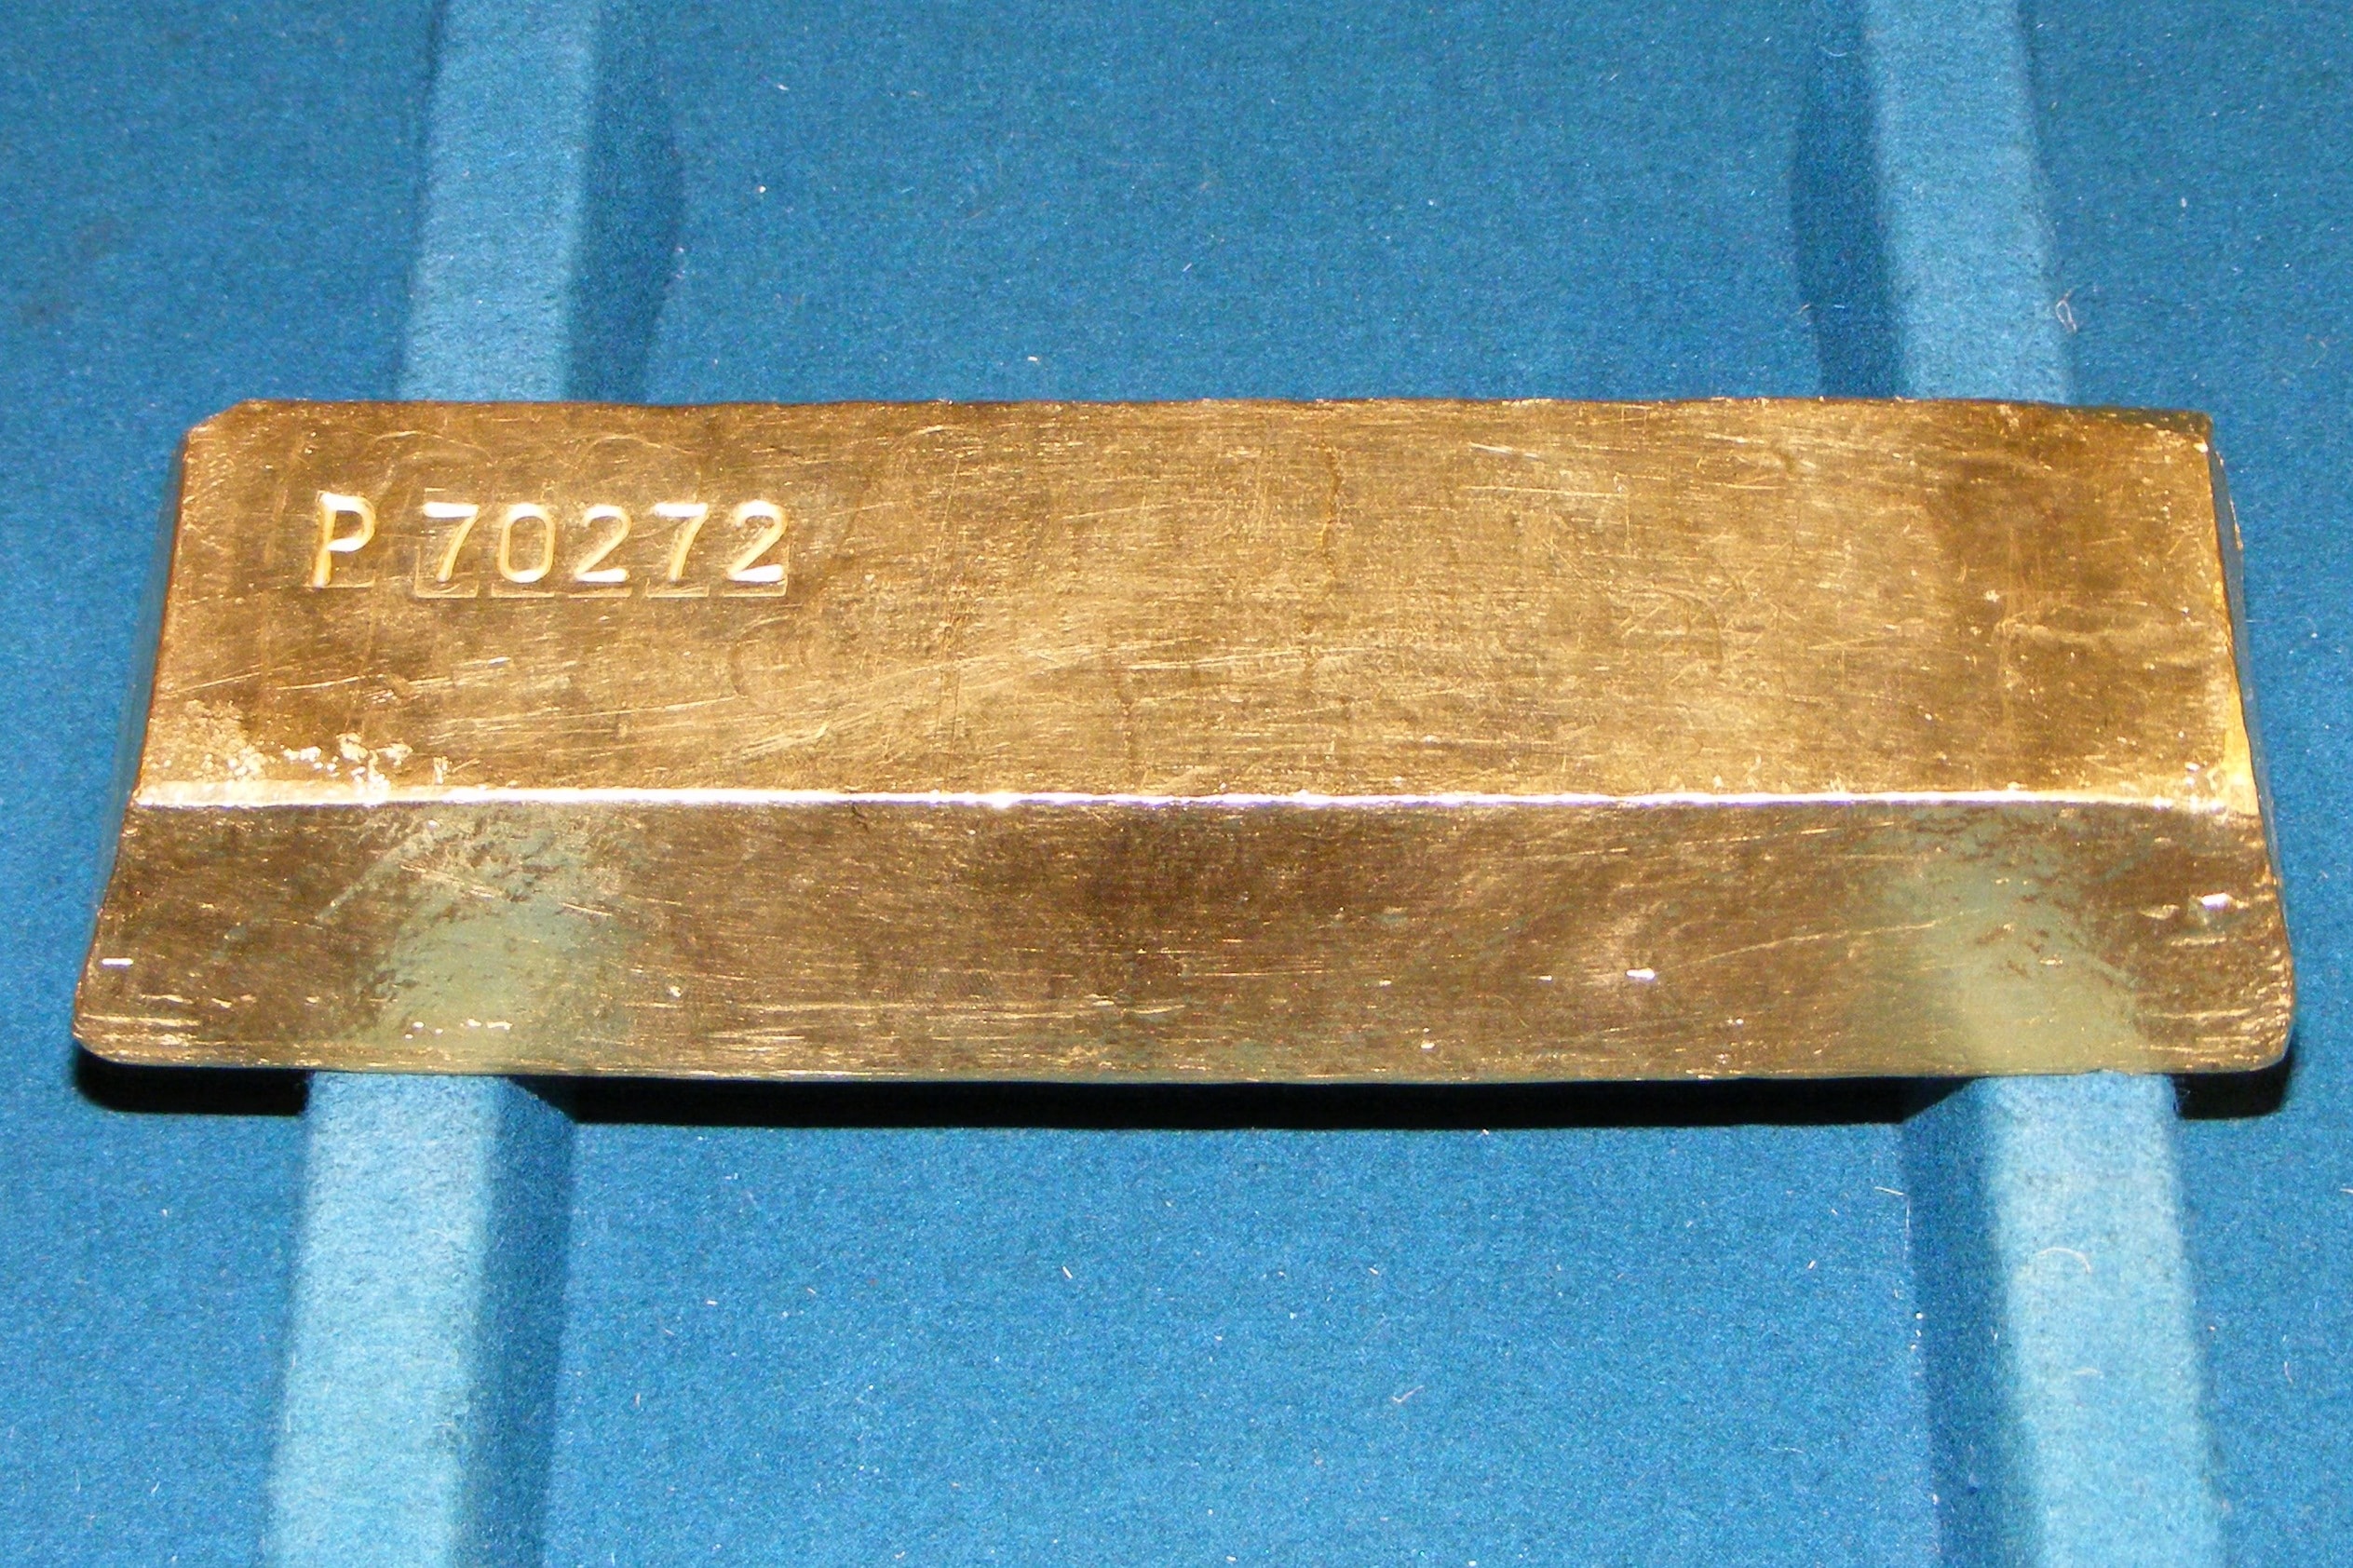
Gold is retesting its downtrend near $4,130 after months of consolidation. A breakout could revive upside momentum, but support around $4,000 and dollar-driven headwinds remain critical.

Silver has rallied sharply in August and is now approaching a key technical resistance area. Bollinger Bands, RSI momentum and Fibonacci retracement levels suggest the next move could hinge on whether silver can extend towards $69.50 and $72, or fall back below support near $62.