Loading...
Loading...
The deterioration in the US fiscal position is keeping pressure on long-term interest rates and the US dollar. Gold is using that backdrop to break above its July highs, reviving the debasement trade narrative.

Market Analyst
Precious metals are showing renewed strength. Platinum, palladium and gold are consolidating above their July highs on daily charts. Silver is the exception, still testing those same levels.
The sector is starting to break above the upper end of the sideways range developed over recent weeks, where bullish divergences had been building in technical oscillators. That increases the probability that a base may be forming.
Against this backdrop, a mean-reversion move is gaining traction, allowing precious metals to recover part of the ground lost during a difficult first half of the year, when corrections from record highs exceeded 50% in some cases.
Gold, daily chart with RSI (14)
Source: TradingView, 6 August 2026
Gold and silver are real assets whose appeal tends to increase when investors fear a loss of purchasing power in fiat currencies. The narrative that has driven their multi-year uptrend rests on the so-called debasement trade, or the search for protection against monetary devaluation.
High debt levels, fiscal deficits, monetary expansion and persistently elevated inflation are the pillars of this narrative. Recent developments are reinforcing it.
The US Treasury raised its borrowing estimate for the third quarter of 2026 to $739bn, $68bn more than forecast in May. This increased call on the market suggests the Congressional Budget Office's 2026 deficit estimate of $1.9tn, or 5.8%-6.0% of GDP, could prove too low.
The rise in long-dated yields, which reflects a higher term premium, has pushed the US Treasury to concentrate funding in shorter maturities in an effort to contain debt-servicing costs.
To do so, it will keep issuance sizes for medium- and long-dated bonds, from two to 30 years, stable while financing excess spending through heavy Treasury bill issuance. This strategy can absorb liquidity from money-market funds and the reverse repo facility without putting additional pressure on long-term rates, although it significantly reduces the average maturity of public debt.
The result is greater dependence on continuous refinancing at current interest-rate levels. Despite the concentration in short maturities, debt interest costs continue to rise relative to GDP and tax receipts, feeding the familiar snowball effect in the deficit and public debt.
US yield curve, last three months
Source: TradingView, 6 August 2026
This fiscal backdrop helps explain the actions of the main US economic policymakers. The so-called TACO trade tends to re-emerge when Treasury yields rise sharply. Along those lines, Treasury Secretary Scott Bessent said free transit through the Strait of Hormuz would be guaranteed, an attempt to contain oil prices and moderate inflation expectations.
At the latest FOMC meeting, Kevin Warsh softened his hawkish tone and kept the policy rate in the 3.50%-3.75% range. Some investors interpreted that message as a sign that the Federal Reserve is less willing to tighten monetary policy in the short term. In a context of high deficits and rising financing needs, that perception encourages investors to demand a higher risk premium at the long end of the curve and keeps downward pressure on the US dollar.

ADP, Challenger and NFP data arrive this week with the US labour market back in low hire-low fire mode. A stronger jobs surprise could support the US dollar, while a weak print may ease pressure on gold and bitcoin.
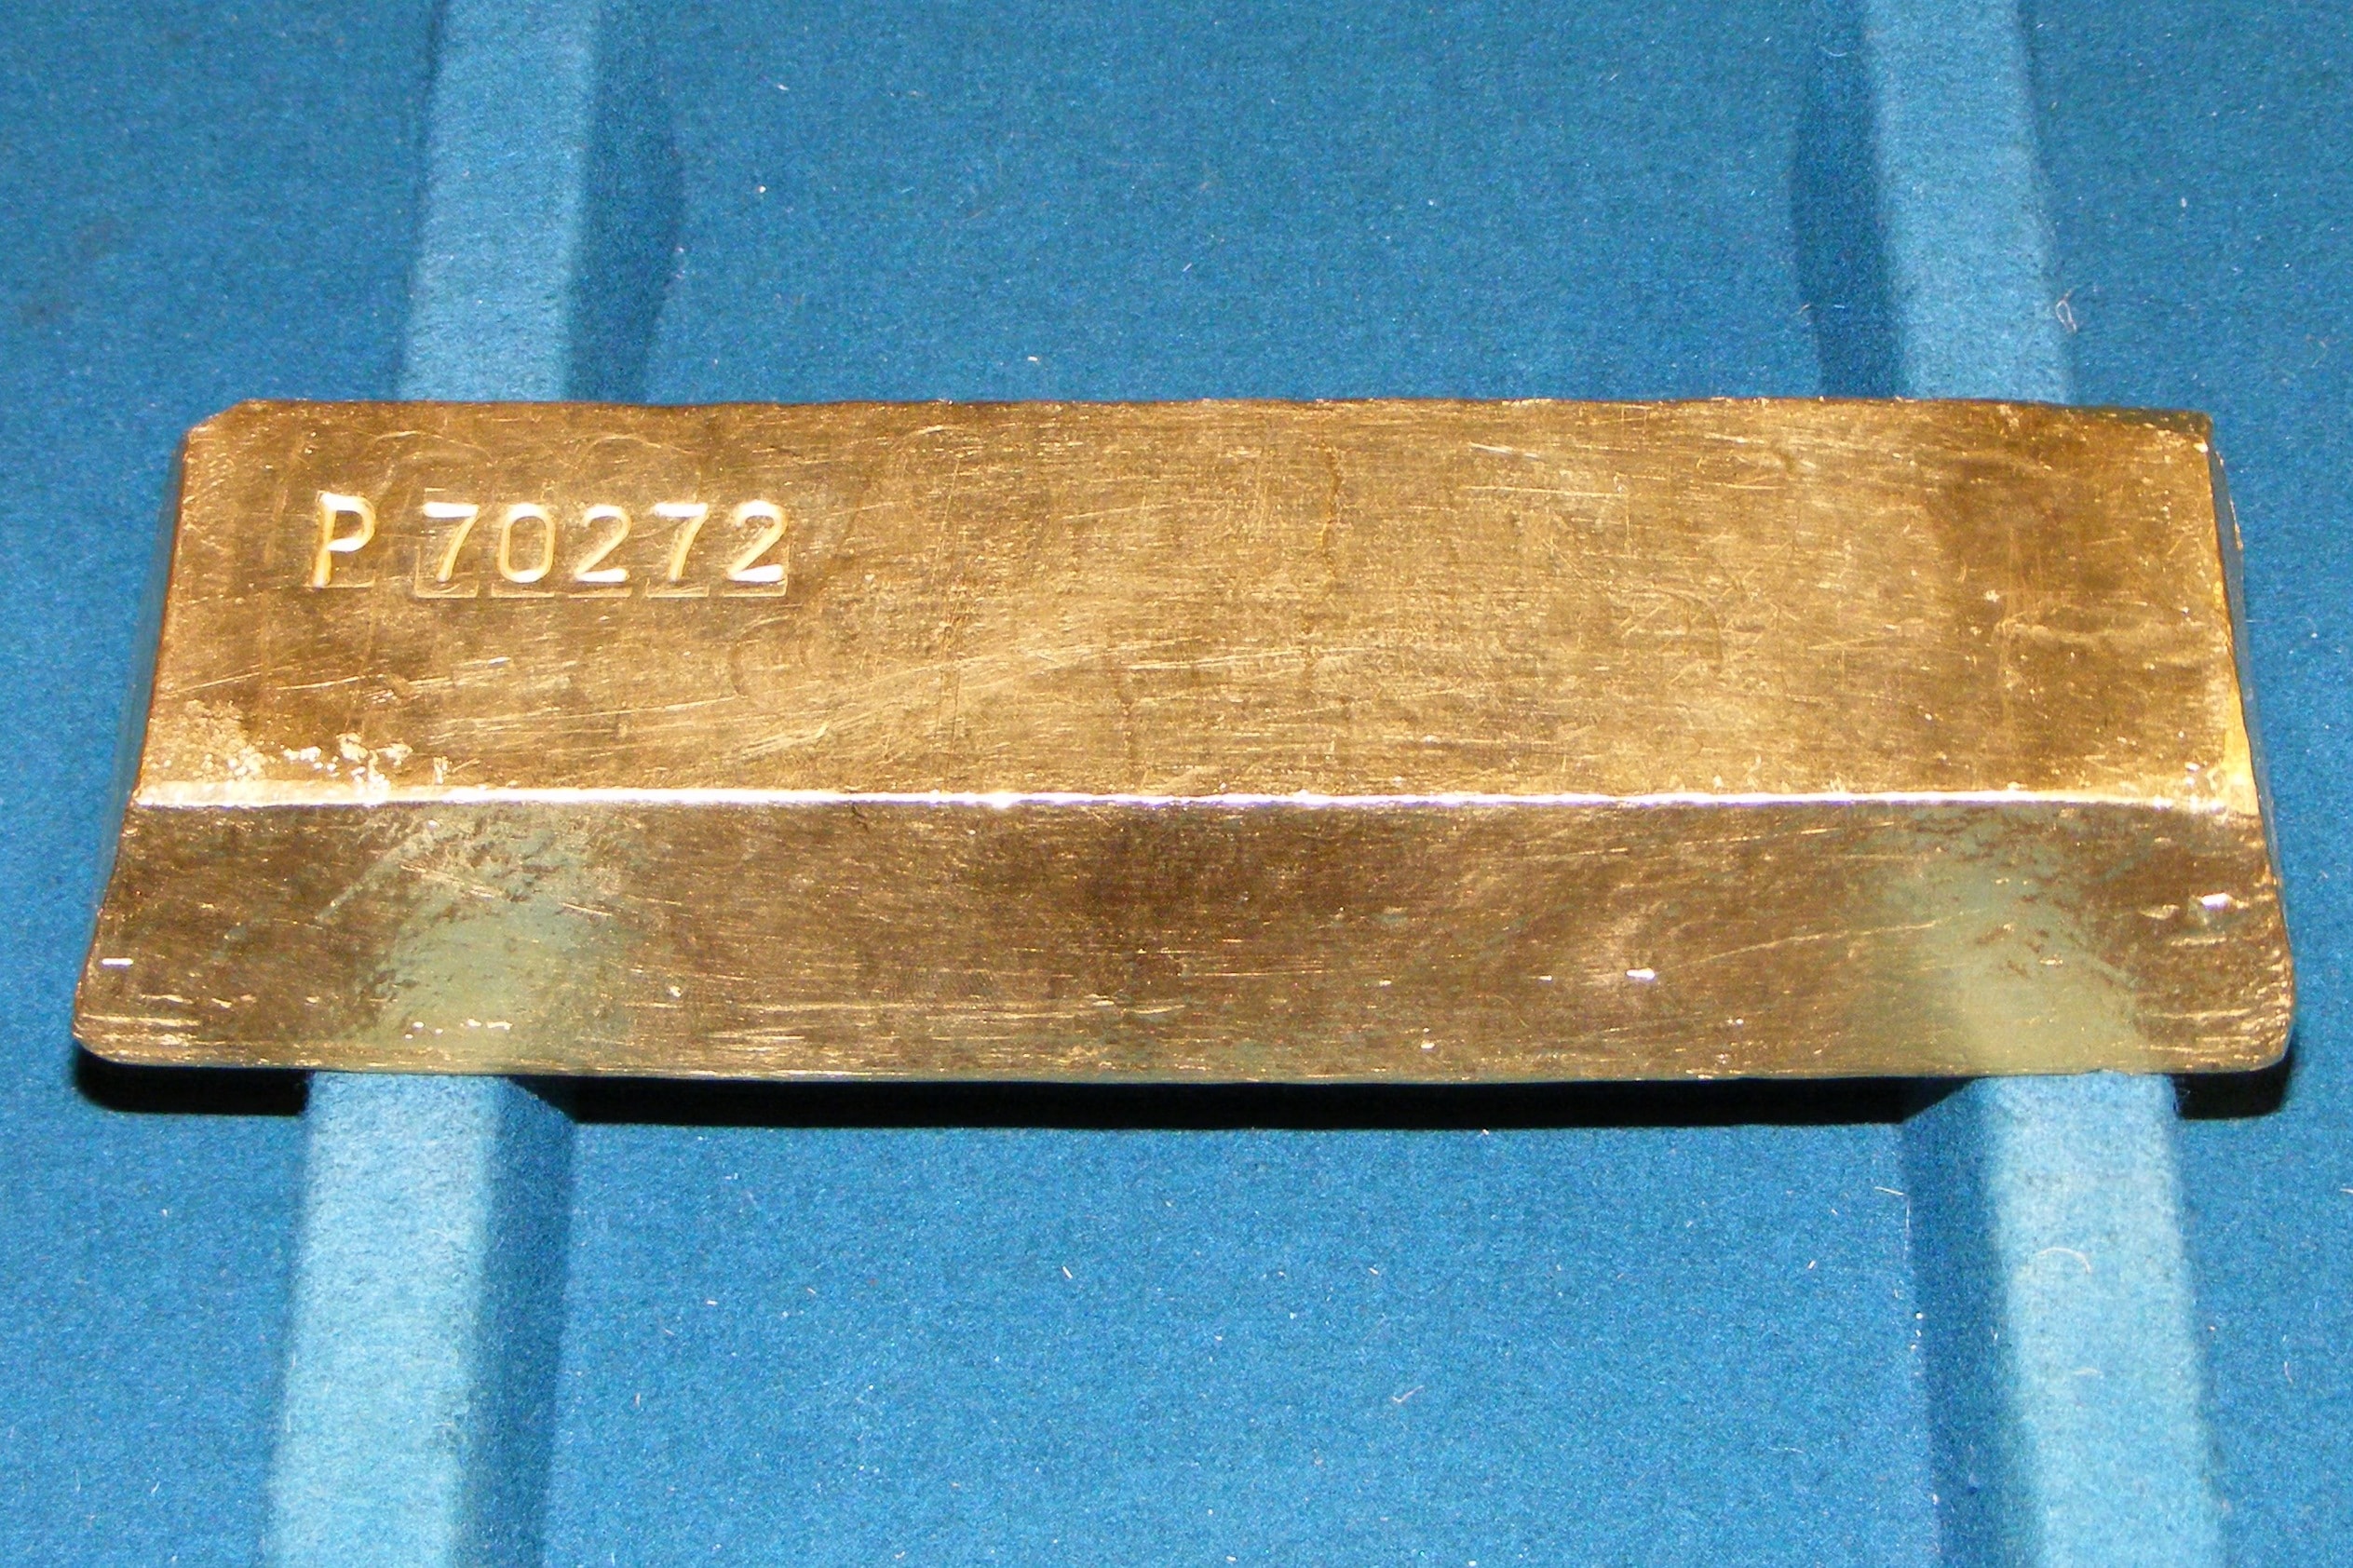
Gold is retesting its downtrend near $4,130 after months of consolidation. A breakout could revive upside momentum, but support around $4,000 and dollar-driven headwinds remain critical.

EUR/USD has extended its recovery after weaker-than-expected US ADP employment data and is testing resistance around $1.155. A confirmed breakout could put $1.161 and the 200-day moving average near $1.163 in focus, although the 7 August US employment report remains the main risk.