Charting features
SCAN THIS QR CODE
TO DOWNLOAD THE APP

ForexBrokers.com Awards
Good Money Guide Awards
ADVFN International Financial Awards
Technical analysis
Our fully-integrated technical analysis suite has been developed in-house and incorporated into our charting package, to deliver all the tools you need to analyze the financial markets.

Our top charting features
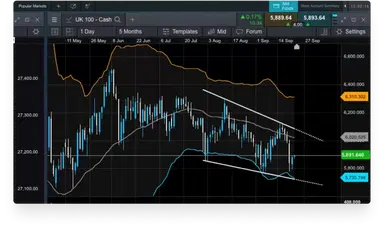
All our charts include a range of drawing tools that can be used to draw support and resistance levels, make notes on charts, and highlight key price moves and patterns.
Analyze price performance over the short- and long-term, with our charts for our major instruments covering up to 20 years' price history.
You can quickly switch between chart intervals, which range from one second through to one month.
Our layouts, charts and technical indicators are all customizable, offering you the ability to set up charts and technical analysis to suit your own style.
Identify correlated instruments by dragging and dropping one or more instrument on to another open chart to compare their price action and performance over the same timeframe.
Once you've customized a chart, save the setup as default, so that each time you load a new chart the same preferences are applied to it. You can save up to five charts per instrument.
Open trades directly from charts as opportunities emerge – just select a live streaming price to open an order ticket and place a trade. You can also modify or close any pending orders.
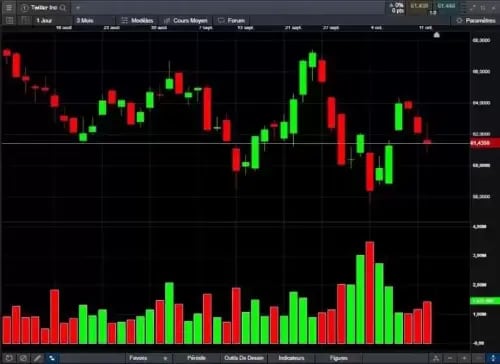
Volume on charting
Identify price momentum and confirm the existence or continuation of a trend by examining the volume-traded levels in parallel with price movements in real time. You can also look back at historical volume levels to identify historical trends and patterns. View our FAQs at the bottom of the page for more details.
Price projection
Available on every chart when logged in to your live account, our pattern recognition tool allows you to search for common technical chart and candle patterns, providing a price projection.
Pattern recognition
Let our pattern recognition tool scan for common technical patterns, such as head and shoulders, triangles and wedges, on any open chart across various time intervals, and view the price projection target area on the chart.
Award-winning CFD broker
ForexBrokers.com Awards
Professional Trader Awards
ADVFN International Financial Awards
Good Money Guide Awards
Module linking
This feature allows you to group charts together, so that when you change the instrument shown in one chart, all of the other charts in the group will automatically update to show the new instrument. This lets you examine the price action for the same instrument over multiple intervals and timeframes at the same time, so you can compare long-term analysis with short. Drawing tools, technical indicators, chart types, patterns and presets are all automatically applied to all charts in the group.
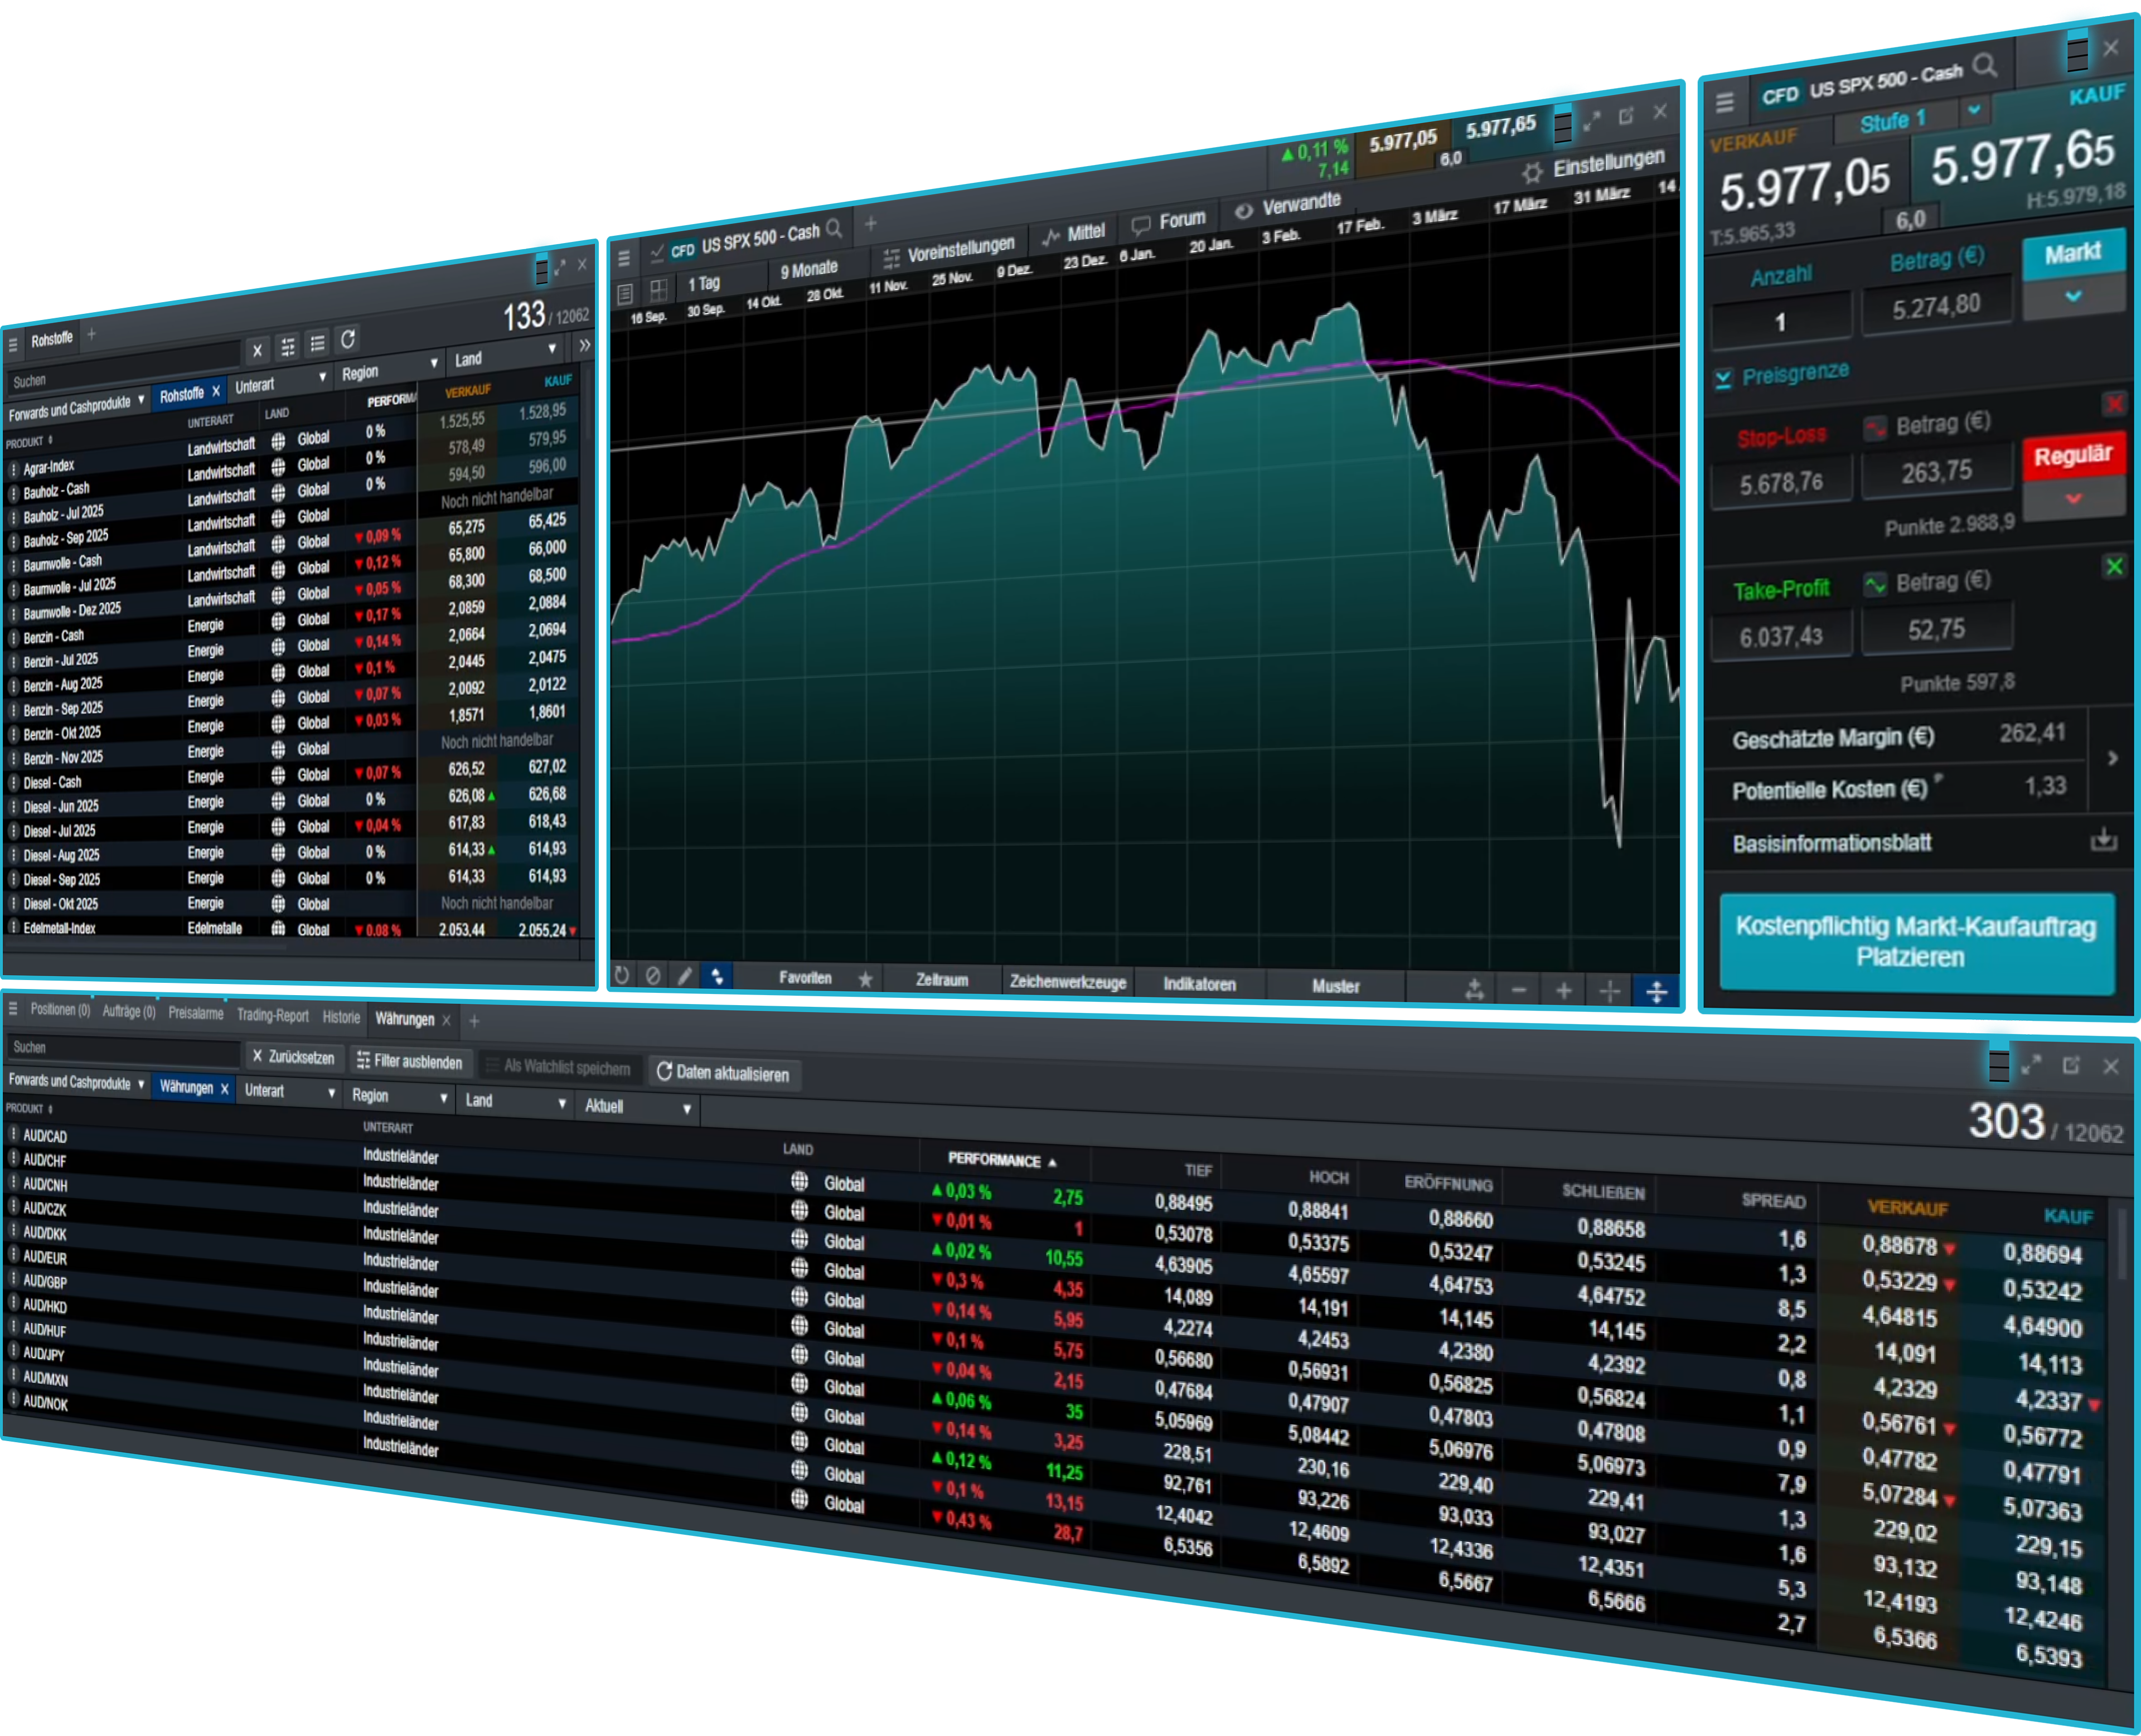
Chart forum community
The chart forum² lets you discuss and share chart analysis, trade set-ups and commentary from our analysts and other CMC Markets traders from within the charts.
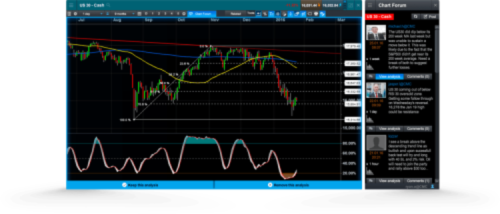
Our global market analysts post insightful technical analysis and comments on popular instruments.
Instantly copy technical analysis from our analysts and other traders directly to your live charts for further research.
Comment on other traders' posts and use the directional arrows to indicate whether you think the market is going to go up or down.
Use the chart forum to take a snapshot of your analysis, so you can look back at your historical posts to see if your trading ideas went as expected.
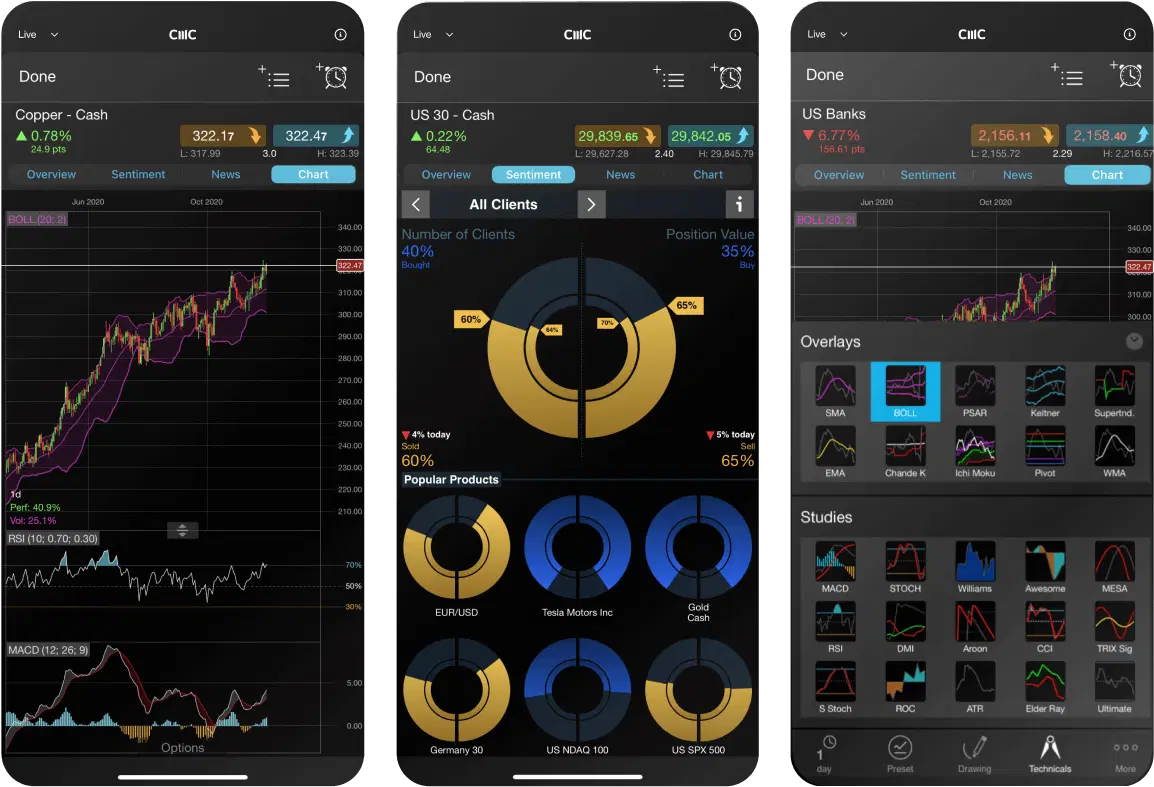
Mobile charting
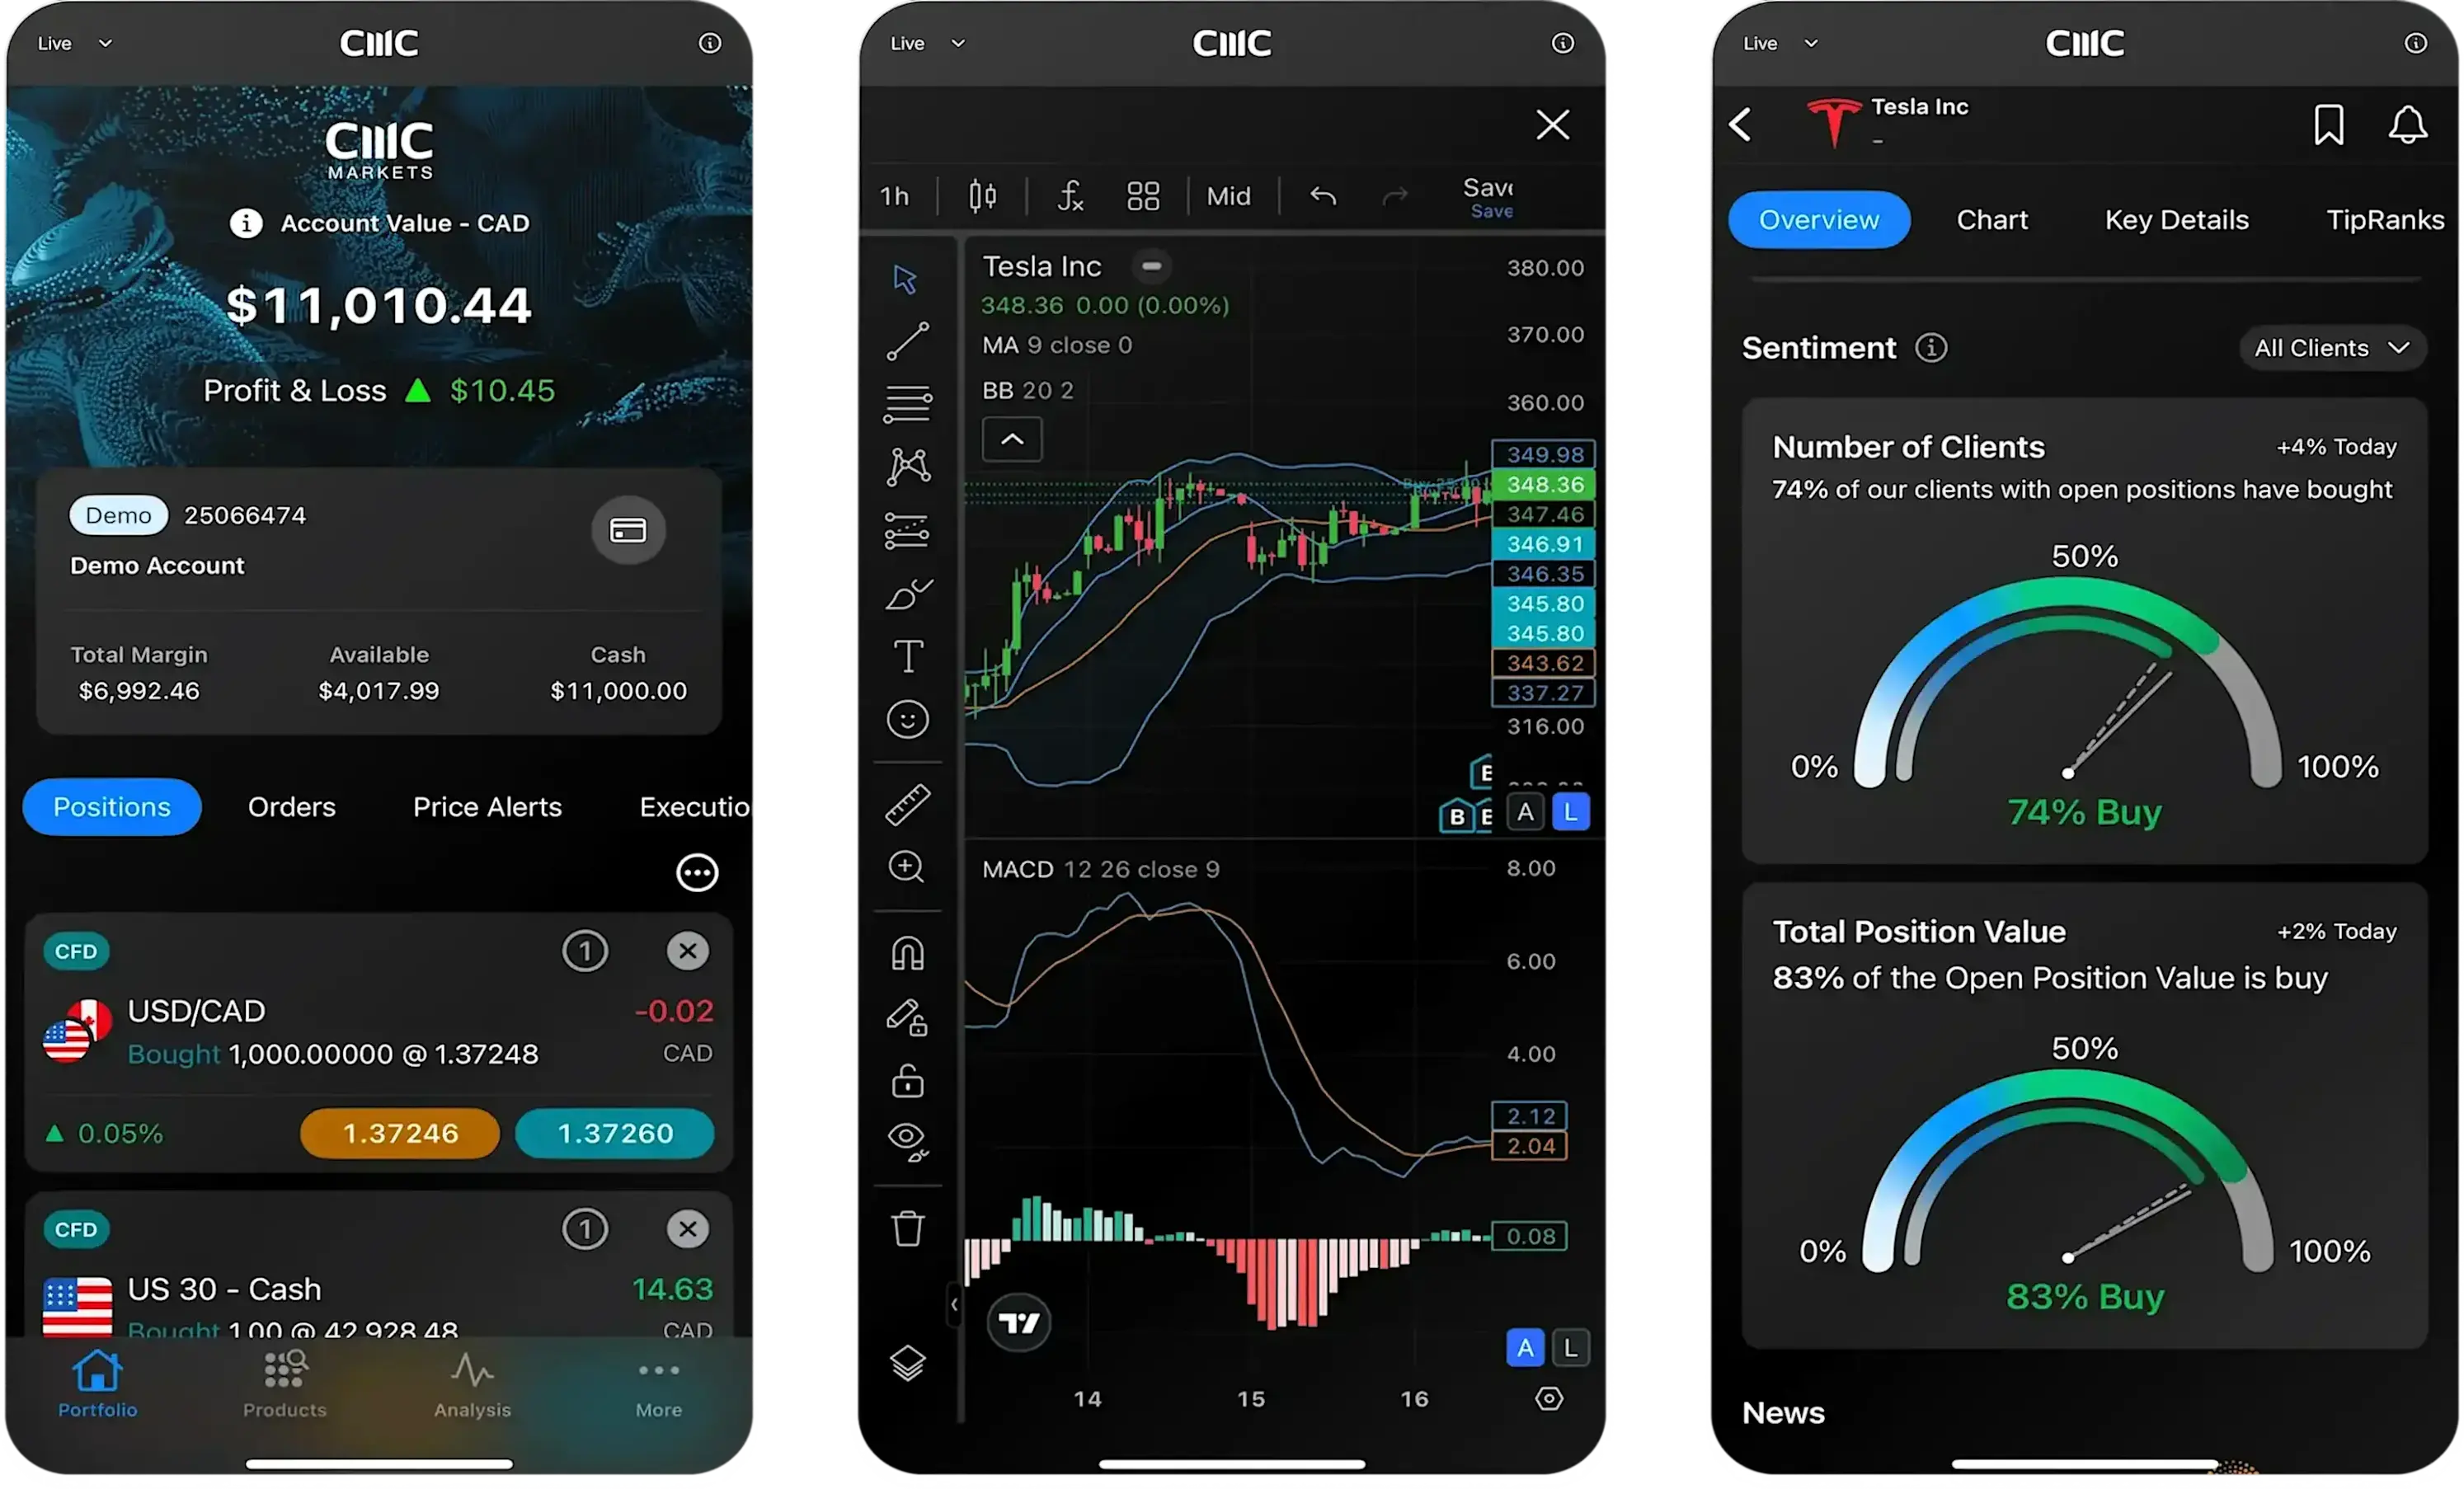
Our award-winning mobile app³ includes five different chart types: line, bar, spread, heiken-ashi and candlestick charts.
The multi-chart view takes advantage of the larger screen size, allowing you to scan up to four charts at a time. Compare price action and identify significant market movements across multiple instruments.
Just tap any live streaming price to open an order ticket and place a trade, then edit open orders directly from charts.
Any analysis conducted on a chart opened through a watchlist is automatically saved when you close that chart, so you can easily access the analysis later.
FAQs
The most common charts for traders include line charts, bar charts and candlestick charts. A line chart is a very basic chart that is useful for showing simple trend movements. On the contrary, bar charts and candlestick charts display complex data that defines the opening price, closing price, highest price and lowest price in a specified period.
A technical indicator is a mathematical calculation used as part of technical analysis. Technical indicators analyse an asset's price history and volume statistics, to help traders predict future price movements.
Volume can help you identify the momentum of an instrument. The price movement and volume are often closely related – when the price increases, volume is likely to increase as well. Traders often watch price and volume movement in parallel to confirm the existence, or continuation of a trend.
Volume can also be used to identify when trading activity is declining, indicating when a trader might consider taking profit on their open positions.
Note that volume chart data refers to the trade volumes of the underlying asset, rather than CMC Markets' trade volumes.
Disclaimer: Volume chart information refers to the past. Any information relating to past performance of an investment is not a reliable indicator of future results. Volume charts are provided by CMC Markets for general information purposes. They are not intended to provide trading or investment advice and must not form the basis of your trading or investment decisions. CMC Markets will not be responsible for any loss incurred arising from any investments made based on volume charts.
We offer live volume data directly from the exchanges. However, in quiet periods for illiquid instruments, there might be limited or no volume updates for a short time.
The volume bar will be green if the underlying price is unchanged.
We collect volume data during the underlying exchange opening hours only (UK time):
UK and EU: 8am - 4.30pm
US: 2.30pm - 9pm
Currently, volume on charting is available when trading on indices and shares.
As a CMC client, your money is held separately from CMC Markets’ own money and is held on trust in segregated bank accounts with a Canadian bank. This account is opened and maintained in the name of CMC Markets Canada Inc. We do not use client money to hedge our positions or to meet the trading obligations of other customers. This offers you financial security and you can rest assured that your money with us is protected.
Yes, CMC Markets Canada Inc. is a member of the Canadian Investment Regulatory Organization (CIRO). CFDs are distributed in Canada by CMC Markets Canada Inc. acting as principal.
There's no cost when opening a live trading account with us. You can also view prices and use tools such as charts, Reuters news or Morningstar quantitative equity reports, free of charge. However, you'll need to deposit funds in your account to place a trade.
Our income primarily comes from our spreads, while other fees, such as overnight holding costs, make a minor contribution to our overall revenue.
1The chart forum is not intended to issue financial promotions, provide investment advice or encourage users to engage in investment activity. Any content posted by us will not have taken your circumstances into account. We are not liable for any course of action you may take or refrain from taking, or any loss or damage suffered by you, as a result of relying on any information provided on the chart forum.