
5 powerful forex trading strategies
Traders use a range of strategies - including technical and fundamental analysis - to potentially improve their forex trading performance.
As a currency trader, it might be important to understand what drives market volatility, as well as key concepts like support and resistance, Fibonacci retracements, Bollinger bands, and stochastics.
Whether trading short-term for a few minutes or holding positions over hours and days, you might want to keep an eye on how the forex market reacts near important support and resistance levels.
Support level is a price level where demand has historically been strong enough to prevent further falls. The resistance level is a price level where selling pressure has historically stopped prices from rising further.
So how can you put this information to work? The following strategies may help traders identify potential trading opportunities
1. The bounce strategy
Key Takeaway: The bounce strategy looks for a price to rebound off a past support level and looks at trading the bounce.
Many traders believe that past key levels could also be important in the future.
Let’s say a market dropped to a level yesterday and then bounced back. Traders may see that level as a bargain. If the forex pair slips back to that level, there could be a trading opportunity.
The chart below shows a classic bounce setup in USD/CAD over two hours:
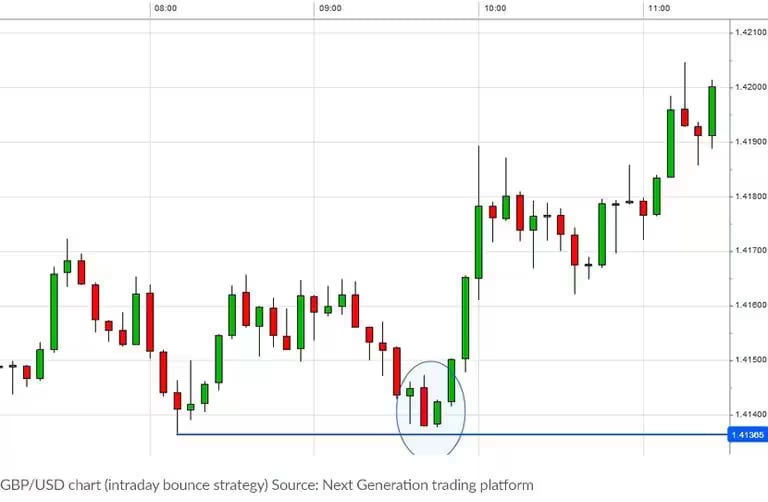
Pricing is indicative. Past performance is not a reliable indicator of future results.
2. The running-out-of-steam strategy
Key Takeaway: This strategy watches for a market to stall at a past high, then sells short when the momentum fades.
Just as you might view a drop to a previous low as a buying opportunity, you can also watch for a forex market to approach a previous peak - a level where it turned and headed back down.
If a market is going up but then stalls and turns back, you may judge the price to be too expensive.
The approach here is essentially the mirror image of the bounce strategy. You’re looking for the forex pair to run out of steam near that previous high, so you can sell short and potentially profit from a slide in price.
Strategies based on previous highs and lows can also simplify risk management:
When traders trade a bounce, they might place a stop loss just below the previous low.
When traders are shorting a stall near a high, they might place their stop loss just above the previous high.
The example below shows how a high from the previous day in AUD/USD ended up being where the market stalled twice the following morning:
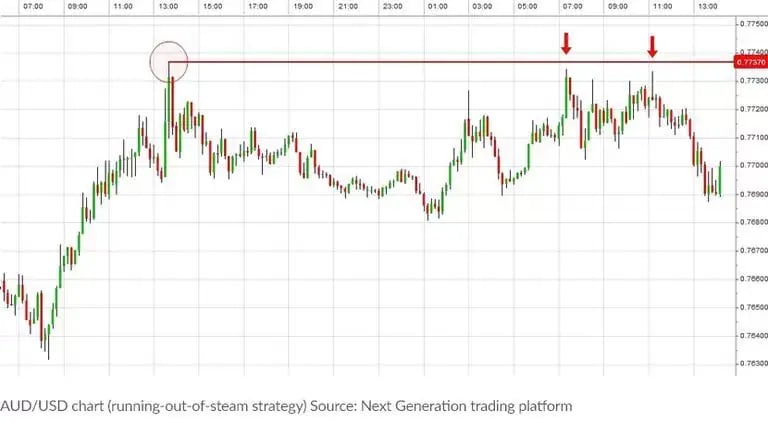
Pricing is indicative. Past performance is not a reliable indicator of future results.
3. The breakout strategy
Key Takeaway: Traders might trade when the price breaks above a key resistance level, potentially signalling a new trend.
Previous highs and lows in the forex market don’t stay unbroken forever. If they did, markets would stagnate and trade sideways day in and day out.
At some point, a previous high will be broken, which many traders view as a potentially important shift in market sentiment.
Previously, when the forex pair reached that high, sellers moved in and the price fell, suggesting the market was overvalued.
If that old high is breached - what’s known as breaking resistance - you may see traders willing to keep buying. The price is no longer considered too high.
This trading strategy could potentially catch trends early, as breakouts can be a signal of a shift in market direction.
Here’s an example for EUR/USD - a longer-term breakout on the daily charts:
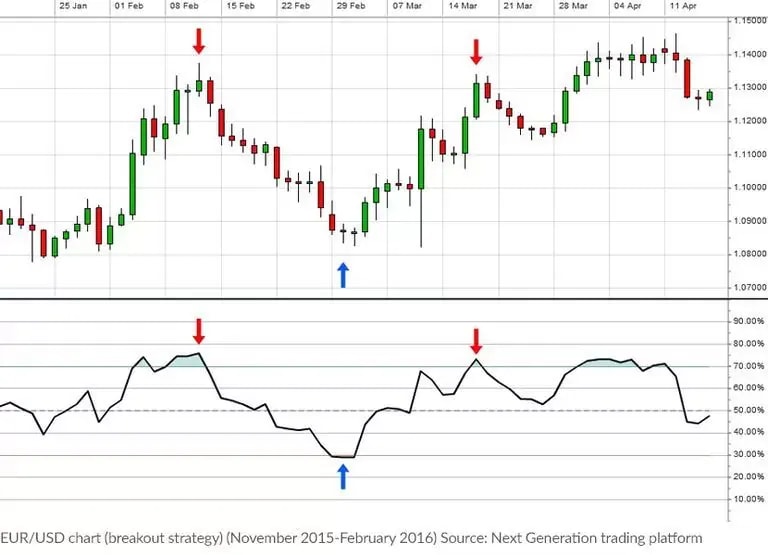
Pricing is indicative. Past performance is not a reliable indicator of future results.
4. The breakdown strategy
Key Takeaway: Traders might short sell when the price slips below a past support level, potentially hinting at further weakness.
On the flip side of the breakout method, there’s the breakdown strategy, which applies when a forex market slips below a previous low.
Once again, this signals a shift in market sentiment. Suddenly, a level where buyers were happy to step in, seeing the market as cheap, has been broken.
This break of a support level might be seen as an opportunity to short sell and potentially profit from further weakness in price.
The example below, USD/JPY on an hourly chart, shows that even the best forex trading tactics don’t work all the time.
Notice the false signal (highlighted by the circle) before the effective signal (highlighted by the black arrows) that saw the market really start to fall.
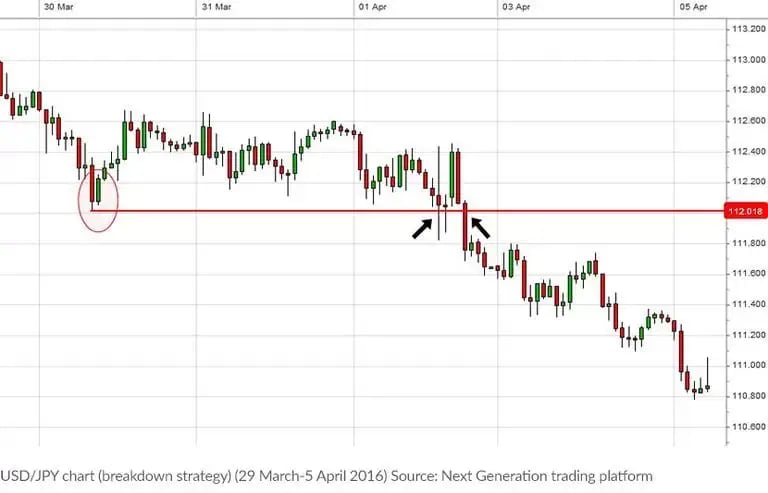
Pricing is indicative. Past performance is not a reliable indicator of future results.
5. Overbought/oversold
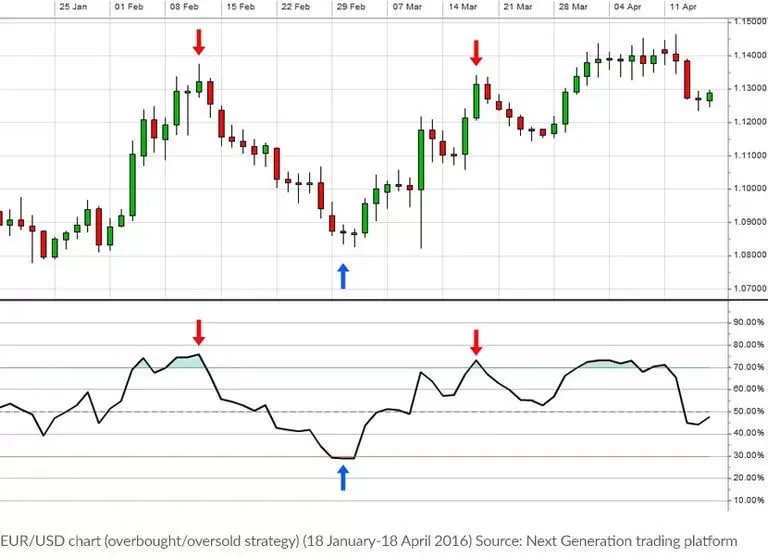
Key Takeaway: Some traders might use RSI to spot extremes, they might sell if the market looks overbought or buy is oversold.
The forex trading strategies mentioned so far are all based on chart patterns. This last method takes a more mathematical approach, using the Relative Strength Index (RSI).
RSI belongs to a family of trading tools known as oscillators, which, as the name suggests, oscillate as the markets fluctuate:
RSI above 70% – Market is considered overbought, which might be a cue to look for potential selling opportunities.
RSI below 30% – Market is considered oversold, which might be a cue to look for potential buying opportunities.
The example below highlights some of the buy and sell signals generated by the overbought/oversold strategy on a daily EUR/USD chart.
Pricing is indicative. Past performance is not a reliable indicator of future results.
Of course, no forex trading strategy works all the time, every time. However, these five tactics, used with a sensible approach to managing risk, might highlight potential opportunities across a wide range of forex markets.
Our intuitive and highly customizable CMC Markets Platform gives you access to an economic calendar, client sentiment, and a range of trading tools and analyst reports, providing insights and tools to support your market analysis and trading decisions
CMC Markets does not endorse or offer opinion on the trading strategies used by the author. Their trading strategies do not guarantee any return and CMC Markets shall not be held responsible for any loss that you may incur, either directly or indirectly, arising from any investment based on any information contained herein.
Disclaimer: CMC Markets is an execution-only service provider. The material (whether or not it states any opinions) is for general information purposes only, and does not take into account your personal circumstances or objectives. Nothing in this material is (or should be considered to be) financial, investment or other advice on which reliance should be placed. No opinion given in the material constitutes a recommendation by CMC Markets or the author that any particular investment, security, transaction or investment strategy is suitable for any specific person. The material has not been prepared in accordance with legal requirements designed to promote the independence of investment research. Although we are not specifically prevented from dealing before providing this material, we do not seek to take advantage of the material prior to its dissemination.
Ready to get started?
Start trading with a live account today or try a demo with $10,000 of virtual funds.