Volatility trading
In trading, volatility is a measure of how prices or returns are scattered over time for a particular asset or financial product. It is a key metric because volatility creates profit potential. However, trading on volatility can also create losses, if traders do not learn the appropriate information and strategies.
Price action is a measure of volatility. Traders are therefore trading volatility all the time and creating it with their transactions. By watching how far or how fast prices move, traders can gain insight into whether a price move is likely to sustain itself or if the move has run its course.
How to use volatility in trading
Through understanding volatility, you can create appropriate trading strategies that help to harness profit potential. This can be done by trading volatile assets, tracking changes in volatility to aid in selection, incorporating volatility-based technical indicators or software, or by focusing on low-volatility assets.
Volatility is an important metric for all traders, including short-term day traders and swings traders, whose primary focus is on daily and weekly price movements.
So, how is volatility traded? You can trade on volatility across various markets and timeframes. In this article, we will look at volatility trading strategies that can be applied to shares, forex and commodities.
Volatility trading strategies
Volatile stocks for day trading
If the price moves a lot in a day, especially with lots of volume, this means that a trader can enter and exit the position easily. This is one reason why volatile stocks are so popular for day trading, in particular. Learn day trading with us.
A volatile stock is one whose price fluctuates by a large percentage each day. Some stocks consistently move more than 5% per day, which is the expected volatility based on the historical movement of the stock. Other stocks may only have certain days where they move more than 5%. A volatility trader can seek out either a consistently volatile stock or one that is simply showing large movements that day. You can identify the biggest risers and fallers within the share market of each trading day in the Product Library inside our trading platform, Next Generation.
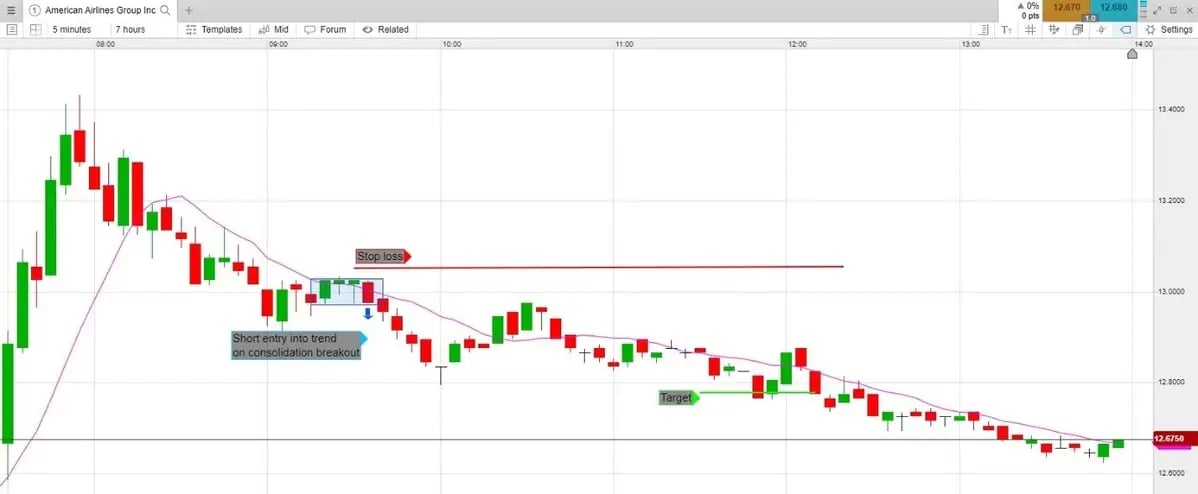
For example, when day trading volatile stocks, you can set up a five-minute chart and wait for a short-term trend to develop. For day trading, a 10-period moving average will often highlight the current trend. You should then wait for a consolidation, which is at least three price bars that move mostly sideways, and enter the position if the price breaks out of the consolidation in the trending direction. This is a relatively simple and effective way to trade high volatility stocks.
For example, as shown in the chart below, American Airlines’ stock was moving more than 6% per day for much of the first half of 2020, and often had large trending days. In this instance, a trader could place a stop-loss $0.02 outside the other side of the consolidation. Then, a target should be placed at two times the risk. The risk is the difference between the entry and stop-loss price. In the example below, a downtrend is in progress. A consolidation forms with a low of $12.975. A short entry could be taken when the price drops $0.01 below, at $12.965.The top of the consolidation is $13.035, and a stop-loss could be placed at $13.055. The risk on the trade is $0.09 per share (calculated by $13.055 – $12.965). The target is an $0.18 profit per share, placed at $12.785.
A day trading strategy could be used in any stock that is trending, but it tends to produce more favourable results in volatile stocks because the larger price movements mean that the target move is more likely to be reached.
A more dynamic strategy is to use a trailing stop-loss, such as a 20-period moving average, which allows the trader to capture large trends should they develop. They should then exit when the stock price touches the moving average indicator line.
As a general guideline, when a major stock index such as the S&P 500 is experiencing above average market volatility, the individual stocks within the index will also see more volatility.
Volatility breakout trading strategy
A breakout happens when the price of an asset moves beyond support and resistance levels on a trading chart, which indicates a new trend direction. One way to measure volatility breakouts is through technical indicators, such as the average true range (ATR), which tracks how much an asset typically moves in each price candlestick. A sharp rise in the ATR can alert traders to potential trading opportunities, as it most likely indicates that a strong price movement is underway and there will be a breakout.
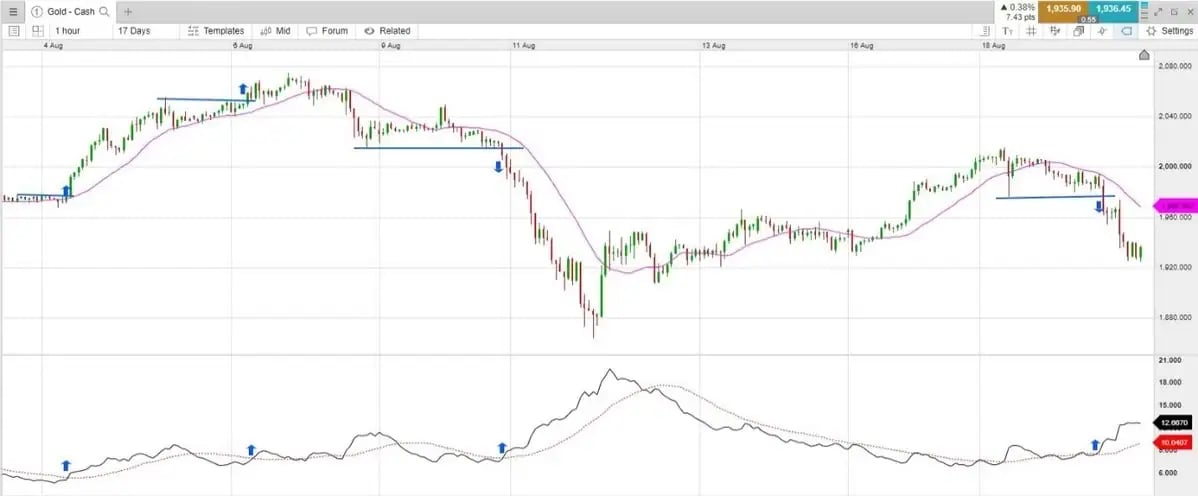
The hourly gold chart below shows several potential volatility breakout trades on the one-hour chart. To help highlight breakouts, a 20-period simple moving average has been added to the ATR on our trading platform.
Only when the ATR crosses above the simple moving average is there is a potential trade. The price should also be breaking above or below recent swing highs or lows for better opportunity. This helps to filter the times when the ATR crosses the moving average, yet the price does not move significantly.
Four examples of the trade setup are shown on the chart below. This is mostly an entry technique, although it can be turned into a strategy by placing a stop-loss below the recent swing low if going long, or above the recent swing high if going short. Consider using a 20-period simple moving average for the exit point. Moving averages are a common indicator and in trending environments, they can provide timely exits. When the price touches the moving average, this means the price is starting to move in the opposite direction, or that price momentum has stalled, allowing the average price to catch up to the current price. Price momentum reversing or slowing is a valid reason to consider exiting a trade.
Volatility trading indicators
As we have discussed, the average true range is a particularly effective tool for tracking how much an asset is moving, on average, for each price bar.
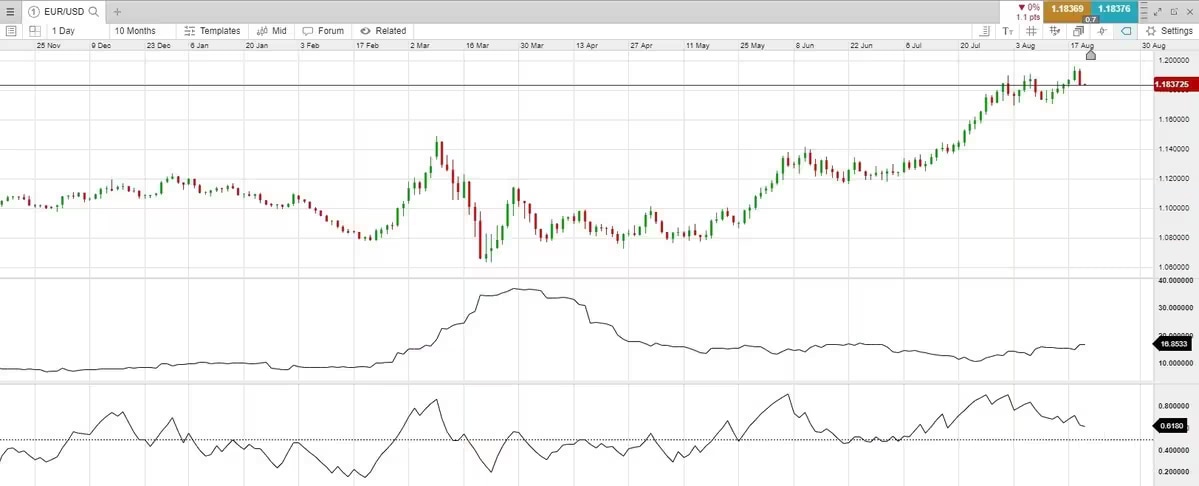
Historical volatility also measures price action. This is a technical indicator that is shown below on the EUR/USD chart. Implied volatility anticipates what could happen in the future. For example, historical volatility may be low, yet we know that if the US Federal Reserve or the Bank of England releases an interest rate announcement, this will cause increased price movement and volatility in the forex market. Implied volatility is derived from the options market, where put and call options are bought and sold.
The Relative Volatility Index (RVI) is another indicator that analyses the direction and volatility of price. It is the bottom indicator shown on the EUR/USD chart below. When the indicator is above a level of 50, this means that volatility is on the upside. When the indicator is below 50, this means that volatility is on the downside. Therefore, if a buy signal occurs and the indicator is above or passing above 50, this helps to confirm the buy signal. If a sell signal occurs and the indicator is below or passing below 50, this helps to confirm the sell signal. It is not reliable as an indicator when only used by itself, but can be used to confirm entries in conjunction with other strategies.
The CBOE VIX index is an instrument that measures market volatility (how quickly prices are likely to change) over a period of 30 days. Traders can use it to assess market risk, which is why it’s sometimes referred to as ‘the fear index’. It averages the weighted prices of S&P 500 options. Learn more about the VIX volatility index.
What is quantitative volatility trading?
Quantitative volatility trading uses computer programs and algorithms to exploit changes in volatility. The use of software means that a strategy can be implemented on much shorter timeframes, or more trades can be taken than what is possible for a human. For example, a computer could place trades in milliseconds, potentially placing hundreds or thousands of trades per day for tiny profits, using a variation of the strategies discussed earlier. Read more about quant trading strategies.
We host the international trading platform, MetaTrader 4, through our own software. MT4 is available to customise and provides a wide array of indicators to track and anticipate volatility changes. In addition, MT4 also supports automated trading solutions called Expert Advisors, which are computer programs that trade on your behalf. Learn more about MT4 trading here or register for an account now.
Volatility trading software
The UK's no1 web trading platform, Next Generation, offers a number of volatility indicators required to trade the strategies discussed, as demonstrated in the above charts. The platform comes with drawing tools, price projection tools and chart forums so that traders can display their data clearly and easily.
Open a live account now to get started trading on volatility. This comes with a free demo account that allows to you practise with virtual funds before depositing real money.
Trading leveraged products in a volatile market
When trading volatility on our platform, we require traders to trade on margin. Leveraged products have the potential for larger profits, but equally large losses. For example, if an unleveraged EUR/USD position moves 1% or an unleveraged stock position moves 1%, the trader makes or loses 1%. However, say that the trader uses a leverage ratio of 10:1 on that position. Now, that 1% move turns into a 10% potential profit or loss.
The above filters out volatility. The price was moving 1% on average, but consider that now it is moving 5%. With the same 10:1 leverage ratio, holding through a 5% price swing could mean a 50% profit or loss on the position.
While traders like the chances of increased profits, opening an unsuccessful trade using leverage can be catastrophic, and volatility increases the magnitude of the problem. For this reason, you should always trade with a stop-loss or exit point in mind.
How to trade low volatility
Trading volatile markets and price movements does not appeal to all traders. Most long-term investors prefer markets to be quiet. However, day traders can take advantage of low volatility by acting like a market maker — someone who provides buy and sell orders when needed to help create a liquid market. They make their money by buying lower and selling at higher prices throughout the day.
An example would be a $0.01 stock that does not fluctuate much in price but has buyers and sellers at $0.03 and $0.035. A trader could place a bid at $0.03 and a sell order at $0.035. If both their orders fill, they make 16.6% without the price even moving. In price terms, this is not a particularly volatile stock, but in percentage terms, it is, because each $0.005 move is a big percentage jump. Read more about trading volatile UK penny stocks.
Summary
Volatility trading has the potential to provide big rewards when using leverage, but also big losses. Whether trading a volatile market or not, risk management is paramount. Stop-loss orders should always be used, and the need for these execution tools increases as volatility and/or leverage increases.


Ready to get started?
Disclaimer: CMC Markets is an execution-only service provider. The material (whether or not it states any opinions) is for general information purposes only, and does not take into account your personal circumstances or objectives. Nothing in this material is (or should be considered to be) financial, investment or other advice on which reliance should be placed. No opinion given in the material constitutes a recommendation by CMC Markets or the author that any particular investment, security, transaction or investment strategy is suitable for any specific person. The material has not been prepared in accordance with legal requirements designed to promote the independence of investment research. Although we are not specifically prevented from dealing before providing this material, we do not seek to take advantage of the material prior to its dissemination.