
10 important stock chart analysis patterns
Stock chart patterns are an important trading tool that should be utilised as part of your technical analysis strategy. From beginners to professionals, chart patterns play an integral part when looking for market trends and predicting movements. They can be used to analyse all markets, including forex, shares, commodities and more.
Patterns may help to suggest in which direction prices are headed, based on previous movements
They’re most effective on candlestick charts as you can see previous open and close prices
There is a great variety of chart patterns, including wedges, triangles, cup and handles, head and shoulders and flags
Stock pattern screeners make it easier to spot them on charts
A basic knowledge of support and resistance will help in identifying technical patterns
The following stock chart patterns are the most recognisable and common chart patterns to look out for when using technical analysis to trade the financial markets. Our guide to eleven of the most important stock chart trading patterns can be applied to most financial markets and this could be a good way to start your technical analysis.
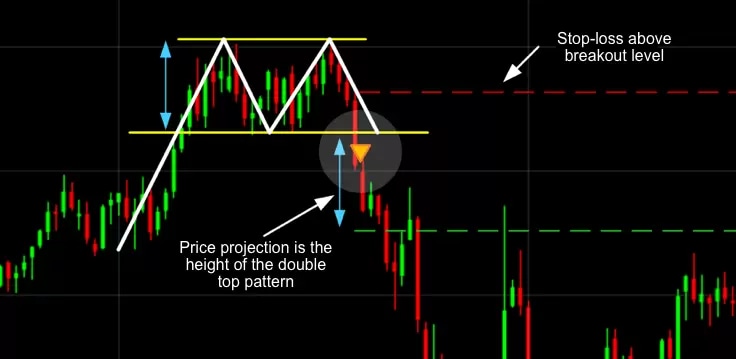
Double tops
The Double Top pattern is a simple but useful stock chart pattern. It is one of the bases for predicting stock trends in technical analysis. When this pattern appears, it generally indicates that the stock 's upward trend may not be sustainable. A Double Top pattern is formed when a stock reaches a certain price and encounters resistance, then rises again after falling (see Figure 1), but cannot break through the previous high. When the price falls again and is lower than the previous low, indicating that the stock trend has further weakened, the Double Top pattern is considered to be fully formed. When encountering this chart pattern, the target level that investors should pay attention to is the stock price below the previous low (downward arrow in the chart below).
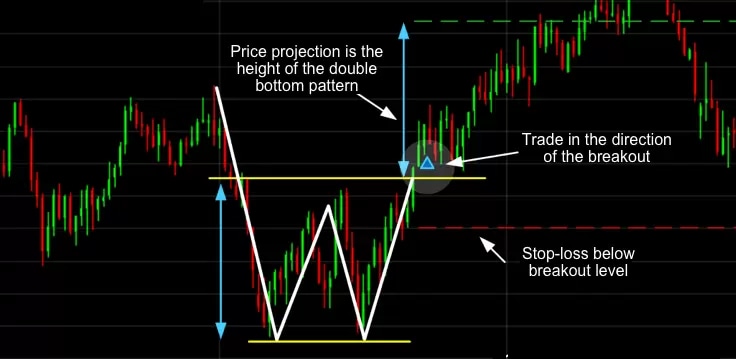
Double bottoms
The Double Bottom pattern is the opposite of the Double Top pattern and is used to analyze stocks that are falling. When a Double Bottom pattern occurs, the price will fall to a low point, then rise again and fall again, but will not fall below the previous low. When the price rises and crosses the previous high, the Double Bottom pattern is complete. When analyzing this stock chart pattern, the target level that investors should pay attention to is the stock price above the previous high (arrow on the right hand side of the chart below).
Trendline & Break out
There is a saying that goes, "The trend is your friend." Investors who like to analyze stock charts will try to determine the trend of a stock and try to ride the trend. Of course, trends cannot last forever. Once the stock price breaks out of the trendline, it will affect the stock's trend pattern. In an uptrend, we can draw a trendline with rising lows (showing buying demand); in a downtrend, we can draw a trendline with falling highs (showing selling pressure). When the price breaks out of the trendline (circled in Figure 3), it means that the stock's trend may change, and traders and investors tend to adjust their positions accordingly
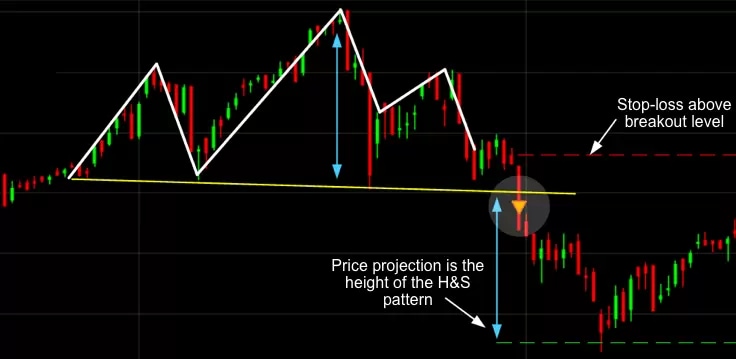
Head and shoulders
The head and shoulders pattern is similar to the double top pattern, but it is composed of three highs (a high peak, then a higher peak, and then a lower peak, hence the name head and shoulders pattern). Generally, when a head and shoulders pattern appears, the second peak should be the largest, forming the "head", and the third peak should be shorter. When analyzing stock charts, analysts draw a short trend line along the recent low (see Figure 4) and call this line the "neckline". When the price breaks through this trend line and falls, the head and shoulders pattern is completed. In this chart pattern, investors can expect the stock to fall further, reaching the same amount as the rise of the "head". The head and shoulders pattern can be used to determine whether the stock trend will reverse from bullish to bearish, or vice versa. At the same time, when observing the head and shoulders pattern and predicting the stock trend, there is one factor that must not be ignored - time. In the process of forming the head and shoulders pattern, the closer the formation time of the left shoulder and the right shoulder, the stronger the signal of the stock trend opposite to the head and shoulders pattern.
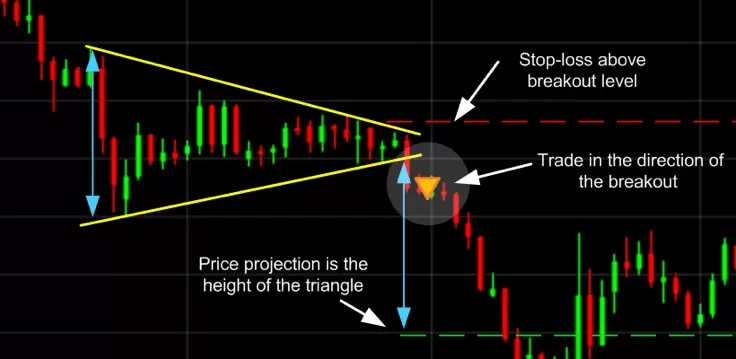
Triangle
In stock chart analysis, not all patterns are signals about a stock trend reversal. Some chart patterns can also tell us that the market is moving sideways and will continue its previous trend. Triangles are a very common continuation pattern in stock chart patterns. The stock price fluctuation range becomes narrower and narrower, forming a triangle on the chart. Generally speaking, when the stock price breaks through the triangle, it will continue the previous trend. Therefore, when a stock is in an uptrend and a triangle appears, its stock price is expected to break upward, which is a buy signal. On the contrary, when a stock is in a downtrend and a triangle appears, its stock price is expected to fall further after breaking through the triangle.
Symmetrical triangle
A symmetrical triangle is made up of at least two increasingly lower highs and two increasingly higher lows. Draw two trend lines along the highs and lows, and you will see a symmetrical triangle with similar slopes on the chart. This interval will become narrower and narrower, and the two trend lines will finally intersect and continue the previous trend. In the analysis of stock charts of symmetrical triangles, we usually need to judge the trend of stocks based on the actual market conditions.
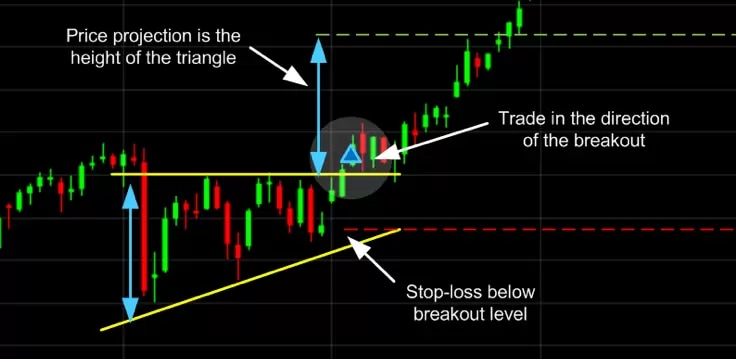
Ascending triangle
An ascending triangle is a bullish stock chart pattern. In stock chart analysis, the appearance of this pattern usually means that the stock trend should continue its previous upward trend. The ascending triangle has a flat trendline above (the resistance) and an upward trendline below (the support).
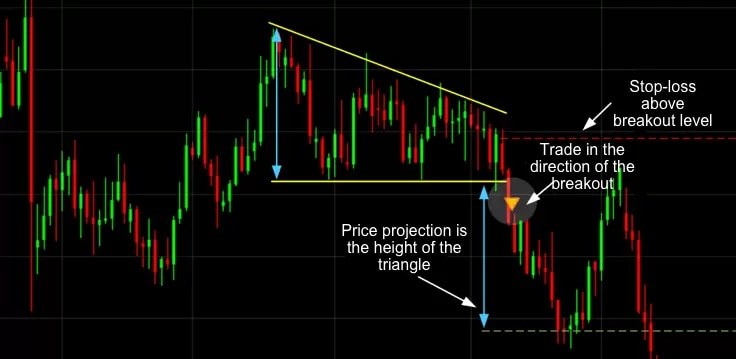
Descending triangle
In stock chart analysis, a descending triangle is a bearish pattern that usually signals that the stock will continue to fall. A descending triangle sometimes forms at the end of an uptrend, signaling that the trend may reverse and continue lower.
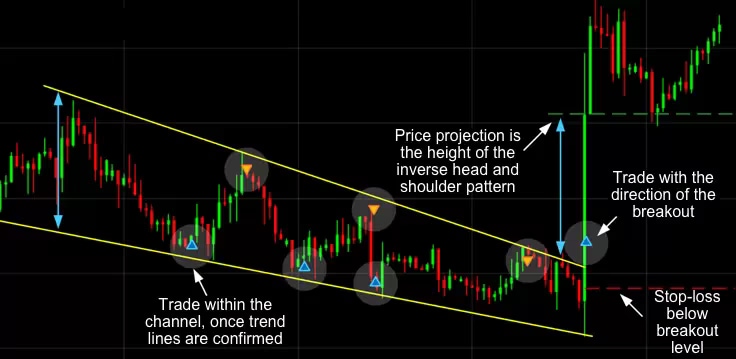
Wedge
Wedges are widely found in stock charts. In stock chart analysis, we usually classify them into two categories: rising wedges and falling wedges. The rising wedge represents the rise of the stock trend, and the falling wedge is usually accompanied by the decline of the stock trend.
Rising wedge
A rising wedge is usually formed by two upward trend lines, where the slope of the support trend line is deeper than the slope of the resistance trend line. In the stock chart analysis of this pattern, we usually think that the stock's trend will continue to fall.
Falling wedge
A falling wedge is usually formed by two downward trend lines, where the slope of the resistance trend line is deeper than the support trend line. In the stock chart analysis of this pattern, we usually think that the stock trend will continue to rise.
Pennant
The pennant pattern is seen as a pattern that continues the existing stock trend in stock chart analysis. This pennant pattern, which looks like a small symmetrical triangle, is a consolidation pattern of the overall stock trend and further consolidates the trend during its formation. After the pennant pattern is completed, the stock trend will continue the previous upward or downward trend. The pennant pattern can be divided into an ascending pennant and a descending pennant according to the different stock trends before the chart pattern is formed.
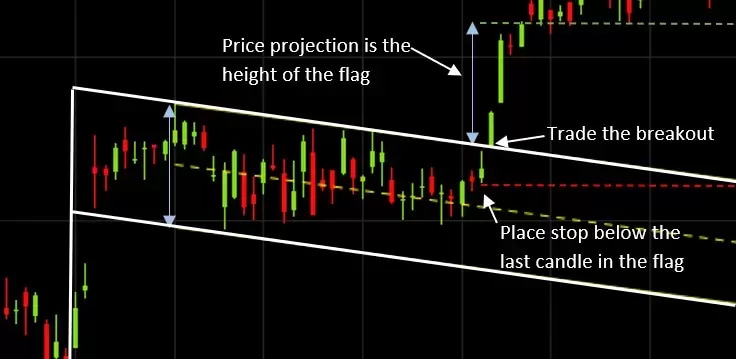
Flag
The formation of a flag in a stock analysis chart represents a strong continuation of the stock's long-term trend. Flag patterns usually appear in strong stock trends, where the formation phase of the flag causes the overall stock trend to enter a consolidation phase. The flag pattern formed by connecting the high line and the low line usually moves in the opposite direction of the overall stock trend, and finally fluctuates sharply in the previous trend after breaking through the flag pattern.
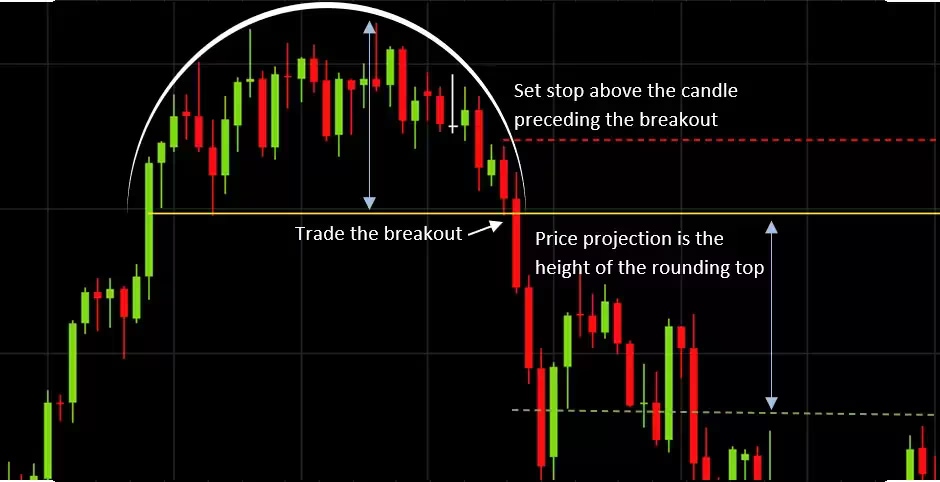
Rounding top or bottom
In stock chart analysis, a round bottom usually appears after a long period of stock decline. Before reaching the bottom, the stock price will first break the support trend line. The closer to the bottom, the slower the stock's decline will be. After reaching the bottom, the overall stock trend will first enter a period of consolidation. After the consolidation period is completed, the price will slowly rise to form a bowl bottom shape. Then it will enter a rapid trend rebound stage.
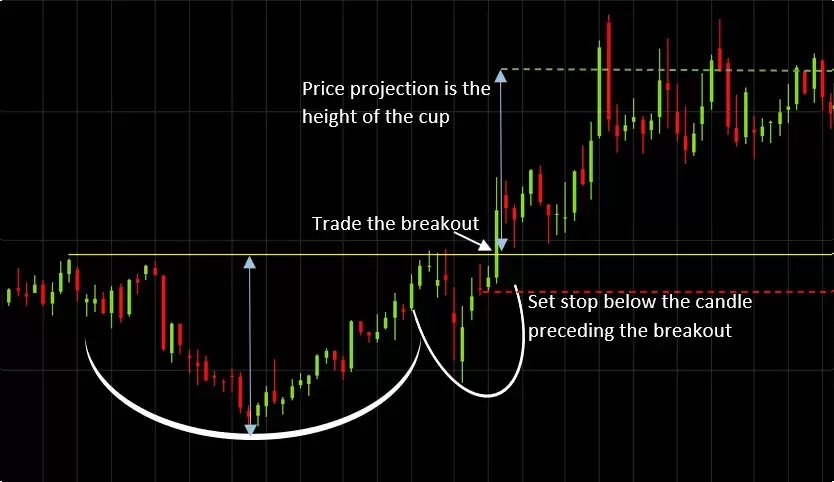
Cup with handle
The cup-and-handle pattern is formed after the round bottom pattern is formed, and the stock price temporarily falls back by a small margin and then the stock trend rises again. In stock chart analysis, the formation of the cup-and-handle pattern is usually a continuation of the previous stock trend, which also provides traders and investors with a more unique stock trend feature and entry opportunity. Want to learn more about technical analysis and how to trade?
Stock chart patterns are lines and shapes drawn onto price charts in order to help predict forthcoming price actions, such as breakouts and reversals. They are a fundamental technical analysis technique that helps traders use past price actions as a guide for potential future market movements.
Chart patterns work by representing the market’s supply and demand. This causes the trend to move in a certain way on a trading chart, forming a pattern. However, chart pattern movements are not guaranteed, and should be used alongside other methods of market analysis. Chart patterns can be identified on our chart pattern screener tool.
The head and shoulders chart pattern and the triangle chart pattern are two of the most common patterns for forex traders. They occur more regularly than other patterns and provide a simple base to direct further analysis and decision-making. Try a demo account to practise your chart pattern recognition.
There are three key chart patterns used by technical analysis experts. These are traditional chart patterns, harmonic patterns and candlestick patterns (which can only be identified on candlestick charts). See our list of essential trading patterns to get your technical analysis started.
There are three key chart patterns used by technical analysis experts. These are traditional chart patterns, harmonic patterns and candlestick patterns (which can only be identified on candlestick charts). See our list of essential trading patterns to get your technical analysis started.
When a price signal changes direction, it is a reversal pattern. However, when a price trend continues in the same direction it is a continuation pattern. Technical analysts have long used chart patterns as a method for forecasting price movements and trend reversals. You can use our pattern recognition software to help inform your analysis.
Disclaimer: CMC Markets is an execution-only service provider. The material (whether or not it states any opinions) is for general information purposes only, and does not take into account your personal circumstances or objectives. Nothing in this material is (or should be considered to be) financial, investment or other advice on which reliance should be placed. No opinion given in the material constitutes a recommendation by CMC Markets or the author that any particular investment, security, transaction or investment strategy is suitable for any specific person. The material has not been prepared in accordance with legal requirements designed to promote the independence of investment research. Although we are not specifically prevented from dealing before providing this material, we do not seek to take advantage of the material prior to its dissemination.

