Spread bets and CFDs are complex instruments and come with a high risk of losing money rapidly due to leverage. 68% of retail investor accounts lose money when spread betting and/or trading CFDs with this provider. You should consider whether you understand how spread bets, CFDs, OTC options or any of our other products work and whether you can afford to take the high risk of losing your money.
Charting features
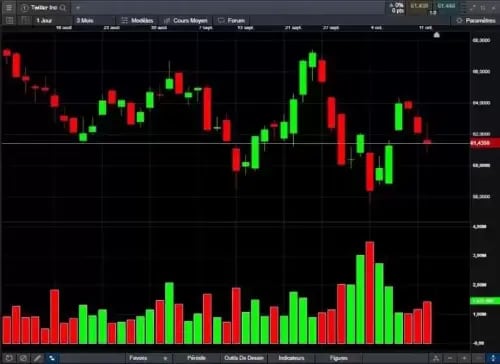
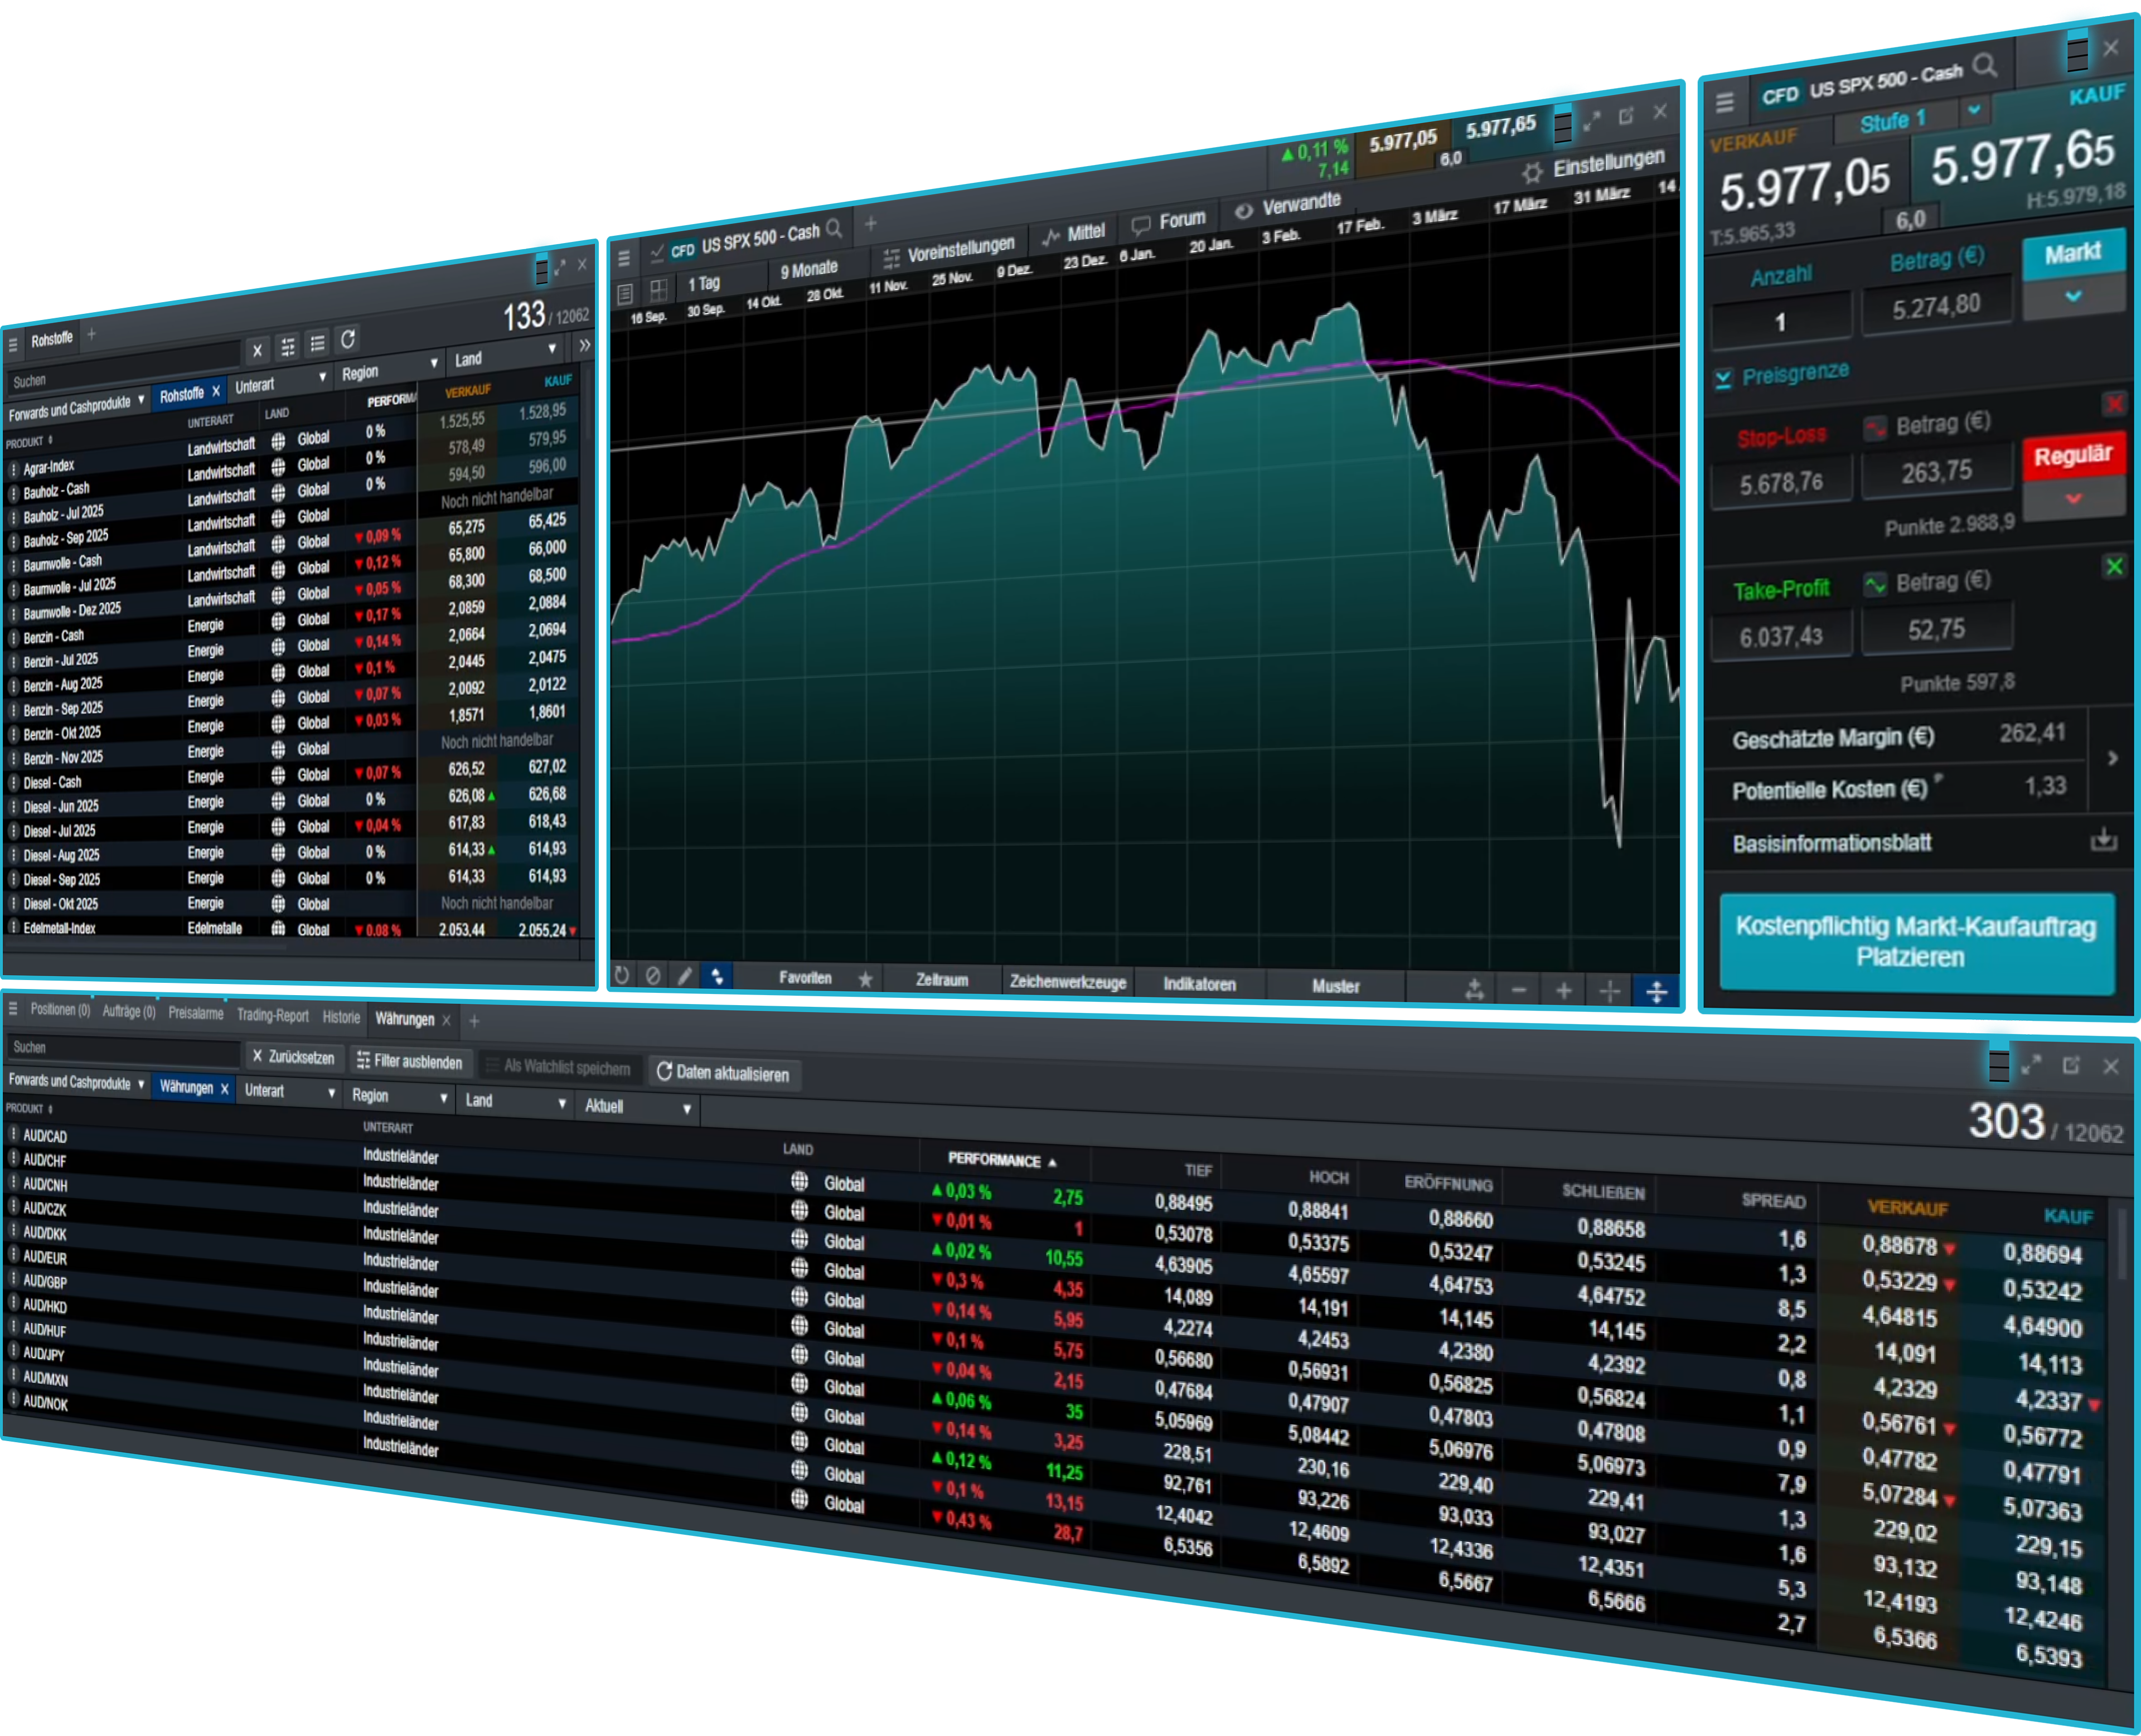
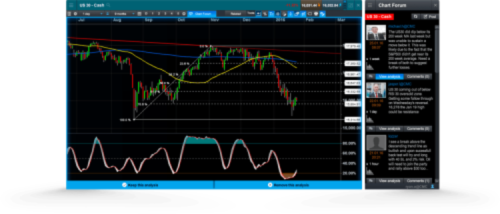
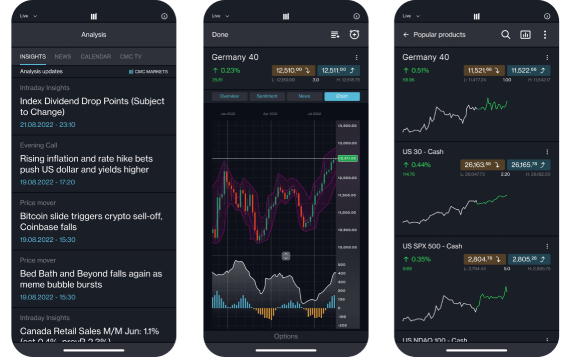
Our advanced charts offer a host of features to support your analysis, including multiple chart types, over 115 technical indicators and drawing tools, automated pattern recognition and a chart forum community.
SCAN THIS QR CODE
TO DOWNLOAD THE APP

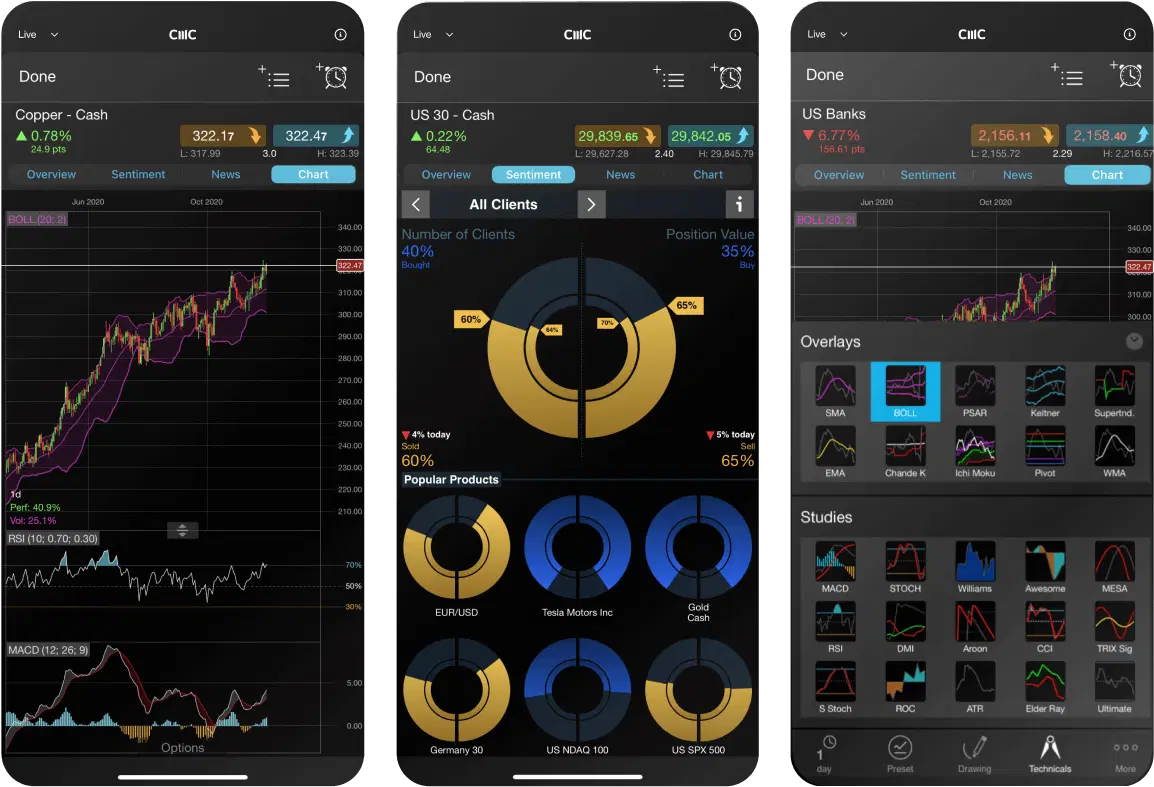

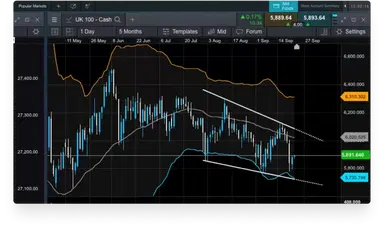
Our top charting features
Award-winning spread betting and CFD broker
1FSCS is an independent body that offers protection to customers of financial services firms that have failed. The compensation amount may be up to £85,000 per eligible person, per firm. Eligibility conditions apply. Please contact the FSCS for more information.
2The chart forum is not intended to issue financial promotions, provide investment advice or encourage users to engage in investment activity. Any content posted by us will not have taken your circumstances into account. We are not liable for any course of action you may take or refrain from taking, or any loss or damage suffered by you, as a result of relying on any information provided on the chart forum.
3Best Mobile Trading Platform, ADVFN International Financial Awards 2024 & 2025; Best Mobile Trading Platform, Professional Trader Awards 2024; No.1 Web Platform, ForexBrokers.com Awards 2023.
Loading...
Loading...