USD/JPY approaches significant breakout despite increasing intervention risk
USD/JPY is testing resistance near 159.5 after strong U.S. data, with a break potentially targeting 162. However, intervention risk and upcoming BOJ and Fed decisions may limit further gains.
Founder, Mott Capital Management
USD/JPY tests long-term resistance
Following a hotter-than-expected U.S. producer price index, the U.S. dollar is strengthening against the Japanese yen, approaching the upper resistance level around 159.5. USD/JPY has been confined to this region over the past few trading sessions, but, more importantly, it marks resistance dating back to January 2025. A break above 159.5 could trigger a move to 162.
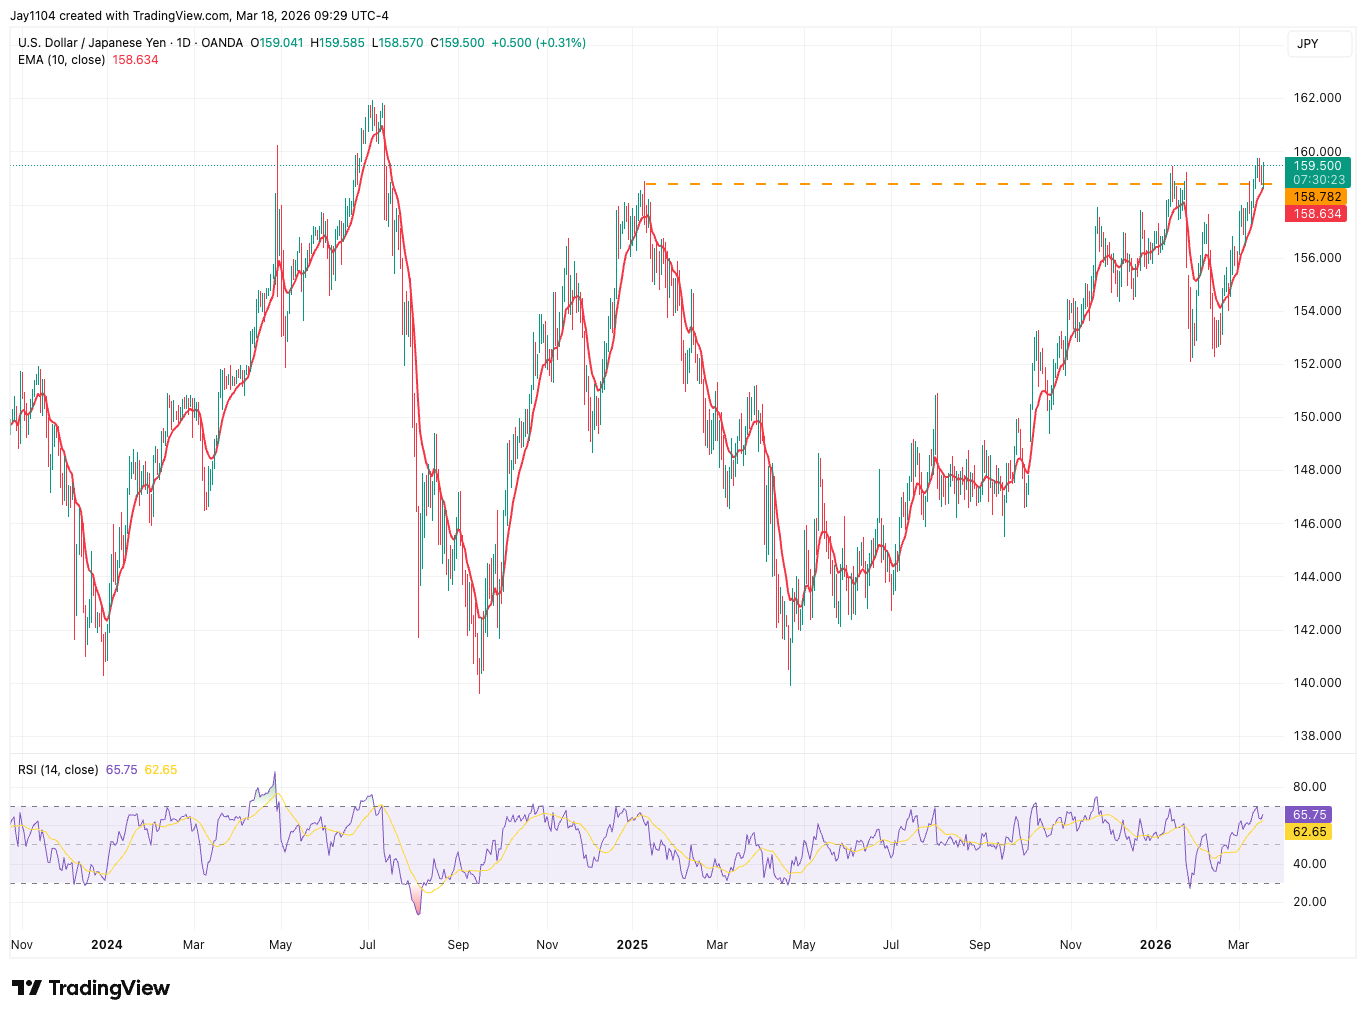
Source: TradingView, 18 March 2026
Intervention risk remains elevated
The 160 level in USD/JPY has always been tenuous, as the Japanese government has consistently pushed back against further yen weakness by signalling potential intervention. The last time USD/JPY traded around this level was at the end of January, around the time of the BOJ’s previous meeting, when intervention fears quickly swept through the market.
Policy divergence supports upside case
The BOJ is scheduled to announce the results of its upcoming monetary policy meeting on 19 March, following the Fed’s policy meeting on 18 March. With the market not expecting the BOJ to hike interest rates again until possibly summer, and also pricing out the possibility of Fed rate cuts, this creates a scenario where a delayed response from the BOJ, combined with rising inflation worries in the U.S., could weaken the Japanese yen further against the dollar, pushing USD/JPY towards the 162 level last seen in July 2024.
Technical support holds for now
For now, USD/JPY has found support at the 10-day exponential moving average, which has been in place since the end of February. It even fell to the 10-moving average on 18 March but managed to bounce right off it earlier in the day. A break of the moving average would suggest a reversal of the trend may be in the works.
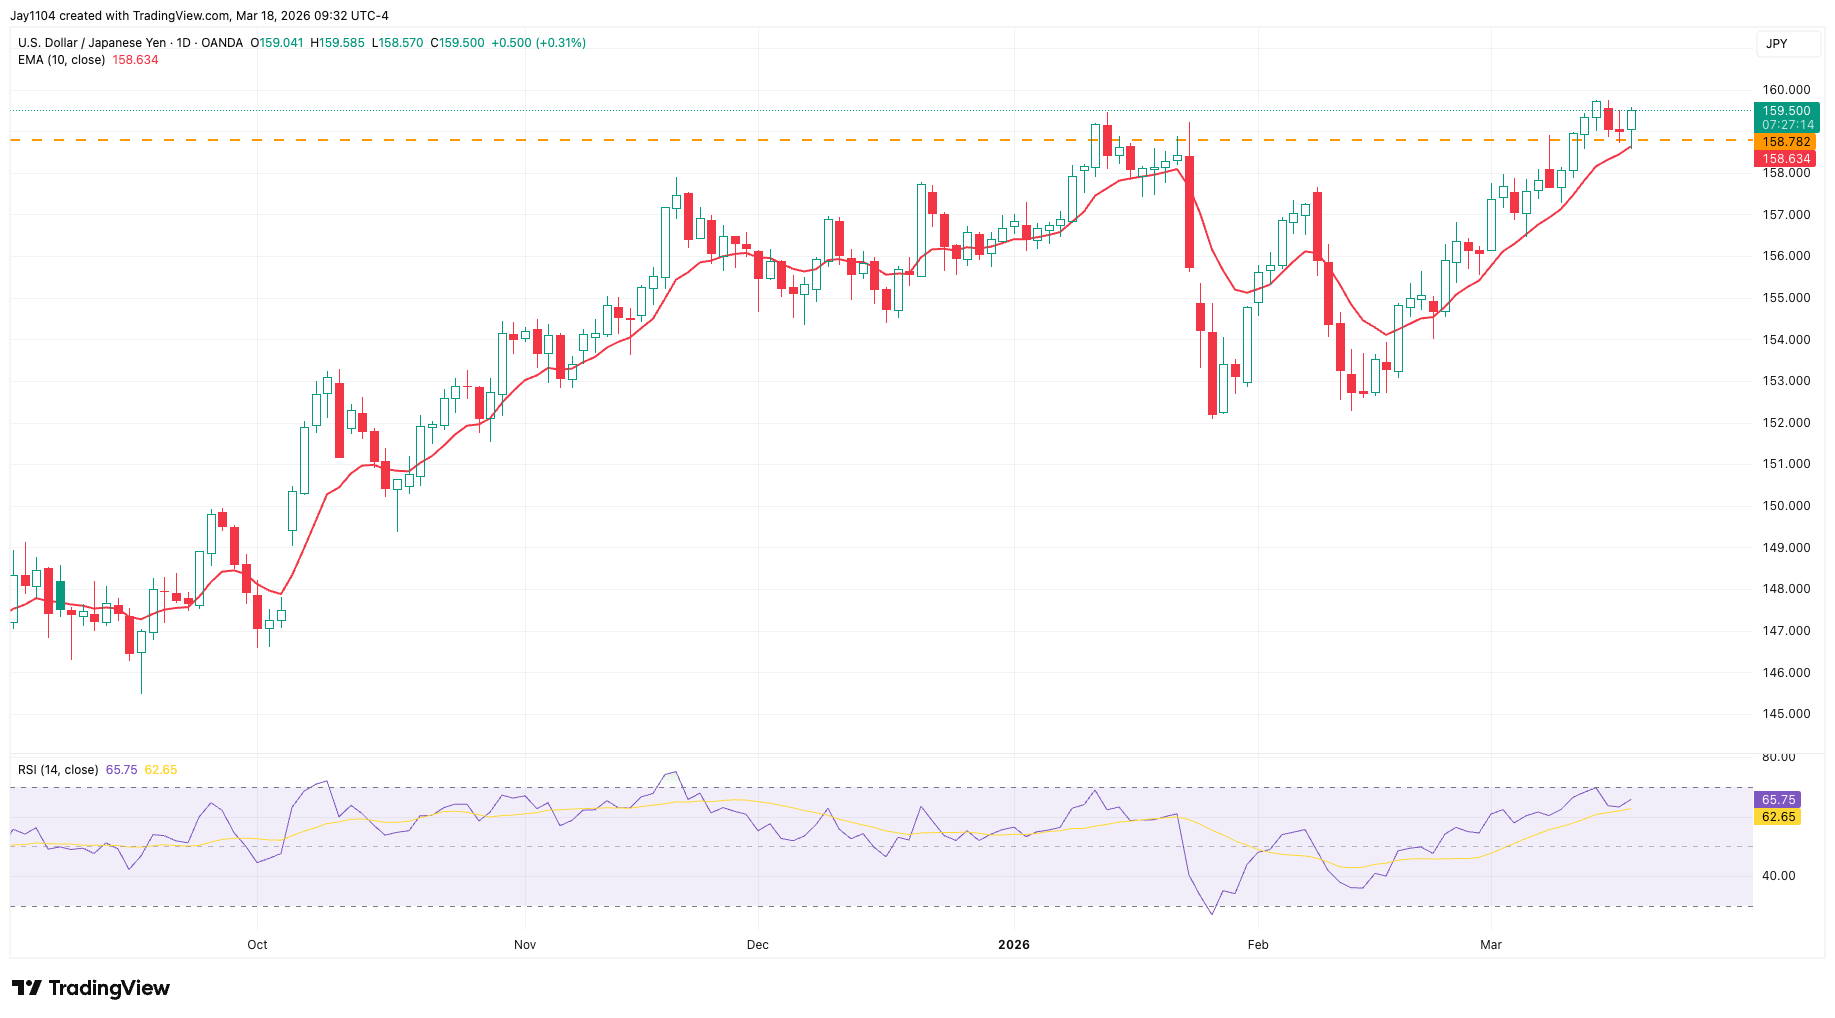
Source: TradingView, 18 March 2026
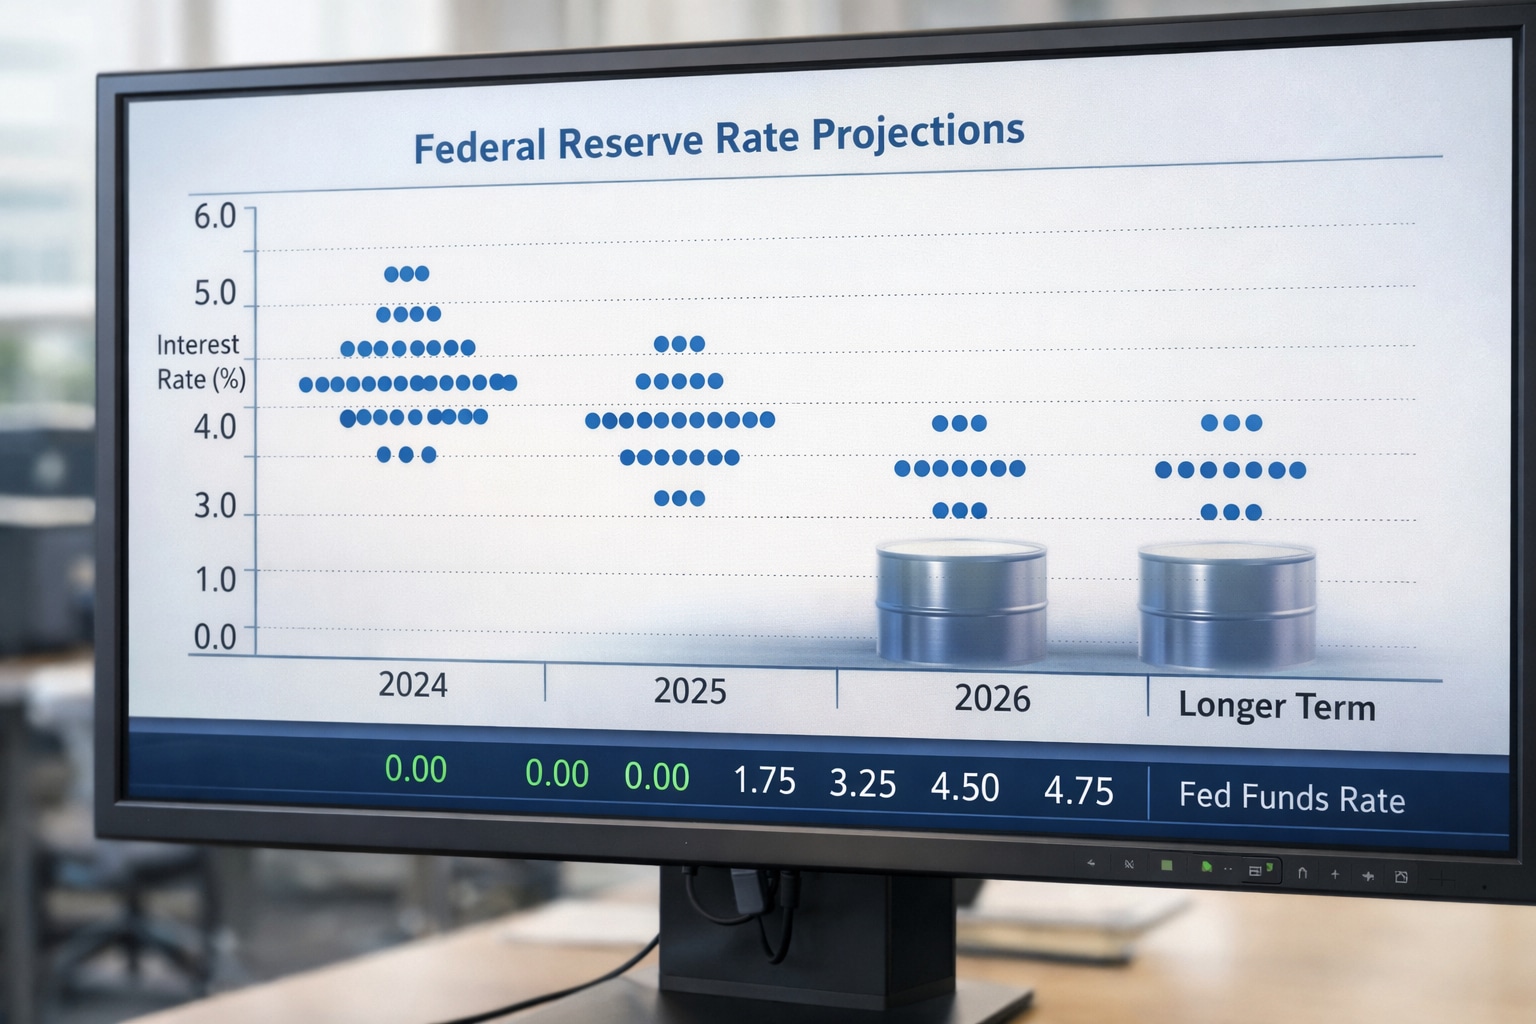
The Fed calibrates the oil shock: PCE at 3.00% and an end to rate cuts in 2026?
Fed rate decision and projections at 5pm, followed by Powell at 5:30pm. Financial conditions remain loose, and higher oil could push Personal Consumption Expenditures (PCE) towards 3.00%. Will the dot plot signal no rate cuts in 2026?

Energy, inflation and currencies – central banks face their first major test after Iran
A wave of central bank decisions this week will test how policymakers respond to the energy shock triggered by the Iran crisis. Markets are focused on inflation risks, rate expectations and potential currency intervention.