Silver's recent rally may not last for much longer
Silver has recovered within a rising channel, but the move still looks more like a retracement than the start of a durable new uptrend. If support around $76 gives way, the chart may confirm a bear flag and open the way to a much deeper pullback.
Founder, Mott Capital Management
Silver's bounce still looks like consolidation
Silver has been grinding higher in a narrow channel over the past few weeks, but the structure still looks more like a consolidation than the start of a fresh bullish trend. The recent rise has been accompanied by improving momentum, with the RSI pushing higher, yet that alone is not enough to overturn the broader corrective picture.
After such a sharp drop earlier in March, a tighter rebound phase can often be a pause within a larger down move rather than the beginning of a sustained recovery. That appears to be the risk silver is now facing.
Retracement and Bollinger resistance are capping the move
Technically, the recent recovery has now retraced 61.8% of the decline from the 2 March highs. That makes the current move look more like a retracement of the earlier sell-off than a genuine upside breakout. At the same time, the upper Bollinger band is acting as resistance, which is helping to cap silver's advance.
That combination matters because it suggests the rally is meeting resistance at a level where traders would often expect sellers to return. If silver cannot push decisively through that area, the rebound may start to lose momentum quickly.
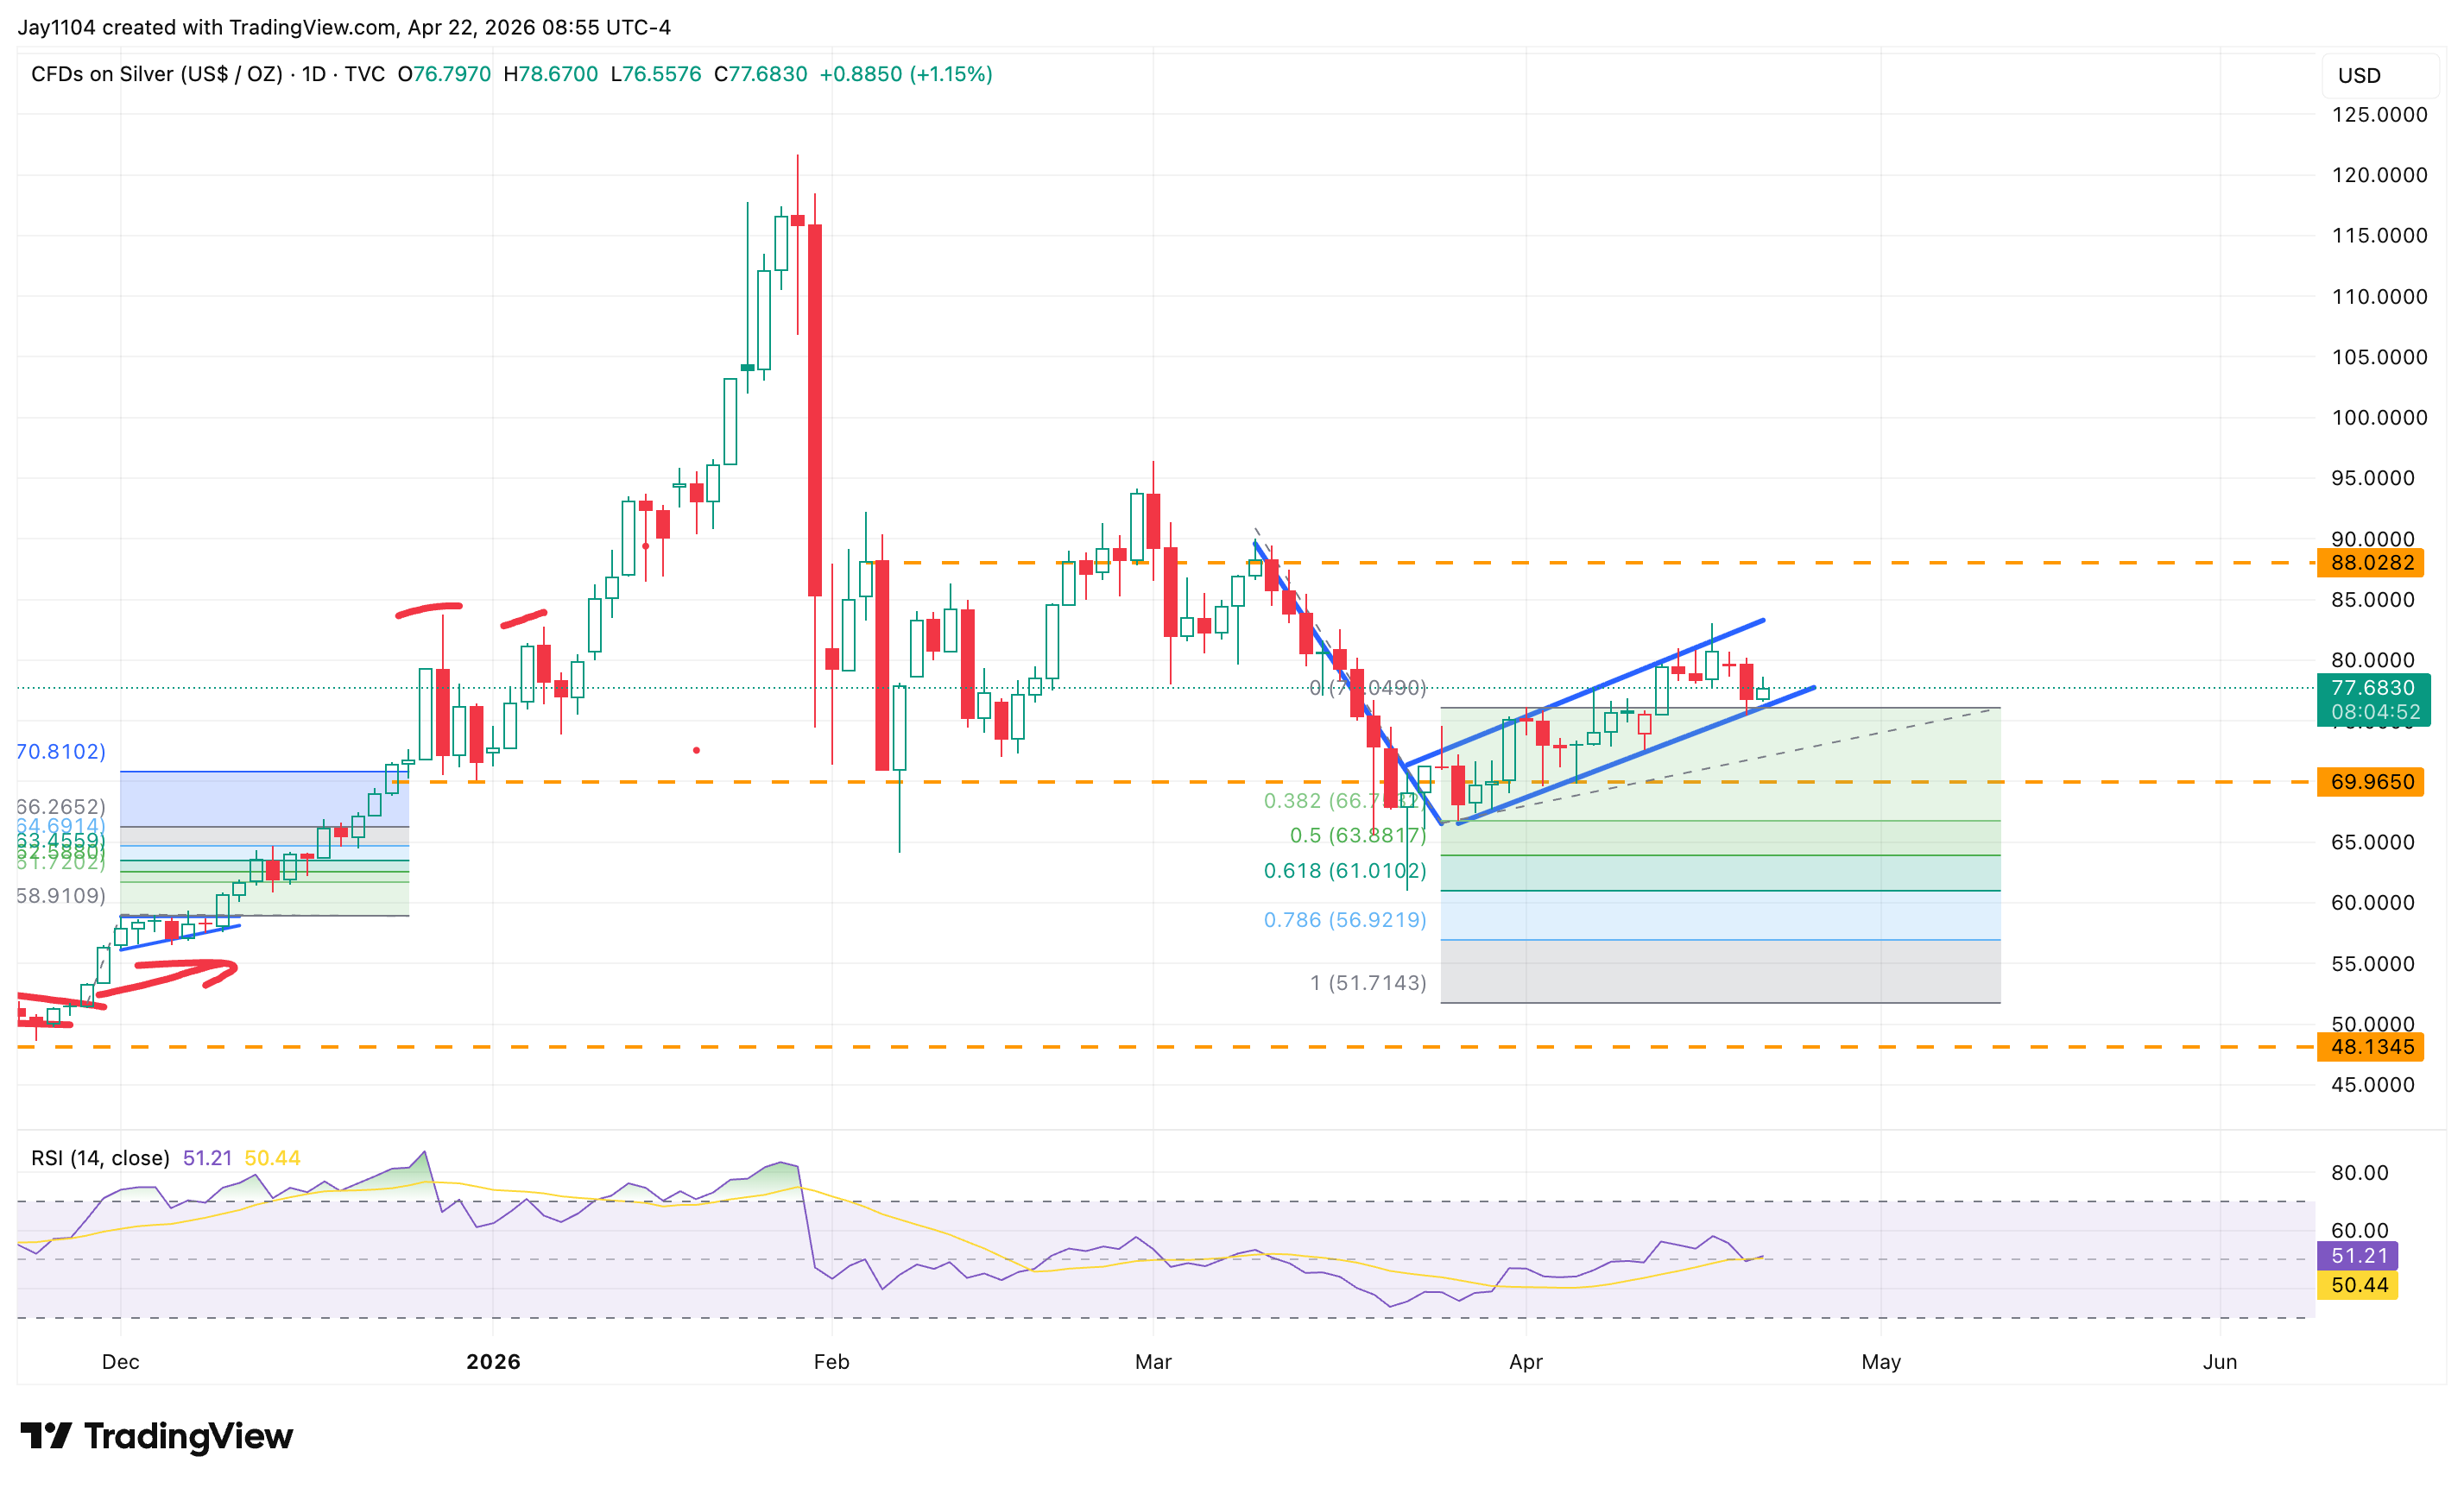
Source: TradingView, 22 April 2026
Support around $76 is the key near-term test
The most important level now sits around $76, which marks the lower boundary of the rising channel. If silver can keep holding above that region, the current consolidation can continue a little longer. But if silver breaks below $76, it would point to a trend break and suggest the recent rise was only part of a broader bear flag formation.
That would be a meaningful shift because it would turn the recent strength from a recovery signal into a warning that sellers are regaining control.
A bear flag would leave silver vulnerable to a deeper drop
If the pattern does prove to be a bear flag, then a break of support would make a much larger decline more likely. In that scenario, the chart suggests silver could eventually fall below $60.
For now, the setup is balanced on whether the recent advance can evolve into something more durable. But unless silver can clear resistance and hold the channel, the risk still favours the view that this rally may not last much longer.
FTSE 100 opens flat as Middle East risks continue to dominate sentiment
The FTSE 100 opened broadly unchanged around 10,700 as Middle East risks continued to dominate sentiment, supporting energy and mining stocks while investors watched Segro, 3i Group and the ECB.
DAX remains range-bound as investors sell both good and bad news
The DAX remains trapped around 25,000 as investors use both strong and weak earnings news to reduce risk, while elevated energy prices and today's ECB decision keep sentiment cautious.

EUR/USD faces the ECB at key support as Lagarde takes centre stage
EUR/USD is testing the base of a long-running range as markets expect the ECB to keep rates unchanged at 2.25%. With Brent near $95, investors will focus on whether Christine Lagarde softens her hawkish tone or keeps inflation risk front and centre.