Portfolio rebalancing tests turn-of-the-month effect as Nasdaq 100 volatility rises
Portfolio rebalancing and the turn-of-the-month effect could shape Nasdaq 100 volatility during a compressed US trading week.
Market Analyst
Portfolio rebalancing could offset the turn-of-the-month effect
Two major market-flow drivers are set to collide next week. The first is the turn-of-the-month (TOM) effect, a well-documented seasonal pattern linked to systematic inflows from passive investment strategies and regular fund contributions.
The second is half-year portfolio rebalancing. Many asset managers will need to adjust allocations to remain aligned with investment mandates. JPMorgan estimates that this could drive roughly $165bn of equity selling, in what would be one of the largest rotations into fixed income in recent years. If those rebalancing flows outweigh the usual TOM-related inflows, the seasonal pattern could lose effectiveness or be neutralised altogether.
Nasdaq 100 / iShares 20+ Year Treasury Bond ETF (TLT), weekly chart with stochastic
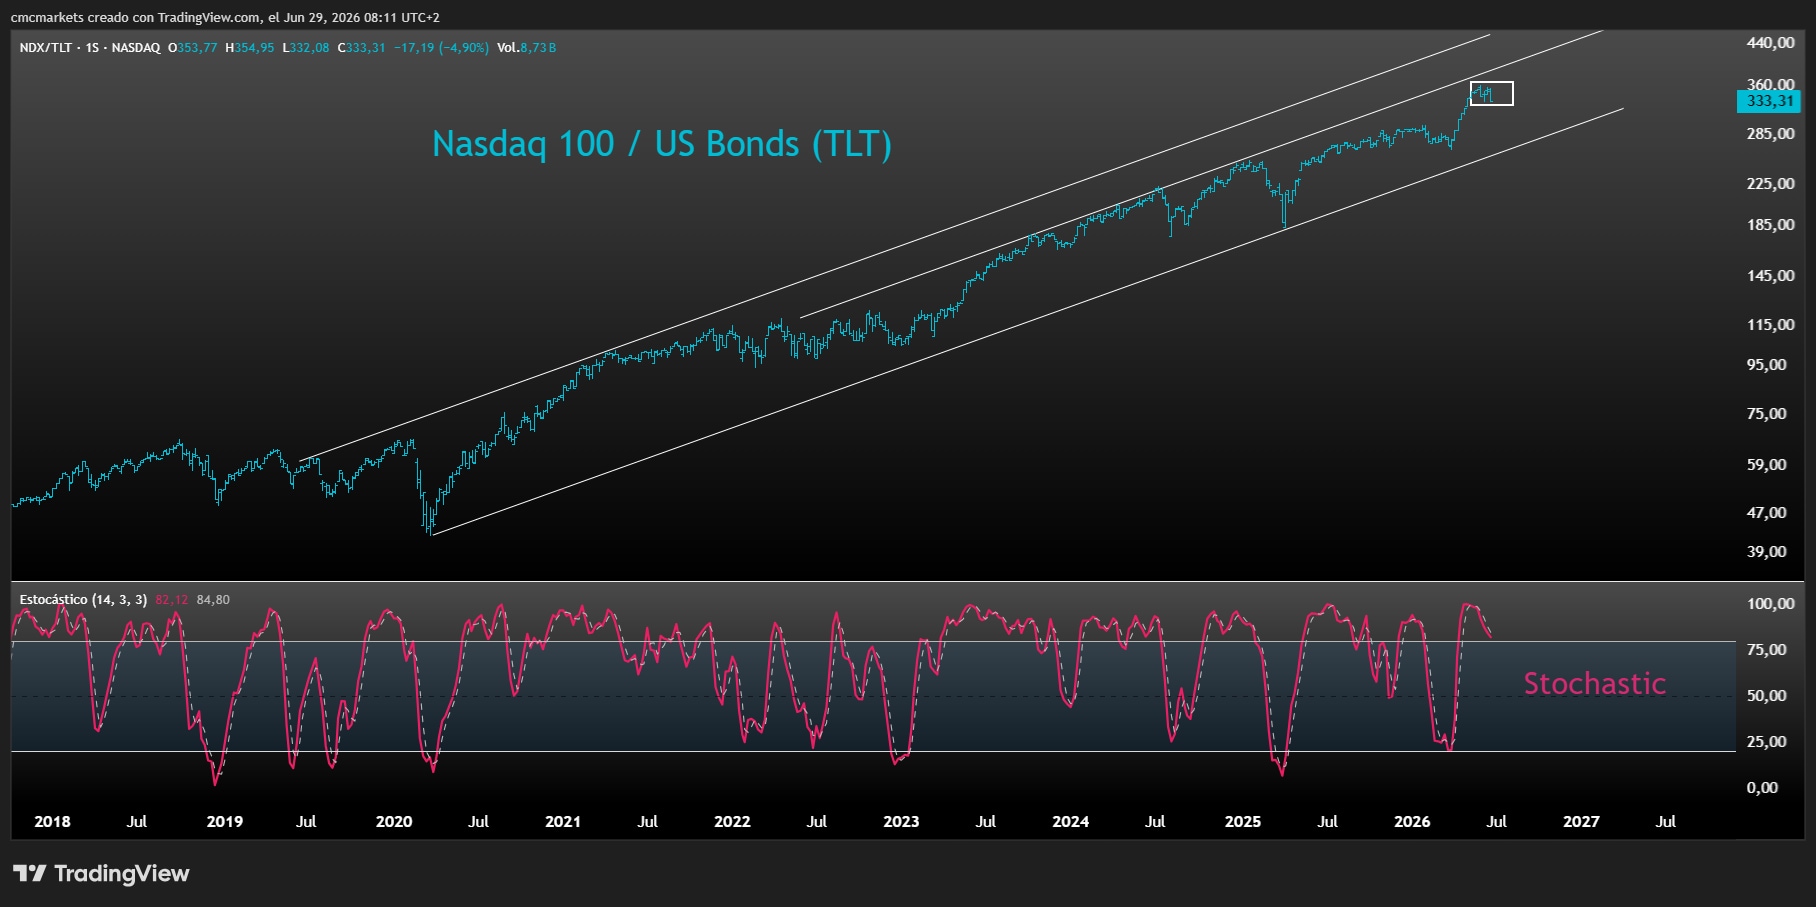
Sources: TradingView, Luis Ruiz
A compressed week with several key catalysts
The clash between these flow dynamics comes during a particularly busy macroeconomic week.
The Independence Day holiday means Wall Street's trading week ends on Thursday, compressing several major releases into four sessions. Investors will be watching Job Openings and Labor Turnover Survey, the ADP employment report, ISM manufacturing data and, most importantly, the official non-farm payrolls report, which will be released on Thursday rather than Friday.
Trading ranges rise sharply
Large rebalancing flows and high-impact macro data raise the risk of sharper market moves. Early signs of that volatility are already visible.
Average true ranges (ATR) across the main US indices are rising again. For the Nasdaq 100, the daily ATR (14) has moved above 2%, a level not seen since March and April 2025.
The Nasdaq 100 is now working off some of the bullish excess built up during the strong April-May advance, when the index rose by more than 30%. The key level for the current bullish structure is the 9 June low at 28,196 points. A break below that area would raise the risk of a deeper pullback. For the S&P 500, the comparable support level is 7,237 points.
Nasdaq 100, daily chart with stochastic and ATR %
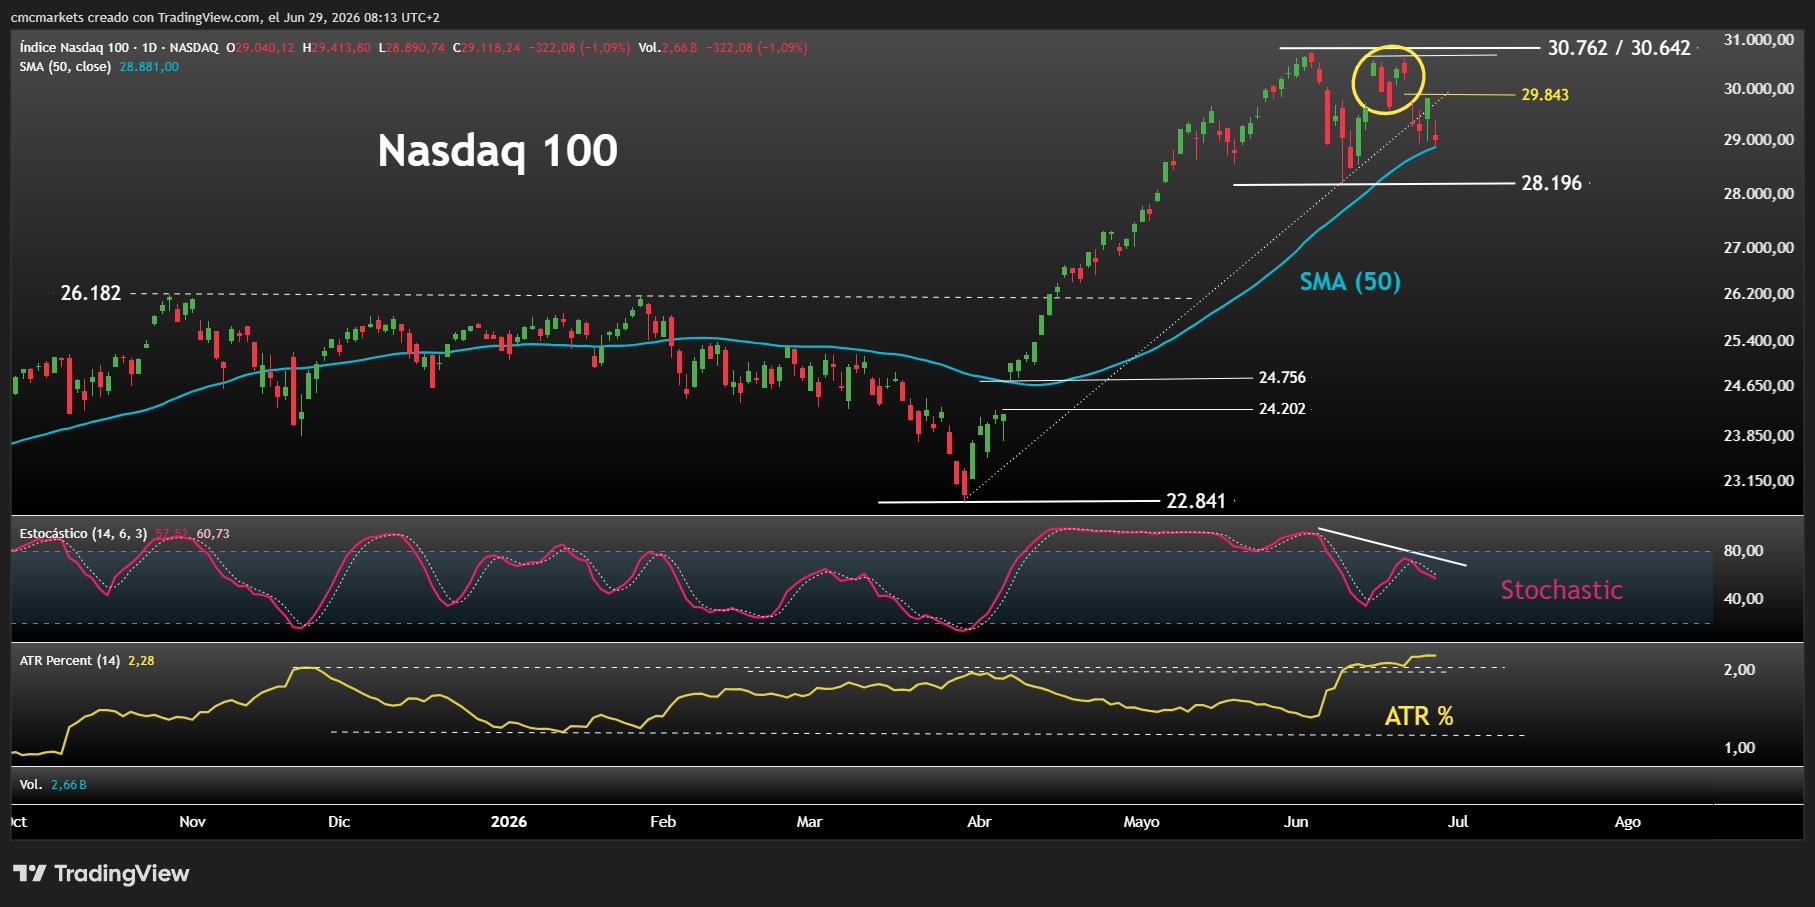
Sources: TradingView, Luis Ruiz

Silver's next big move may be lower
Silver has continued to trade sideways as implied and realised volatility cool. A break below $54 could open the door to a move towards $49.50, while reclaiming $60 would be needed to revive upside momentum.