Gold may be heading below $4,000
Oil-price volatility, higher interest rates and a stronger dollar have left gold trading in a volatile range since mid-March. A bear flag, a weaker relative strength index and lower gold volatility may suggest the metal could move below $4,000.
Founder, Mott Capital Management
Gold remains in a fragile rebound
Gold has come under pressure from oil price volatility, rising interest rates and a stronger dollar, all of which have tightened financial conditions. Since mid-March, gold has traded in a volatile range after falling from about $5,450 to $4,100.
It has since recovered part of that decline, climbing back towards $4,700-$4,800, but so far the move looks little more than a 50% retracement of the fall that began on 2 March.
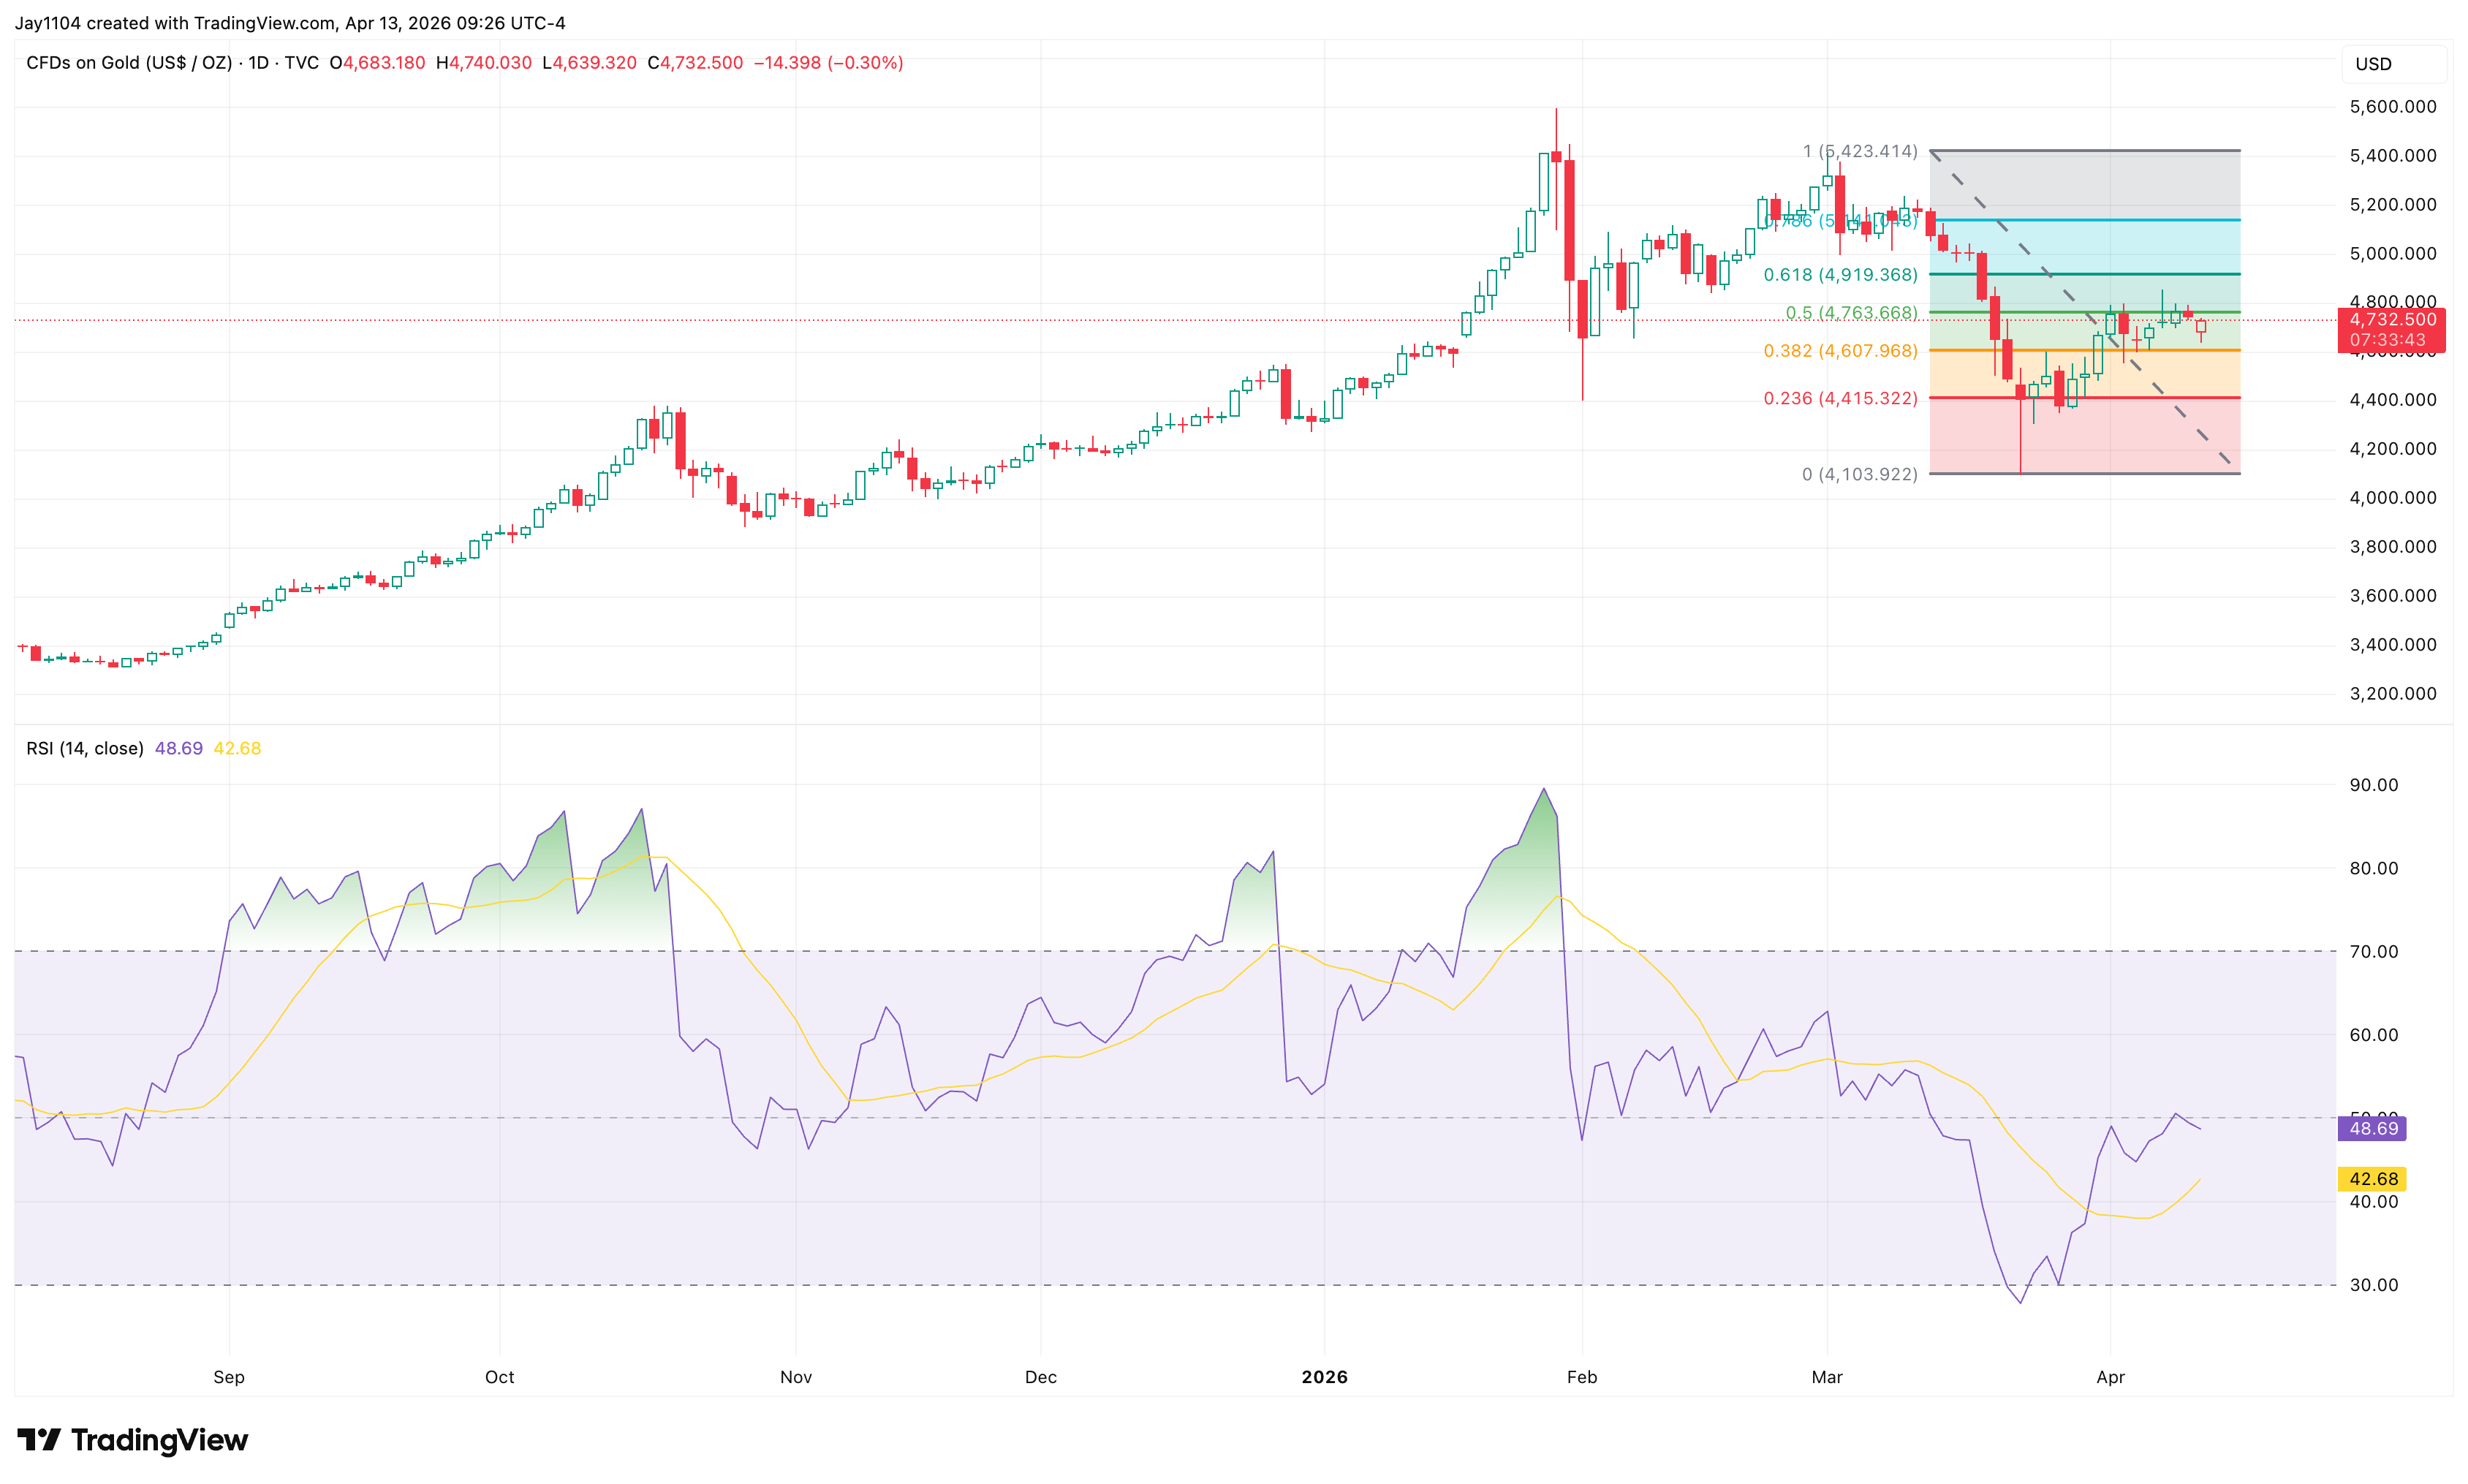
Source: TradingView. 13 April 2026
A bear flag may be taking shape
Gold may now have formed a bear flag pattern and, more importantly, may have broken below it after falling through the uptrend that began on 23 March. If that interpretation is correct, it would suggest gold could fall materially in the coming days and weeks. The pattern itself suggests gold may fall below $4,000 if it plays out to completion.
The trend in the relative strength index (RSI) also suggests gold may be heading lower. The RSI peaked in late January and has been trending lower since then, an important sign that the overall trend in gold may have shifted from bullish to bearish.
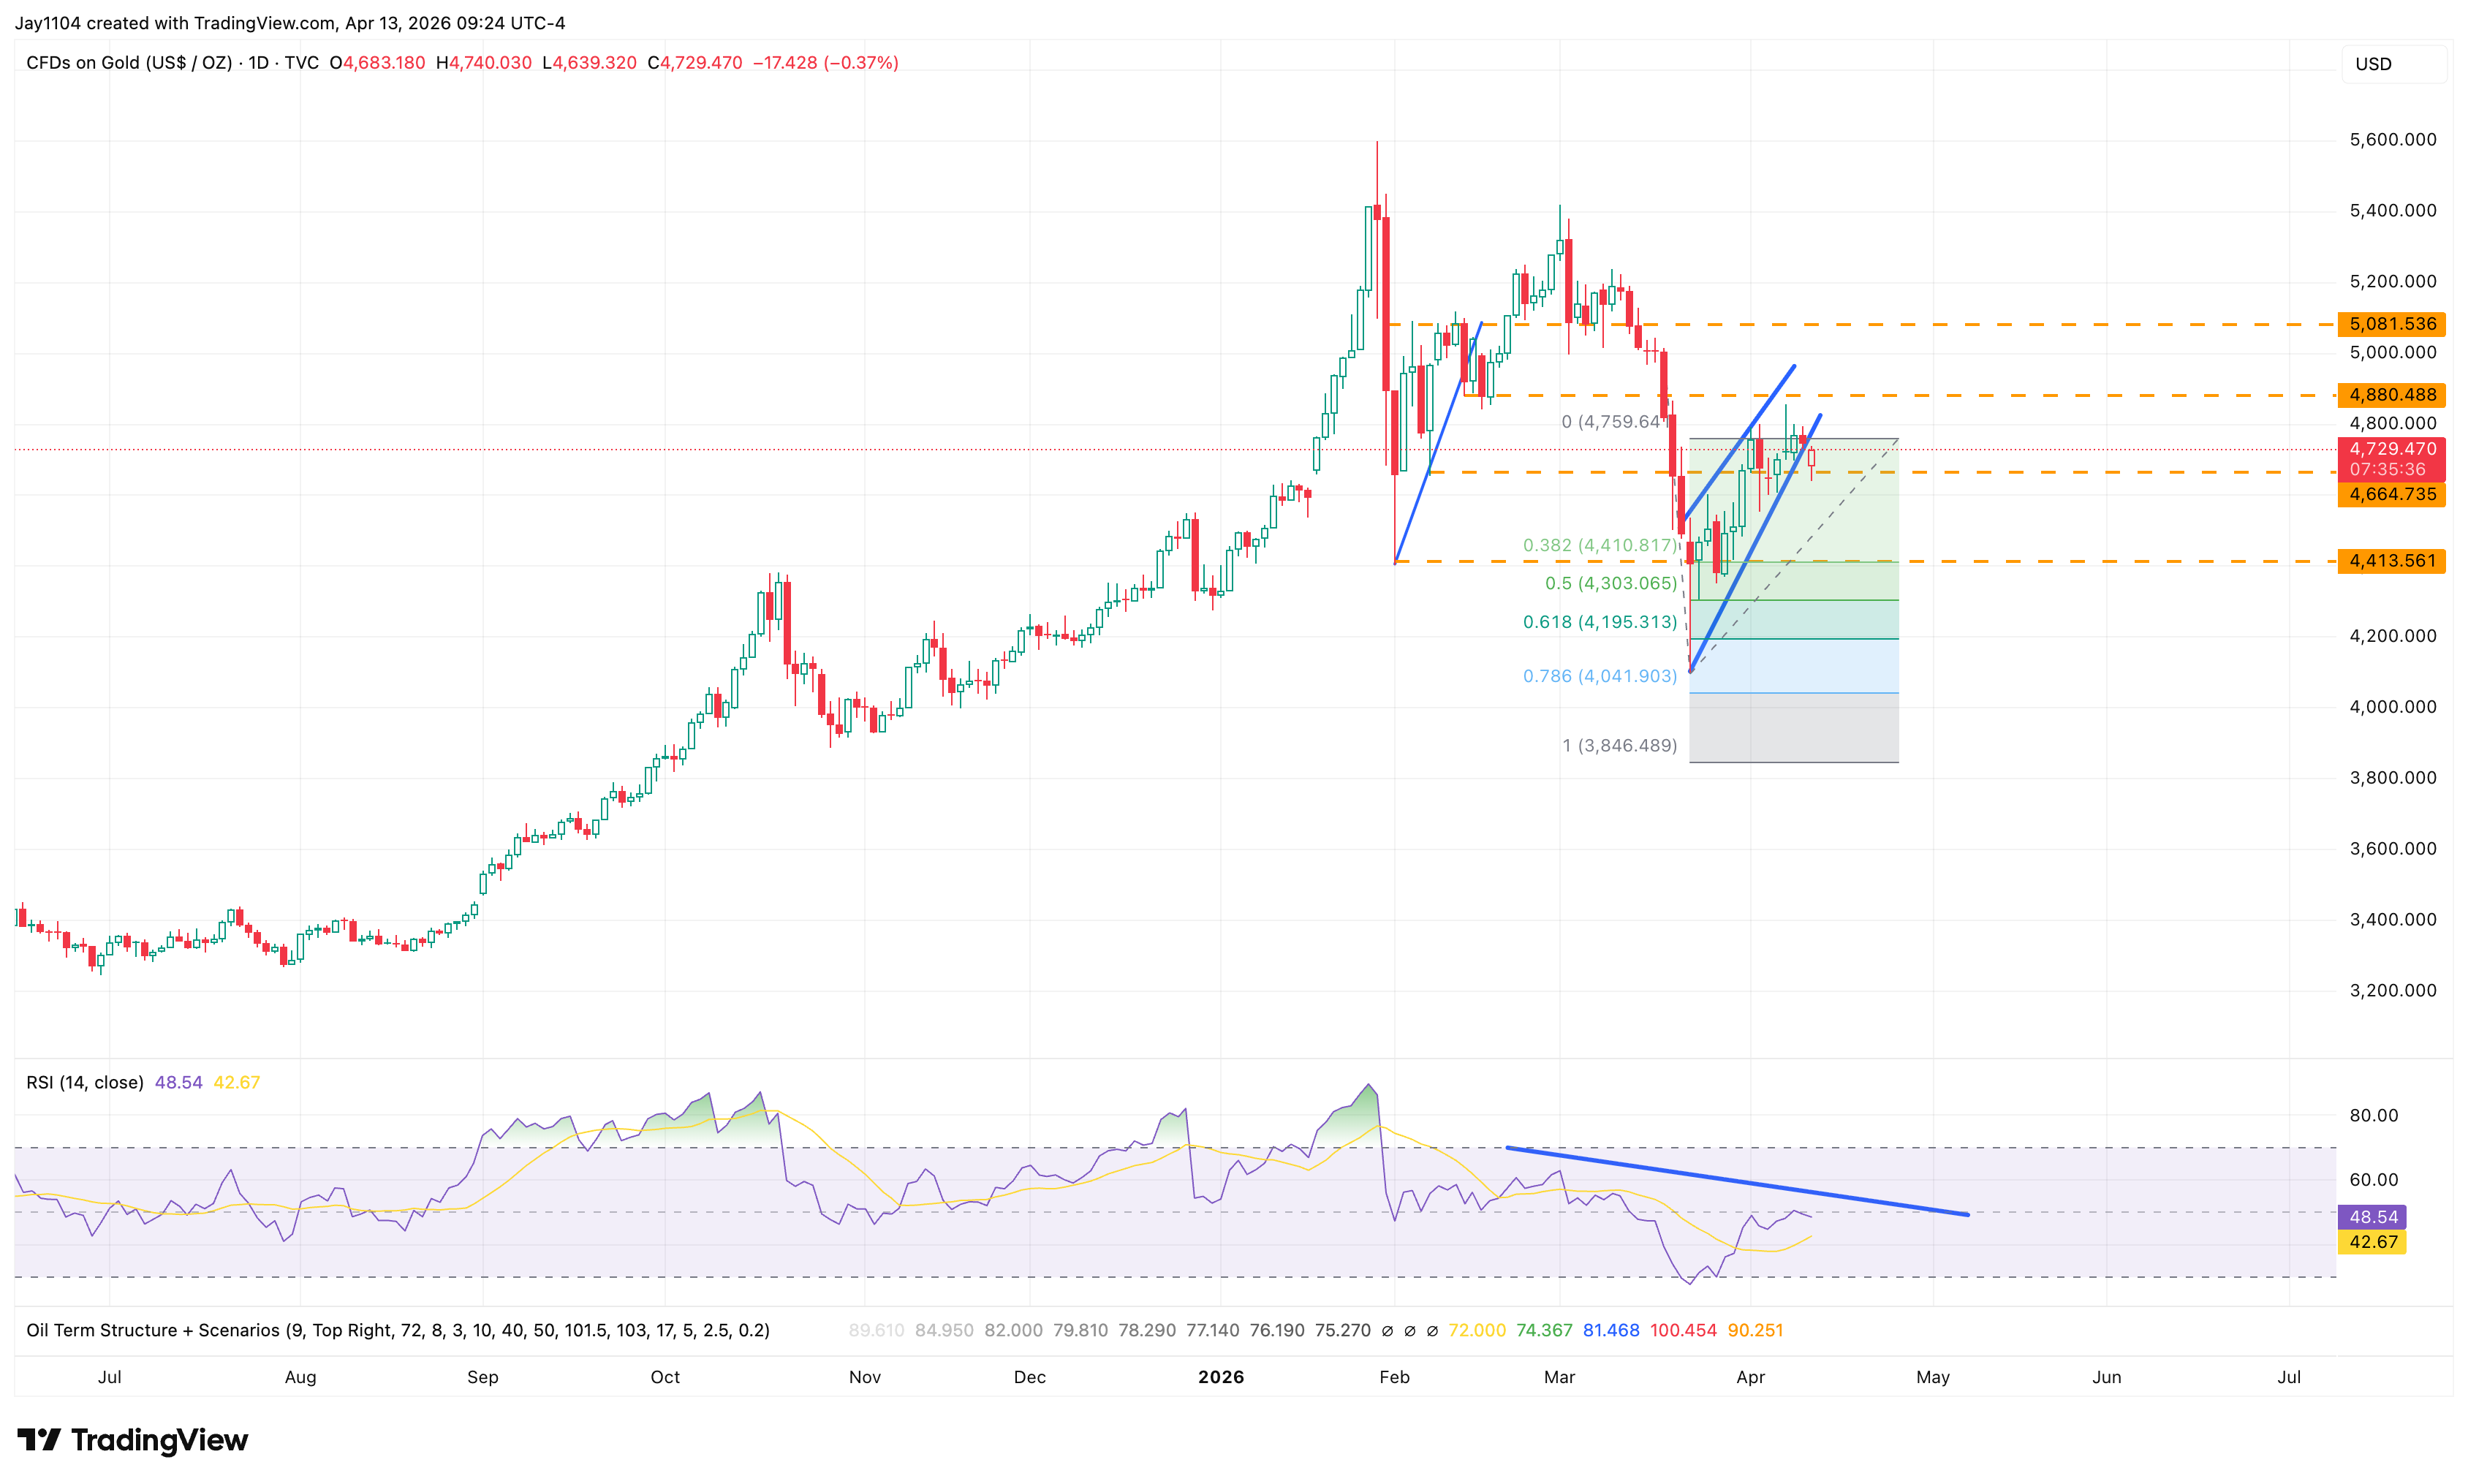
Source: TradingView. 13 April 2026
Volatility may confirm the bearish case
It is also worth noting that the CBOE Gold Volatility Index has fallen to about 30.5. This remains an important indicator to monitor. If implied volatility in gold continues to fall, it would help confirm any bearish move in the spot gold price.
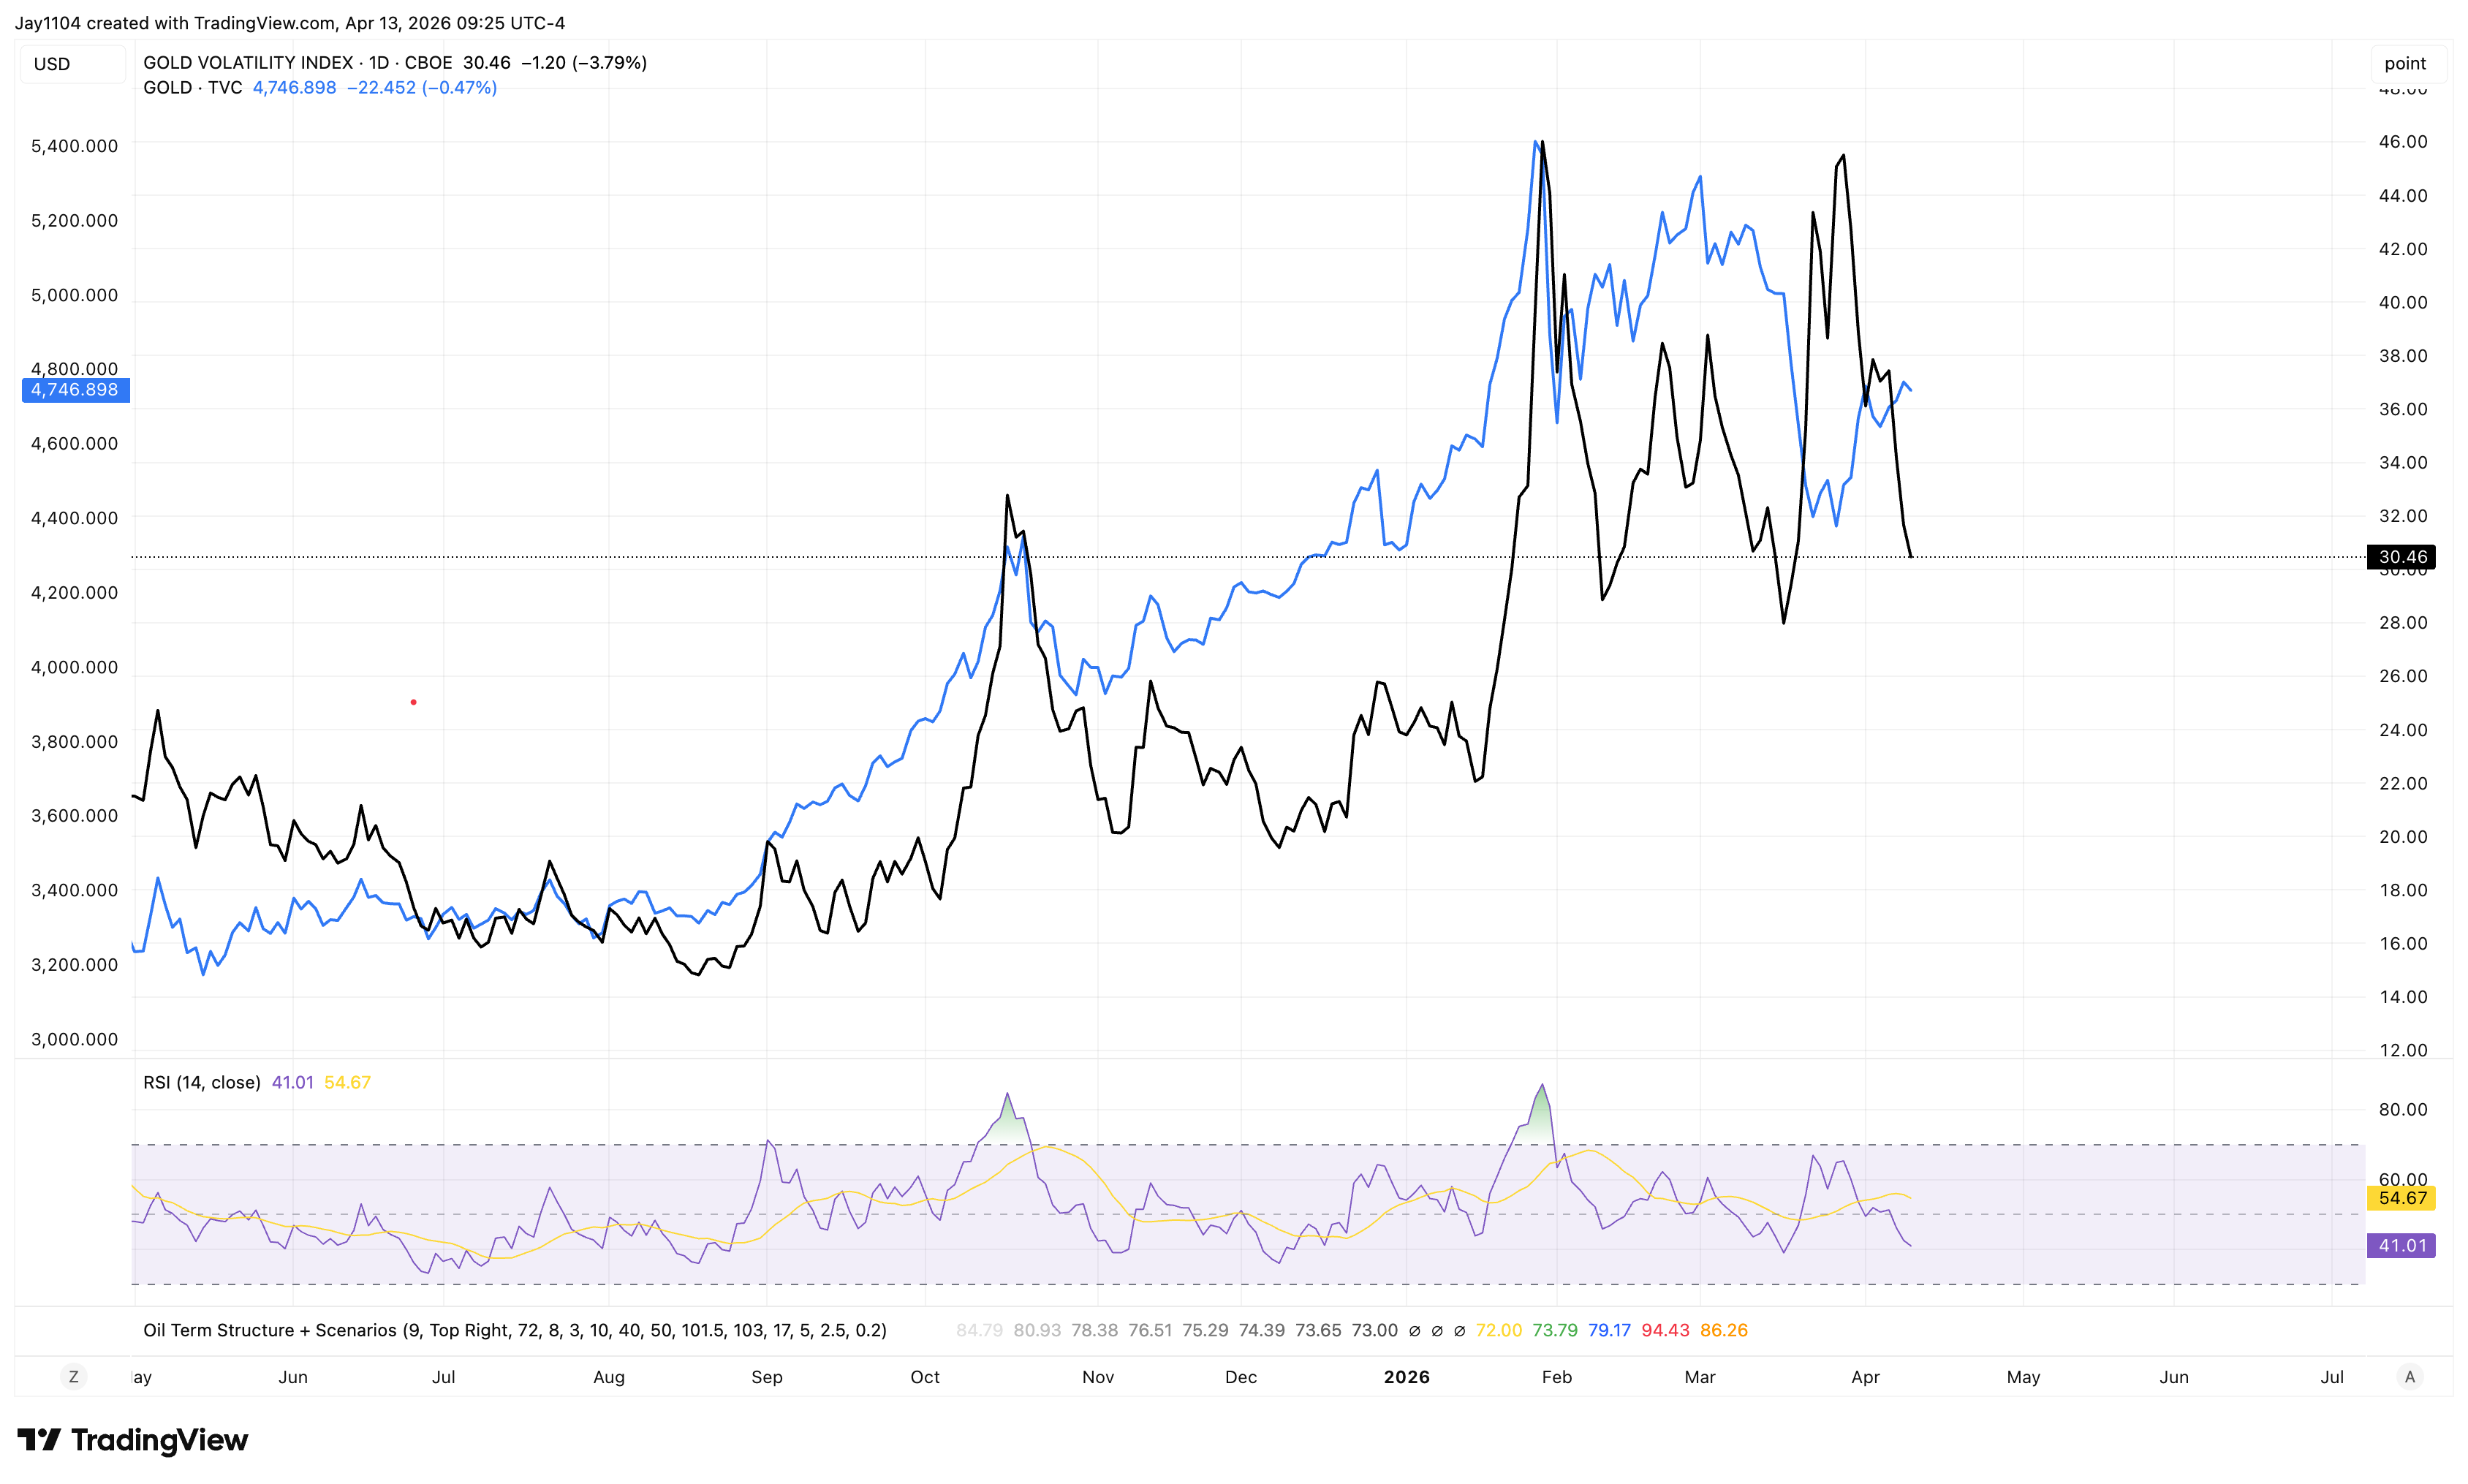
Source: TradingView. 13 April 2026

Gold rebounds from the 200-day SMA after clearing excesses and acting as a source of liquidity during the war
Gold is rebounding from its 200-day simple moving average after a sharp pullback driven by deleveraging, exchange-traded fund outflows and liquidity demand during the Iran war. The move suggests the longer-term uptrend may still be intact, although positioning and macro stress remain important near-term drivers.
US CPI at 14:30 may act as a near-term catalyst for the USD and S&P 500
US March CPI is due at 14:30 on Friday in an environment of elevated liquidity stress. The release may act as a near-term catalyst for the USD and S&P 500, with markets especially sensitive to core inflation.

Trump and Bessent under pressure as weak Treasury demand weighs on the S&P 500
Demand for US Treasuries is weakening despite higher yields, draining liquidity from equities and leaving Donald Trump and Scott Bessent with less room for manoeuvre. With 10-year yields near 4.50%, pressure on the S&P 500 may intensify if bond auctions fail to reassure the market.