
Dangerous pullback in S&P 500 and Nasdaq 100: will FOMO and TACO trade return?
S&P 500 and Nasdaq 100 perform a pullback to previous resistance levels. Divergences, overbought conditions, lack of breadth, and VIX approaching 20% may negate FOMO and the TACO trade. Read the analysis
Market Analyst
Exhaustion formations in the bullish trend
The falls in US indices last Friday triggered bearish engulfing patterns on the weekly charts. These formations point to fatigue in the previous bullish trend and have pushed daily price oscillators lower against their signals. In many cases, bearish divergences have also appeared and overbought levels remain elevated.
US NDAQ 100 on a daily chart with MACD, extracted from Next Generation on 14 October 2025
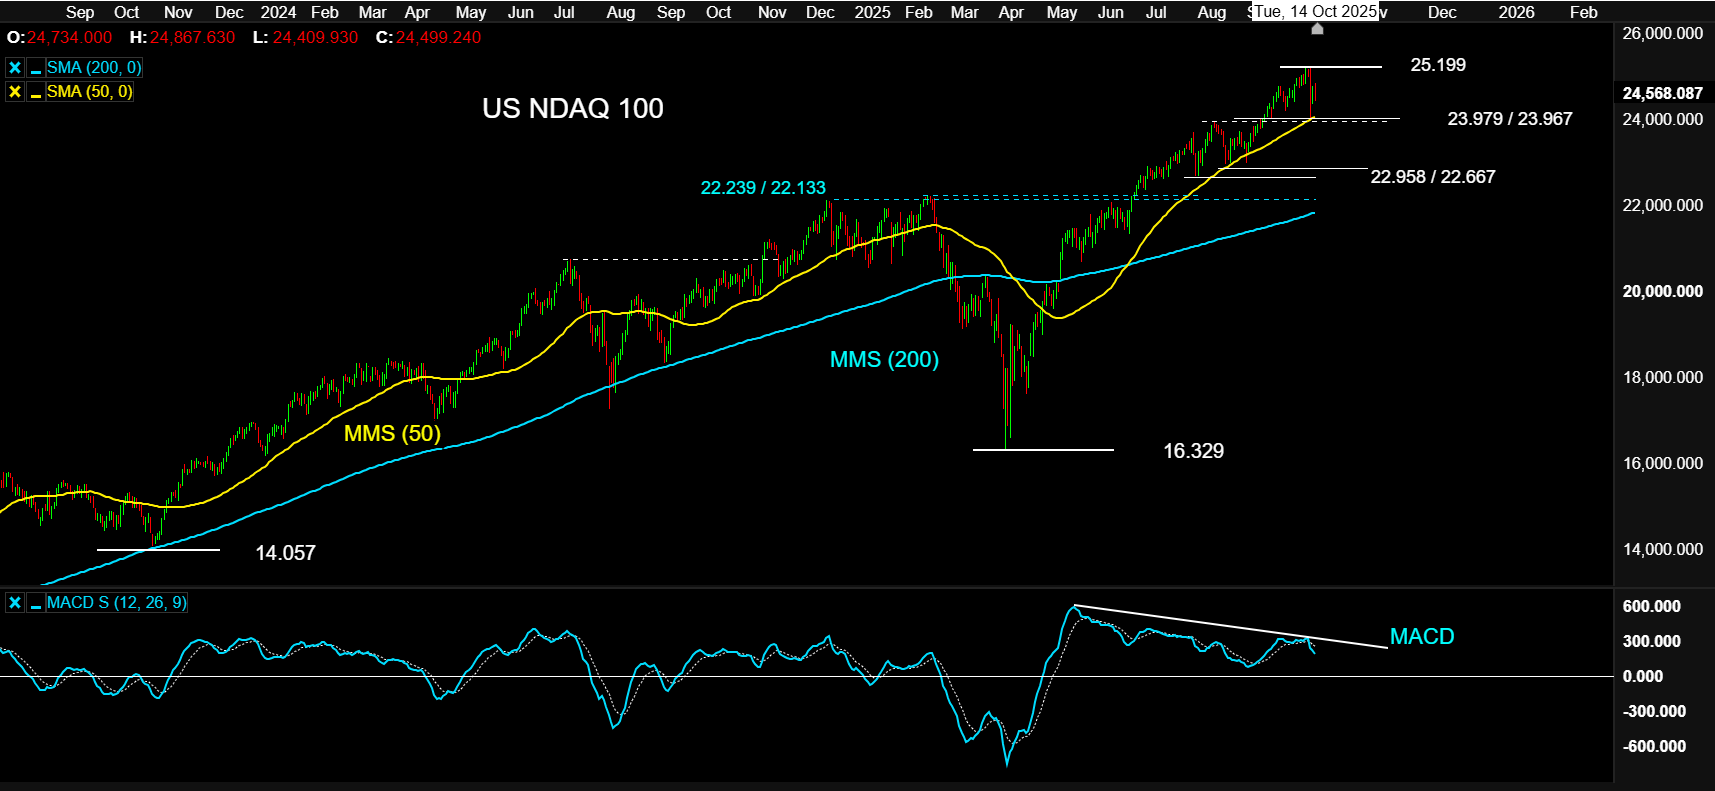
For now, pullback to the SMA (50) and August 2025 highs
Friday's fall was broad, although it was somewhat magnified because the market had become used to very narrow trading ranges. Even so, the indices have so far found support at the first reasonably meaningful support levels.
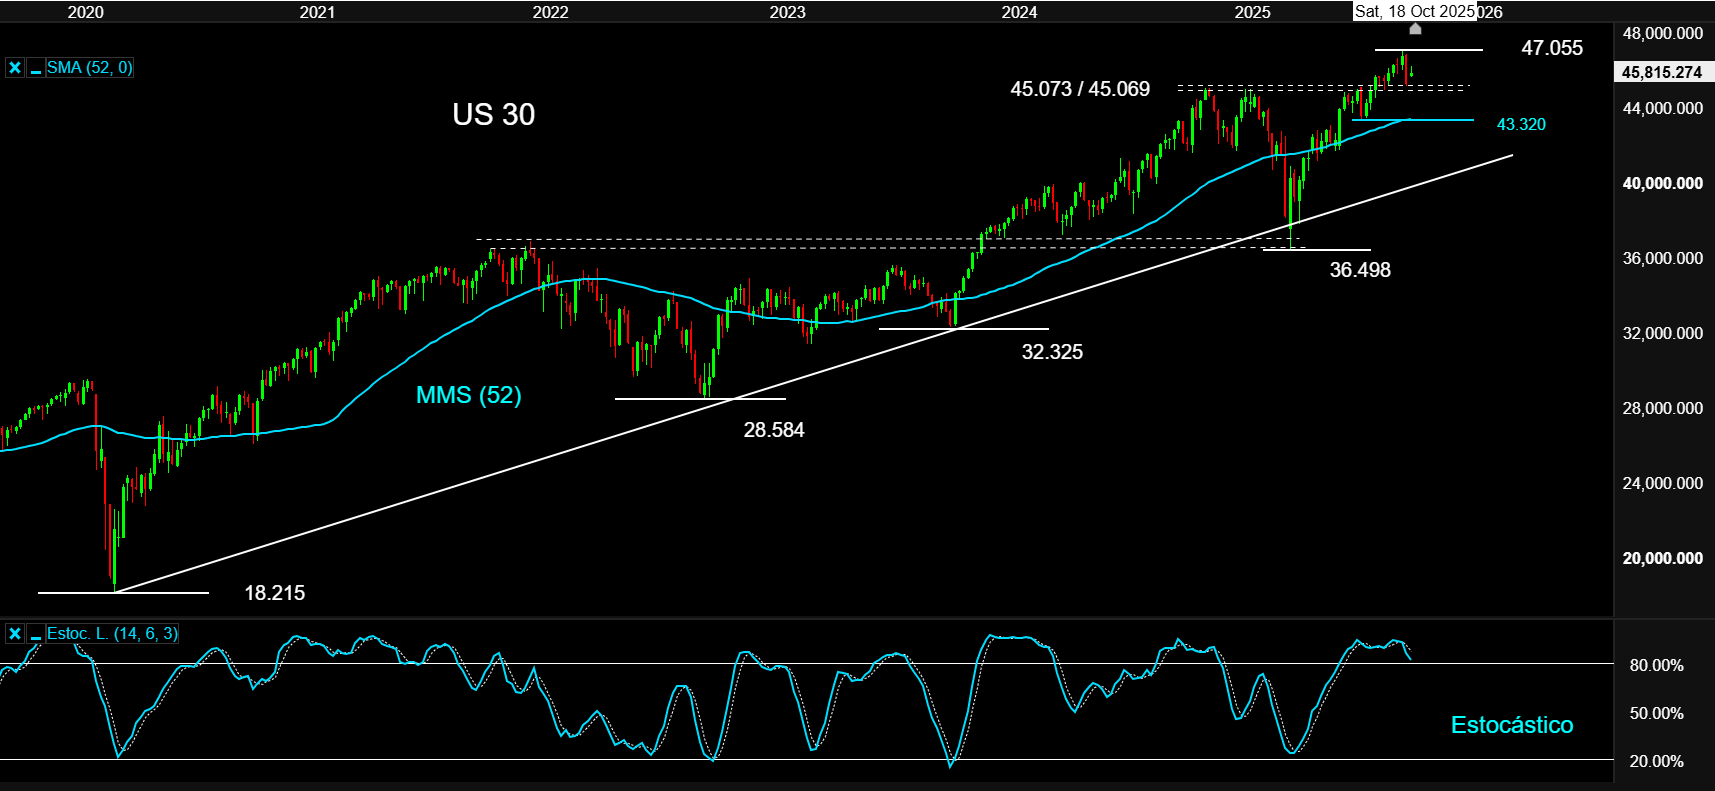
The SMA (50) and the August 2025 highs, previous resistance levels that have now become support, have managed to halt the falls in the US NDAQ 100, US SPX 500 and US 30. As long as these supports hold, the correction may still be interpreted as a pullback towards important levels.
That pullback may tempt some traders to rejoin the underlying bullish trend from a short-term perspective. It is a familiar pattern from recent months, especially for traders drawn in by the TACO trade and fear of missing out (FOMO).
US 30 on a weekly chart with stochastic, extracted from Next Generation on 14 October 2025
Concentration and lack of breadth
There are, however, signs of maturity in the broader bullish trend that argue for caution and make this pullback look more dangerous.
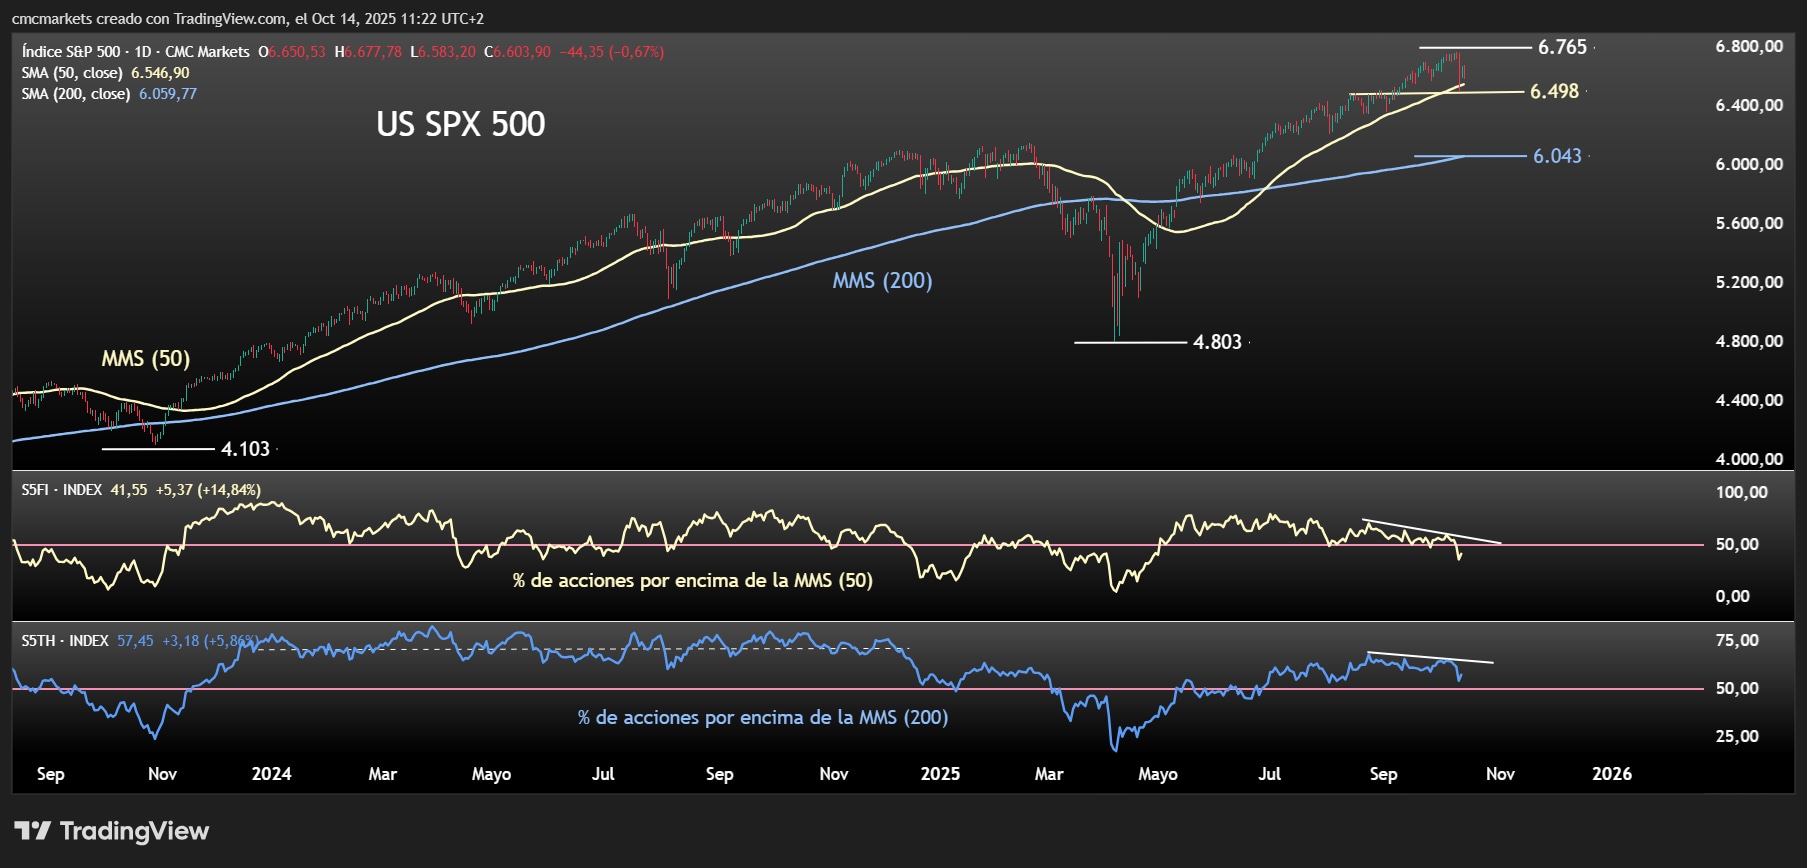
The lack of breadth is one of the clearest divergences. The gains have been concentrated in a small number of stocks, while many others have fallen behind. One way to see this is to look at the percentage of stocks trading above the most widely followed moving averages.
In the case of the S&P 500, and using the data published by Barchart, the index remains above the SMA (50), but most of its constituents are already trading below it.
US SPX 500 on a daily chart. In yellow: SMA (50) and the percentage of stocks above the SMA (50). In blue: SMA (200) and the percentage of stocks above the SMA (200), extracted from TradingView on 14 October 2025
Overbought conditions and VIX near 20%
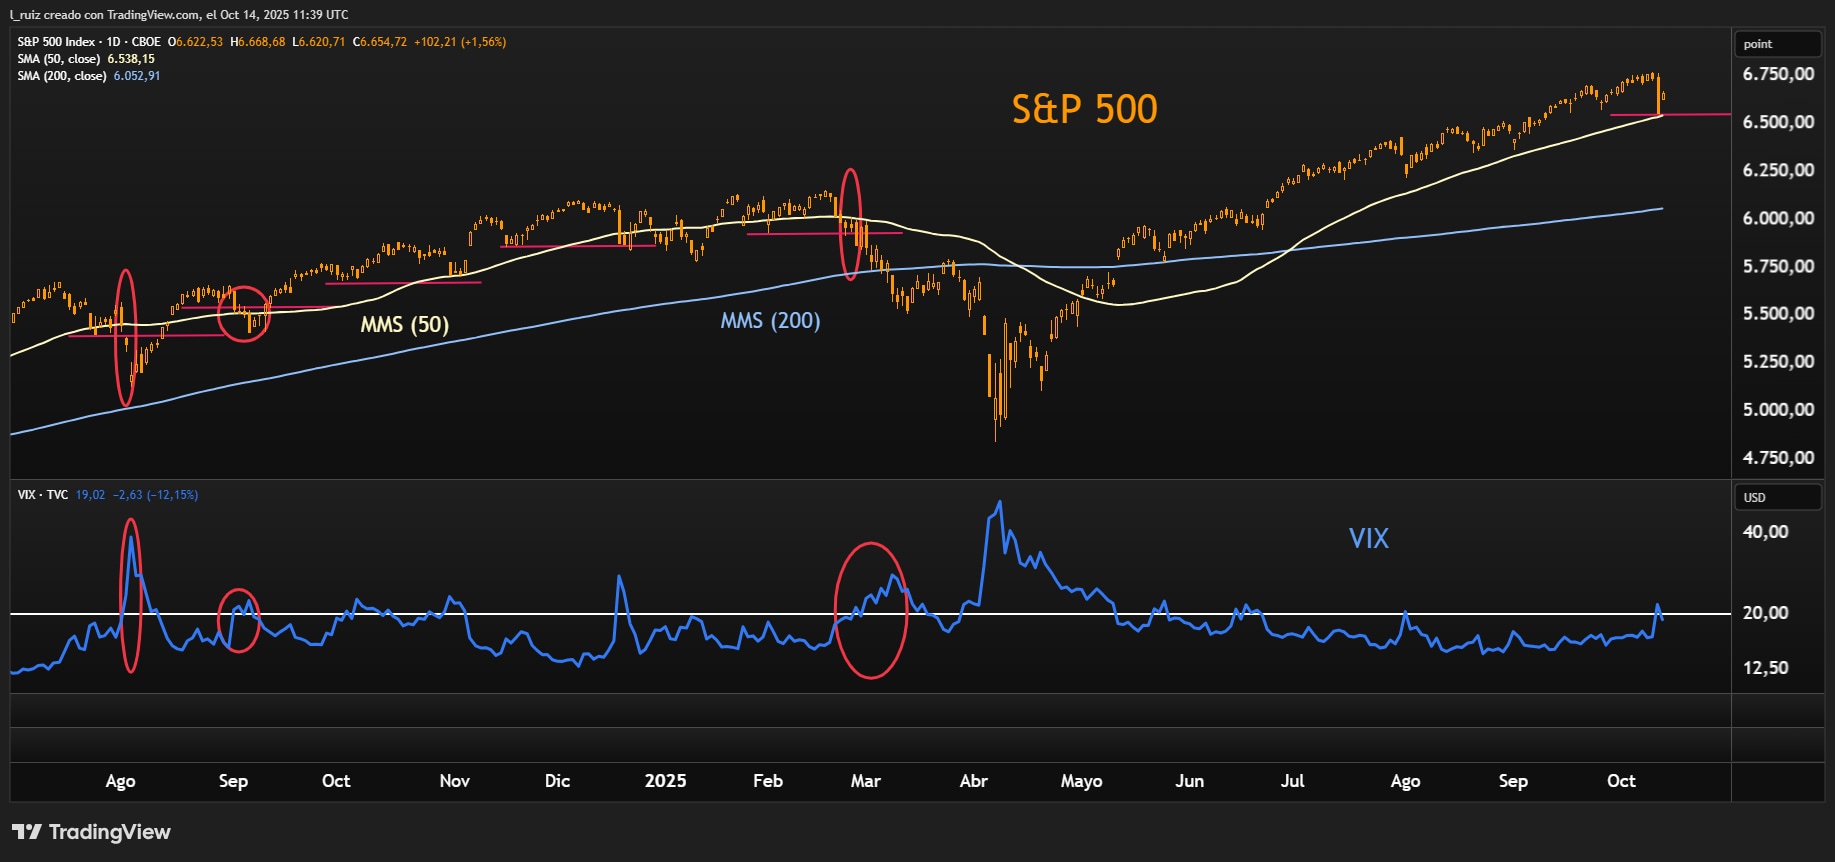
Overbought conditions are another excess that may still need to be unwound. The distance between the indices and the SMA (200) is around 6% for the US 30 and 11% for the US NDAQ 100. That is an attractive gap for traders looking for a deeper correction and a reversion towards the long-term average.
The distance from support and the overbought backdrop may increase selling pressure if the lows from last week are broken. That kind of break may look more reliable if it is accompanied by the VIX moving decisively above the 20% threshold it is currently testing.
S&P 500 on a daily chart with VIX, extracted from TradingView on 14 October 2025

DAX seen opening slightly lower as Fed keeps rate hike option alive
The DAX is expected to open modestly lower after the Federal Reserve left rates unchanged but kept further tightening on the table, while investors digest mixed results from Meta, Microsoft and Airbus ahead of a packed macro calendar.