2018 redux signals volatile second half for 2025 markets
Founder, Mott Capital Management
The second half of 2025 is likely to see an increase in volatility as the market begins to digest the economic impacts of the global trade war that started in April.
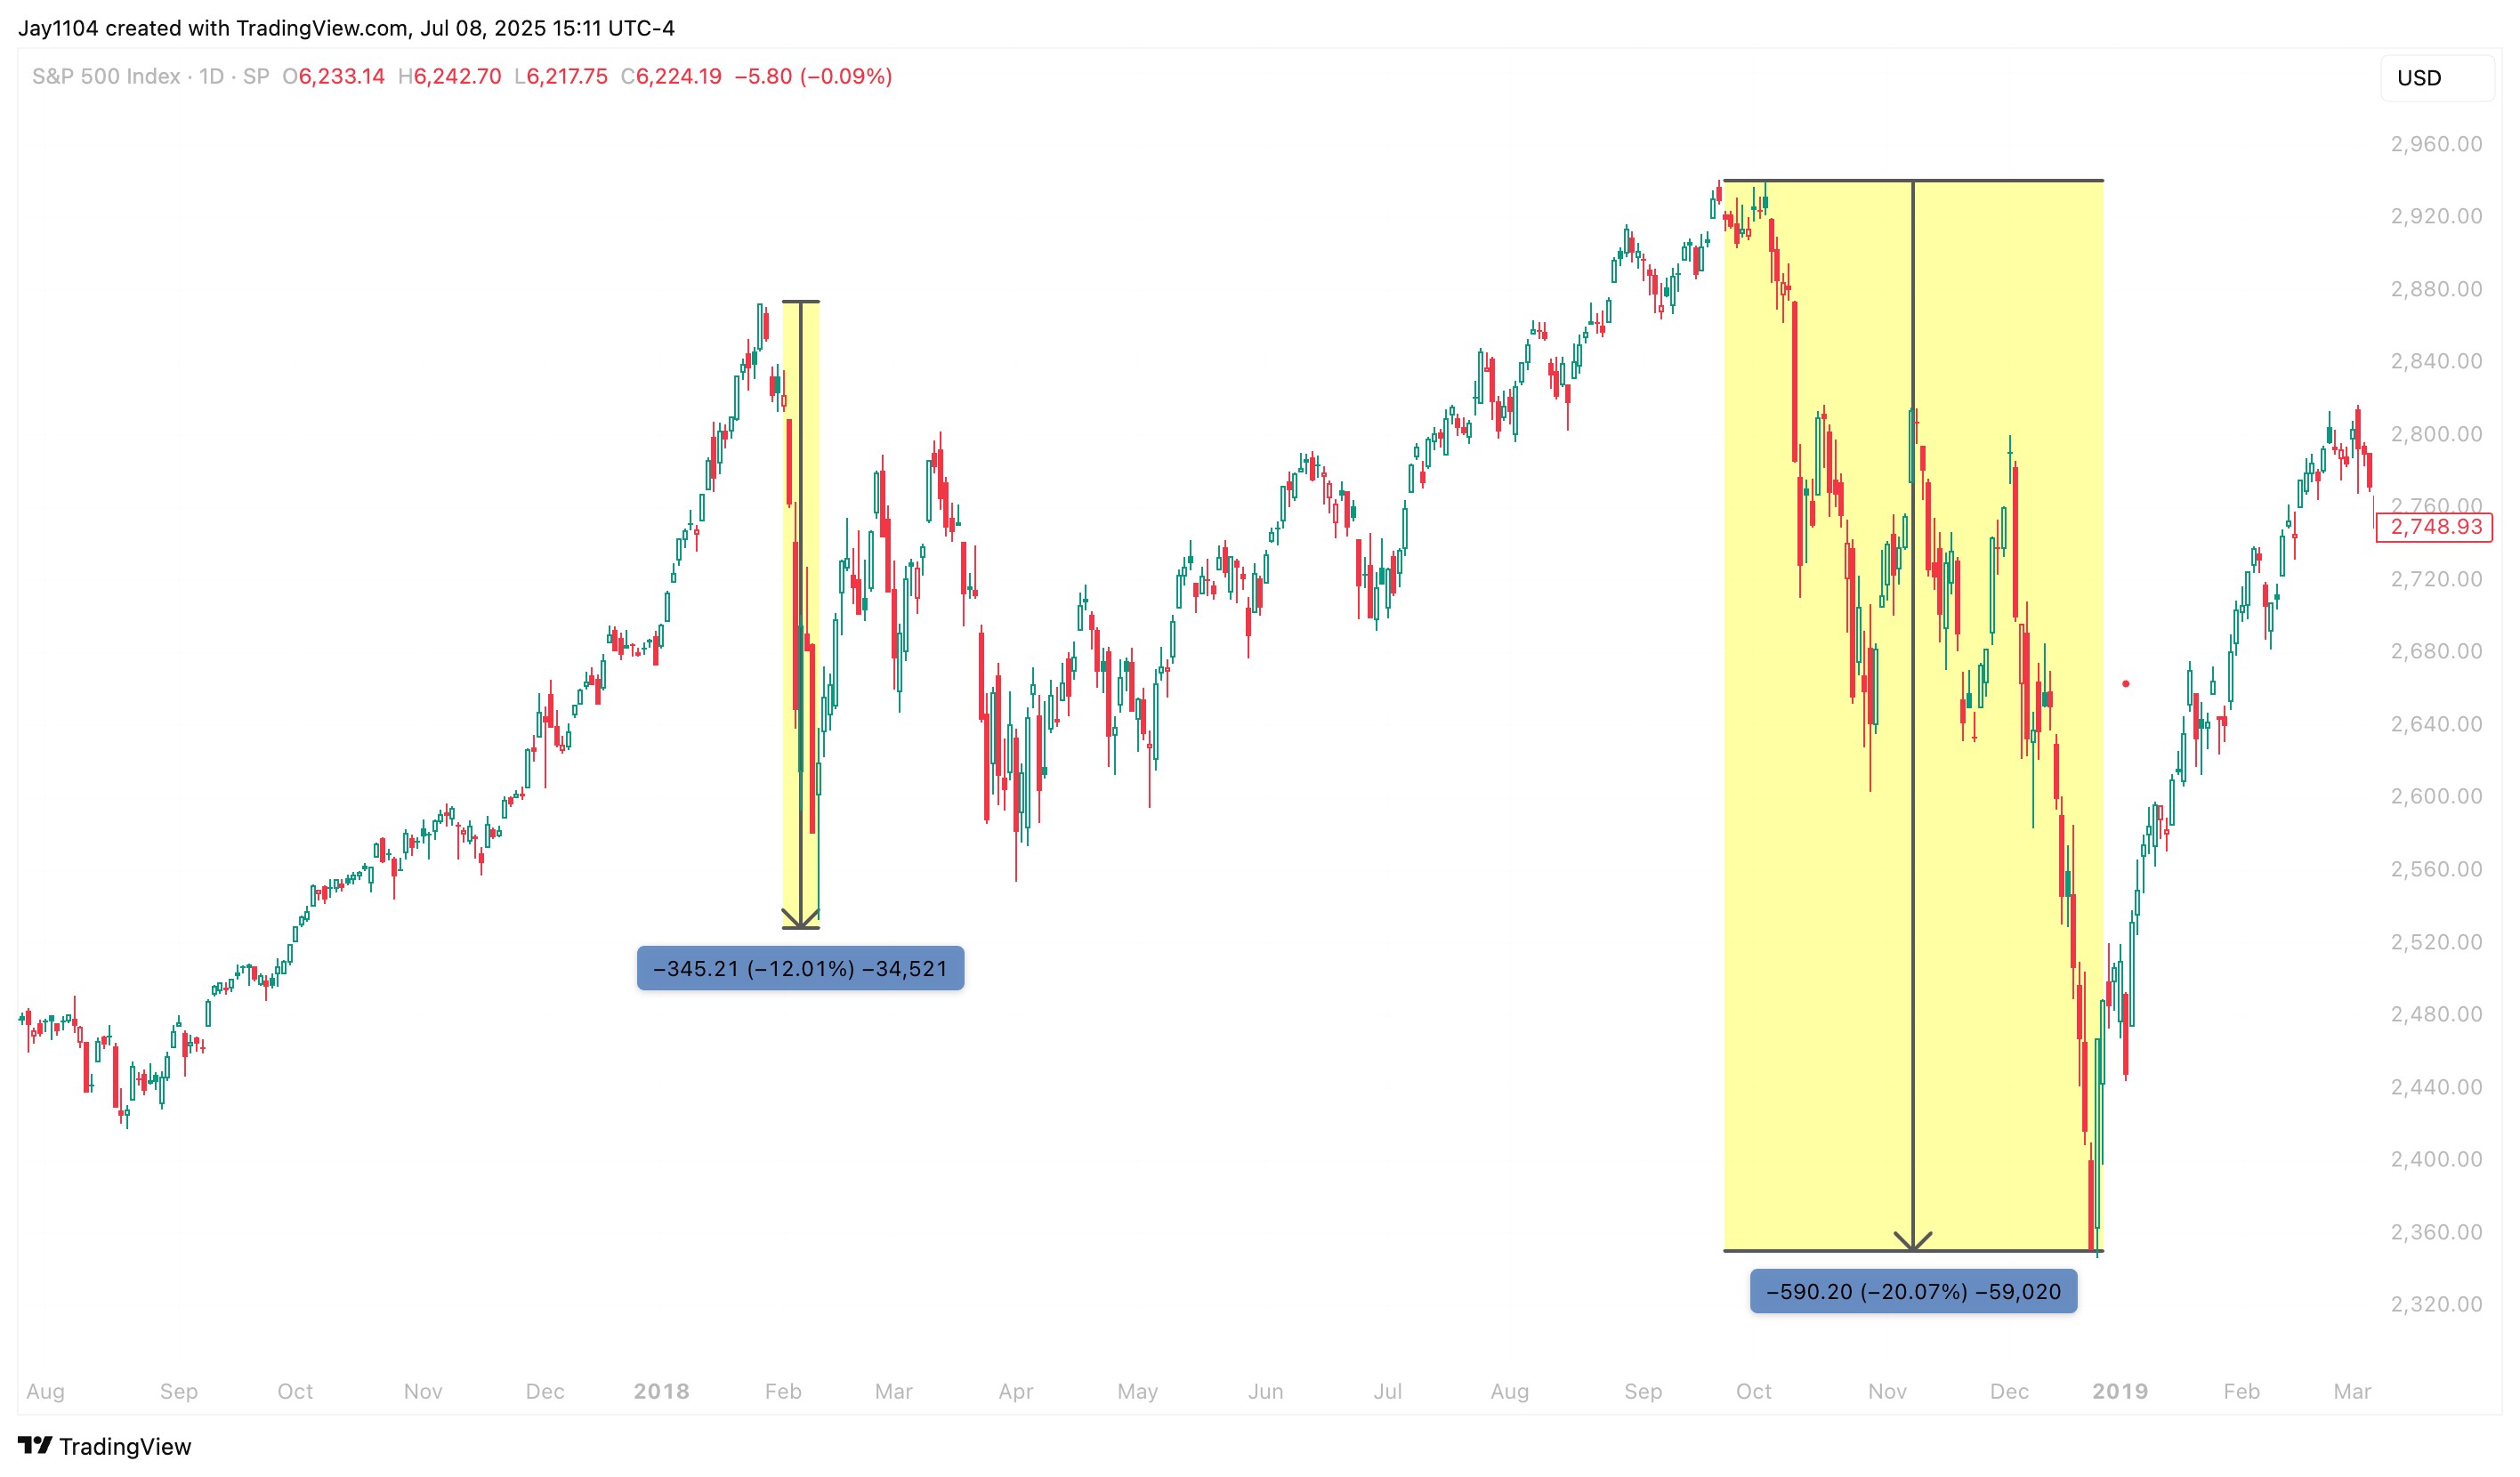
History tends to repeat itself, and if that is the case, the damage from the current trade war may not become apparent until the second half of 2025. This scenario mirrors what occurred in 2018, when a combination of tariff effects from Trump’s initial trade dispute with China, alongside a Federal Reserve that was slow to cut rates despite clear signs of an economic slowdown, triggered a sharp sell-off in equities towards the end of the year.
Ultimately, we should expect increased volatility during the second half of the year, not just in the stock market, but also in interest rates, currencies, and commodities.
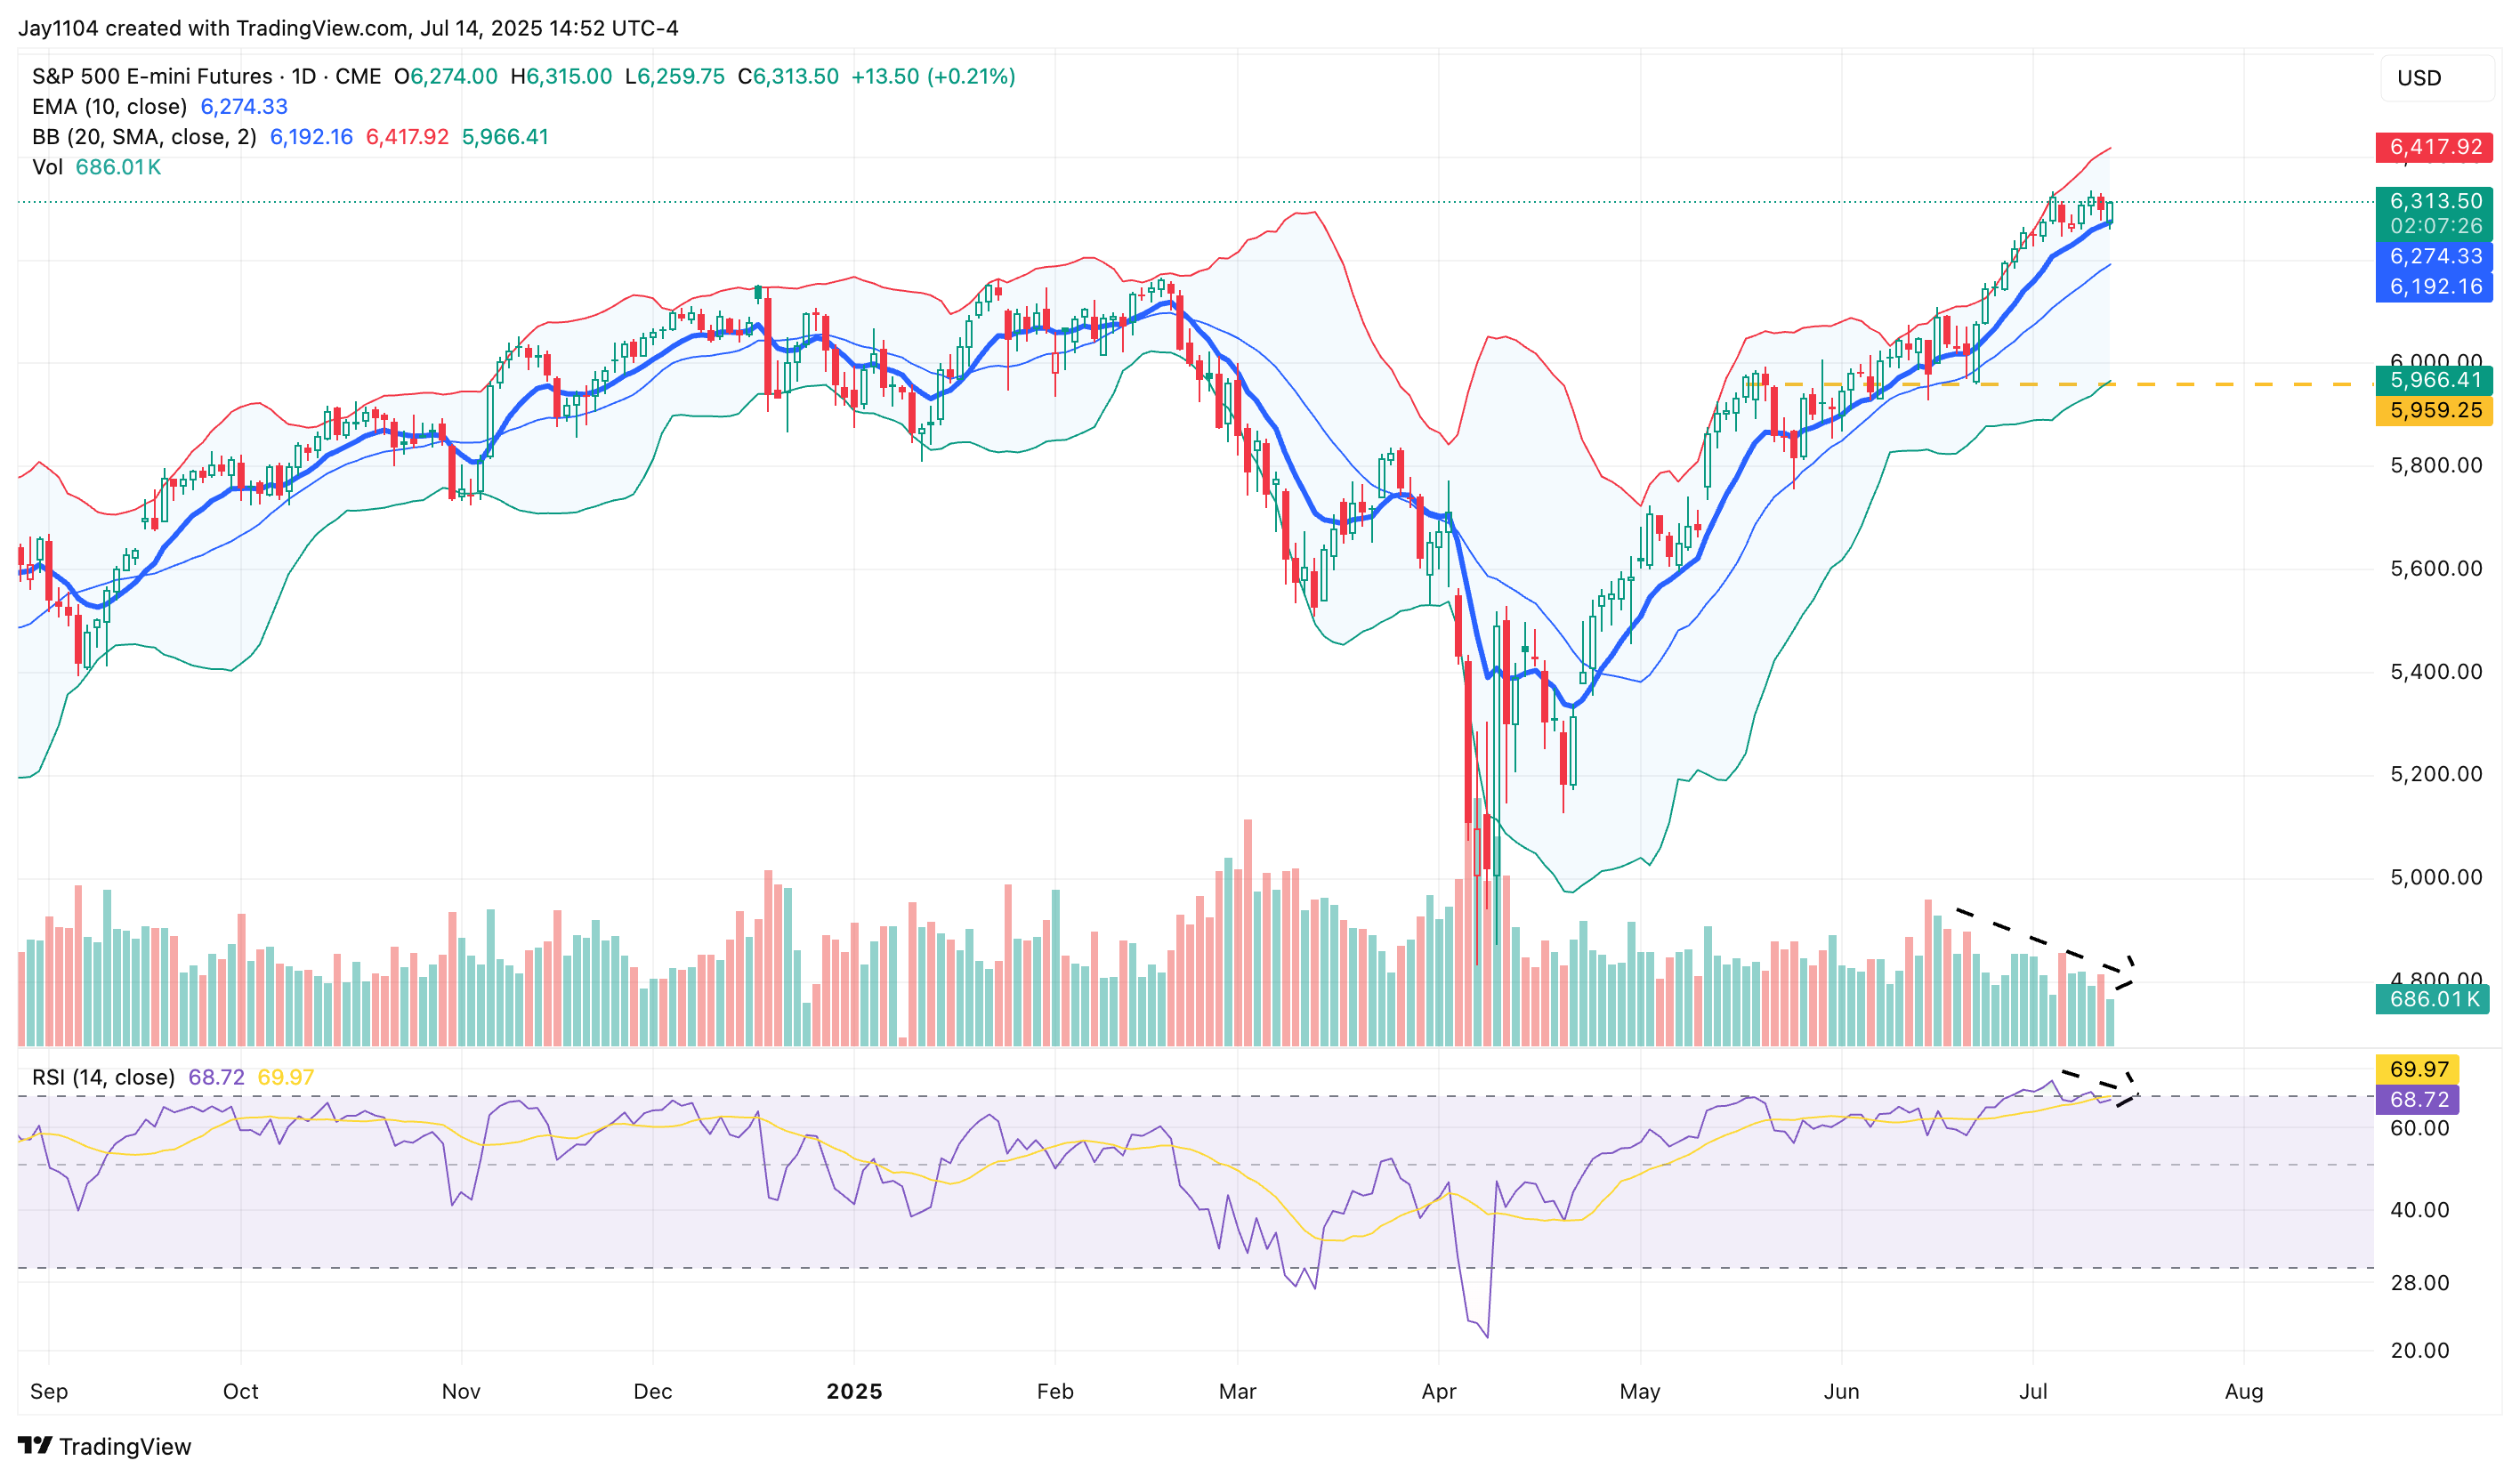
The S&P 500 futures find themselves in a precarious position after becoming overbought, with prices exceeding the upper Bollinger band and the Relative Strength Index (RSI) rising above 75. Although the futures contracts have consolidated sideways, the RSI has started to trend lower, and volumes have steadily declined, suggesting buying interest may finally be waning.
Should the S&P 500 futures fall below their 10-day exponential moving average, it would indicate that sellers are beginning to take control. This scenario could lead the futures to pull back towards a support region around the lower Bollinger band and the 16 May highs near 5,965.
Given the recent surge in AI and technology stocks, along with new tariffs imposed on Japan and South Korea, as well as a 50% tariff on copper and potential tariffs on Taiwan, the risk of a severe backlash in the technology sector in the second half of the year is heightened.
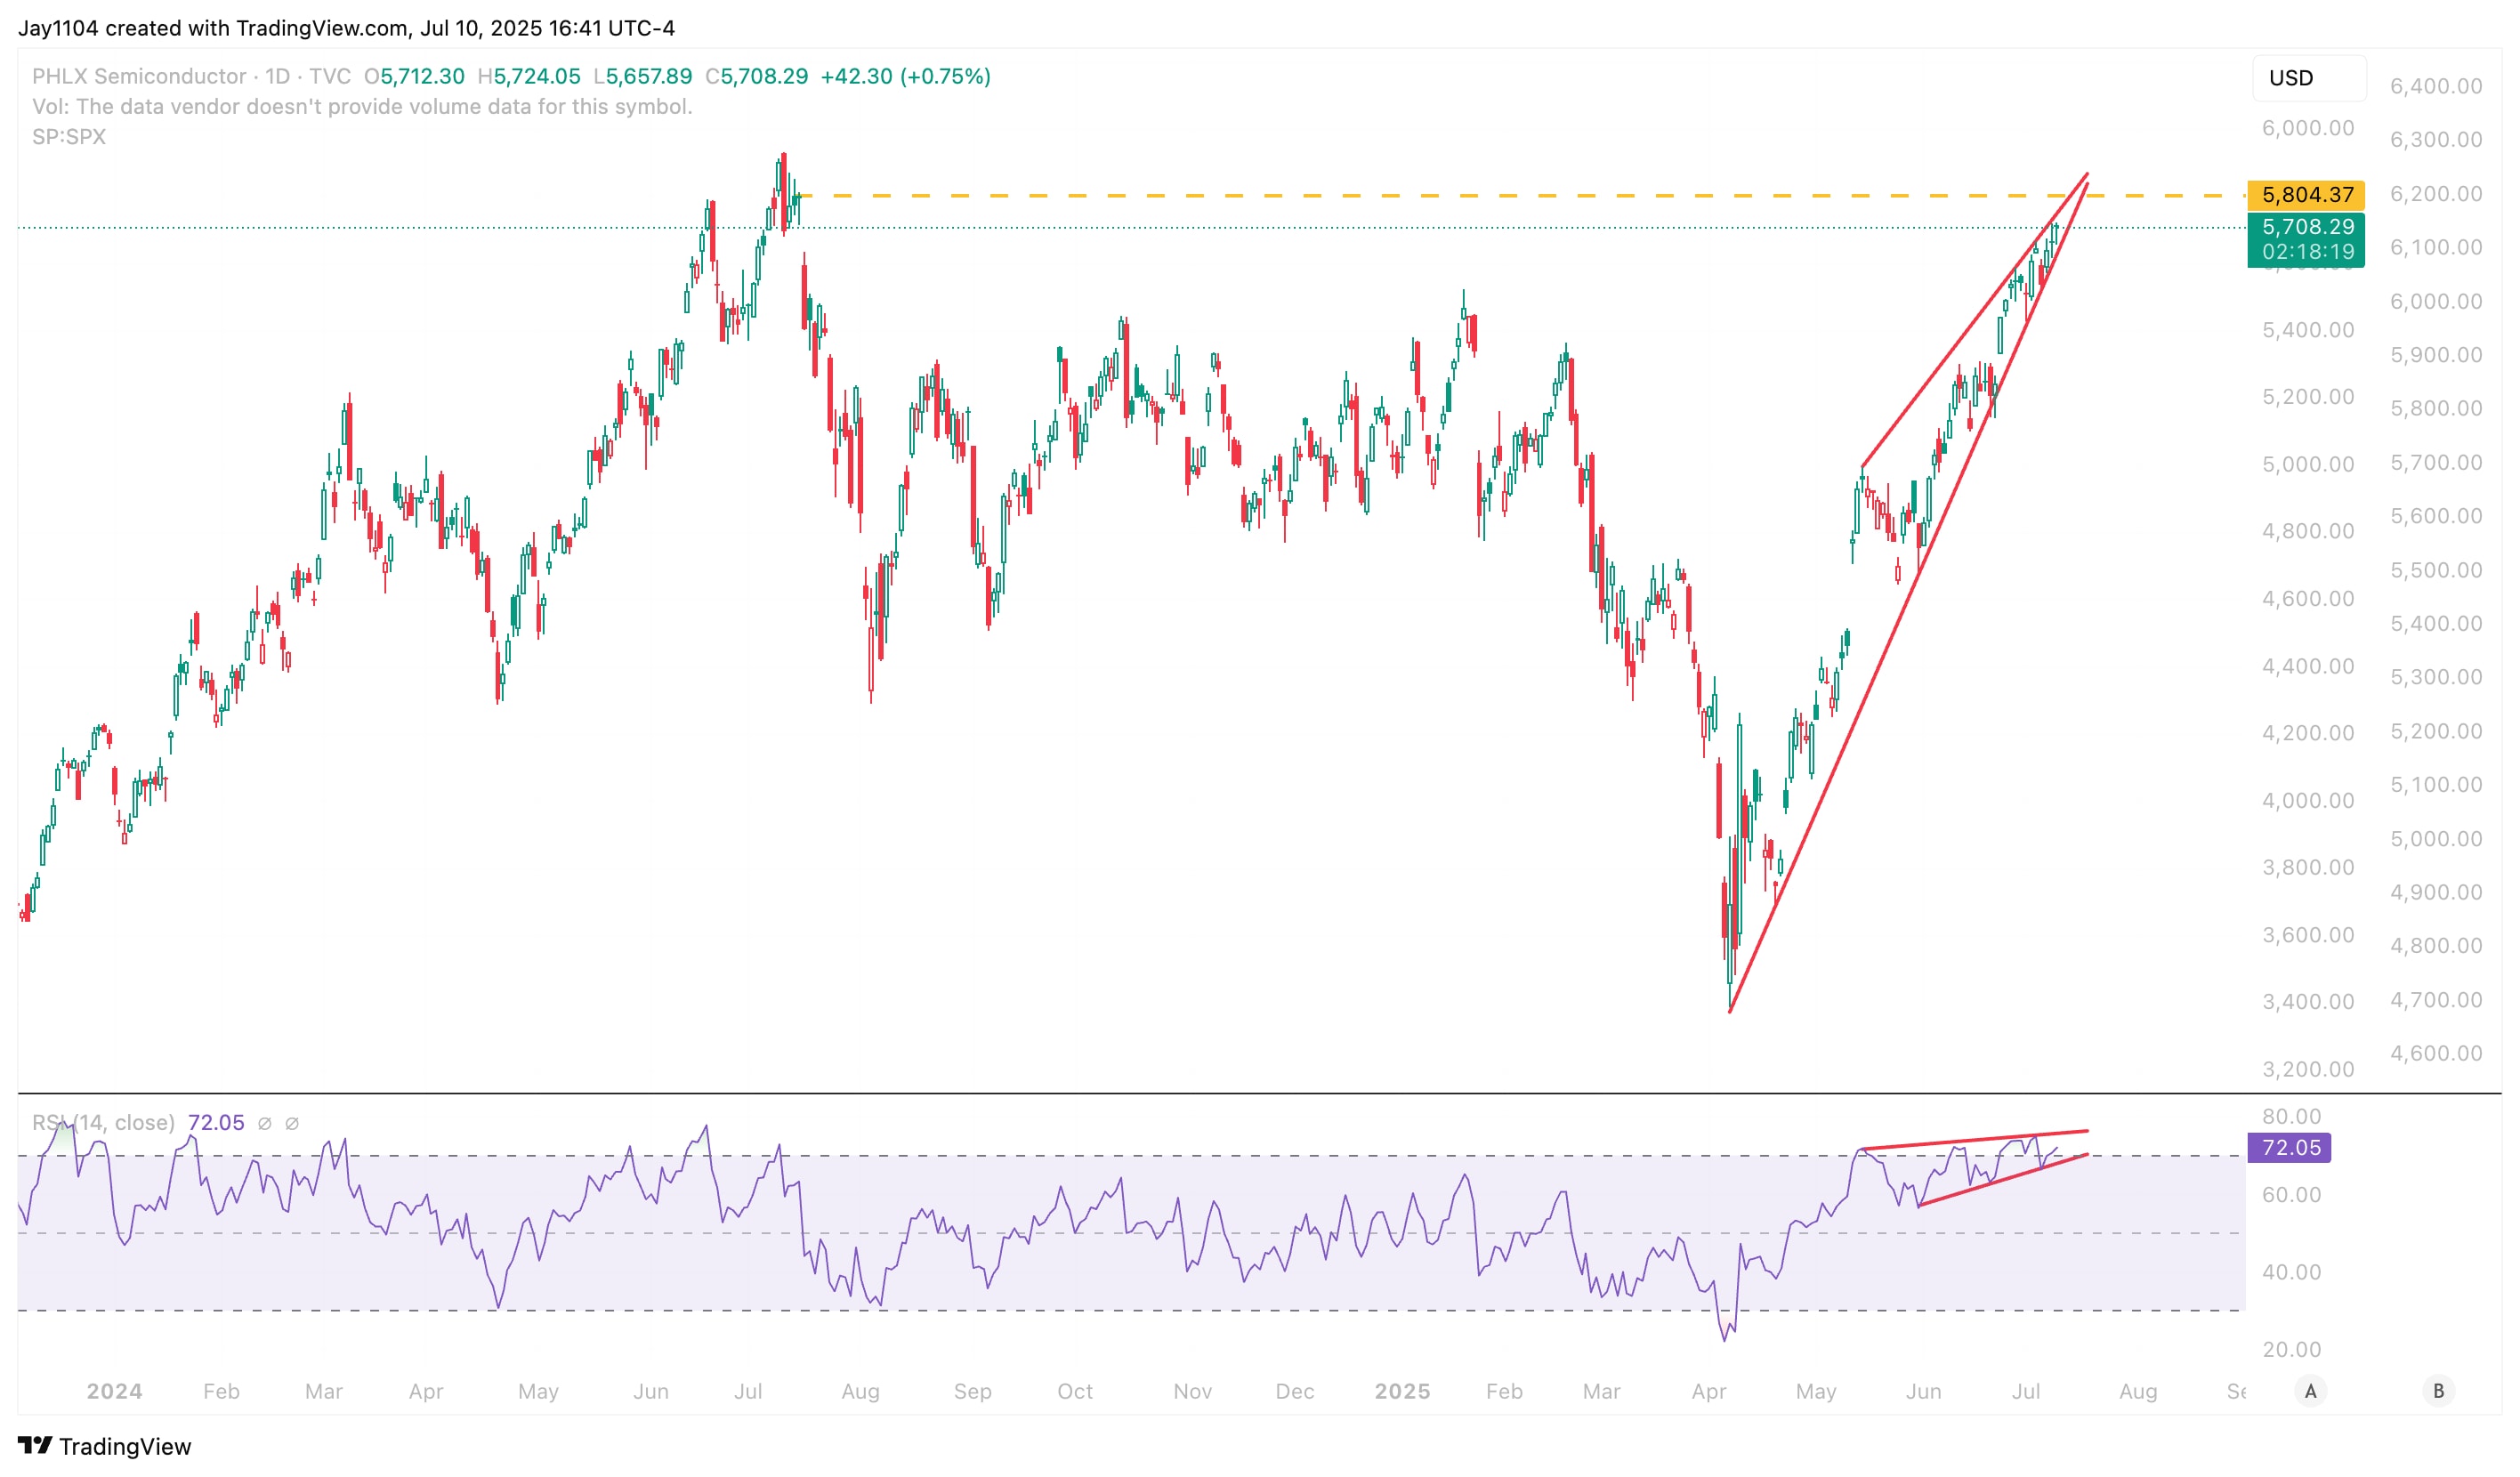
The PHLX Semiconductor Index (ETF: SOXX) has been trending upward and, notably, appears to be forming a rising wedge pattern as it attempts to fill a gap from July 16, 2024. Significantly, this rising wedge pattern is also evident in the Relative Strength Index (RSI). A break below this uptrend would not only indicate a possible trend reversal but also signal the breakdown of the rising wedge, implying substantial downside risk.
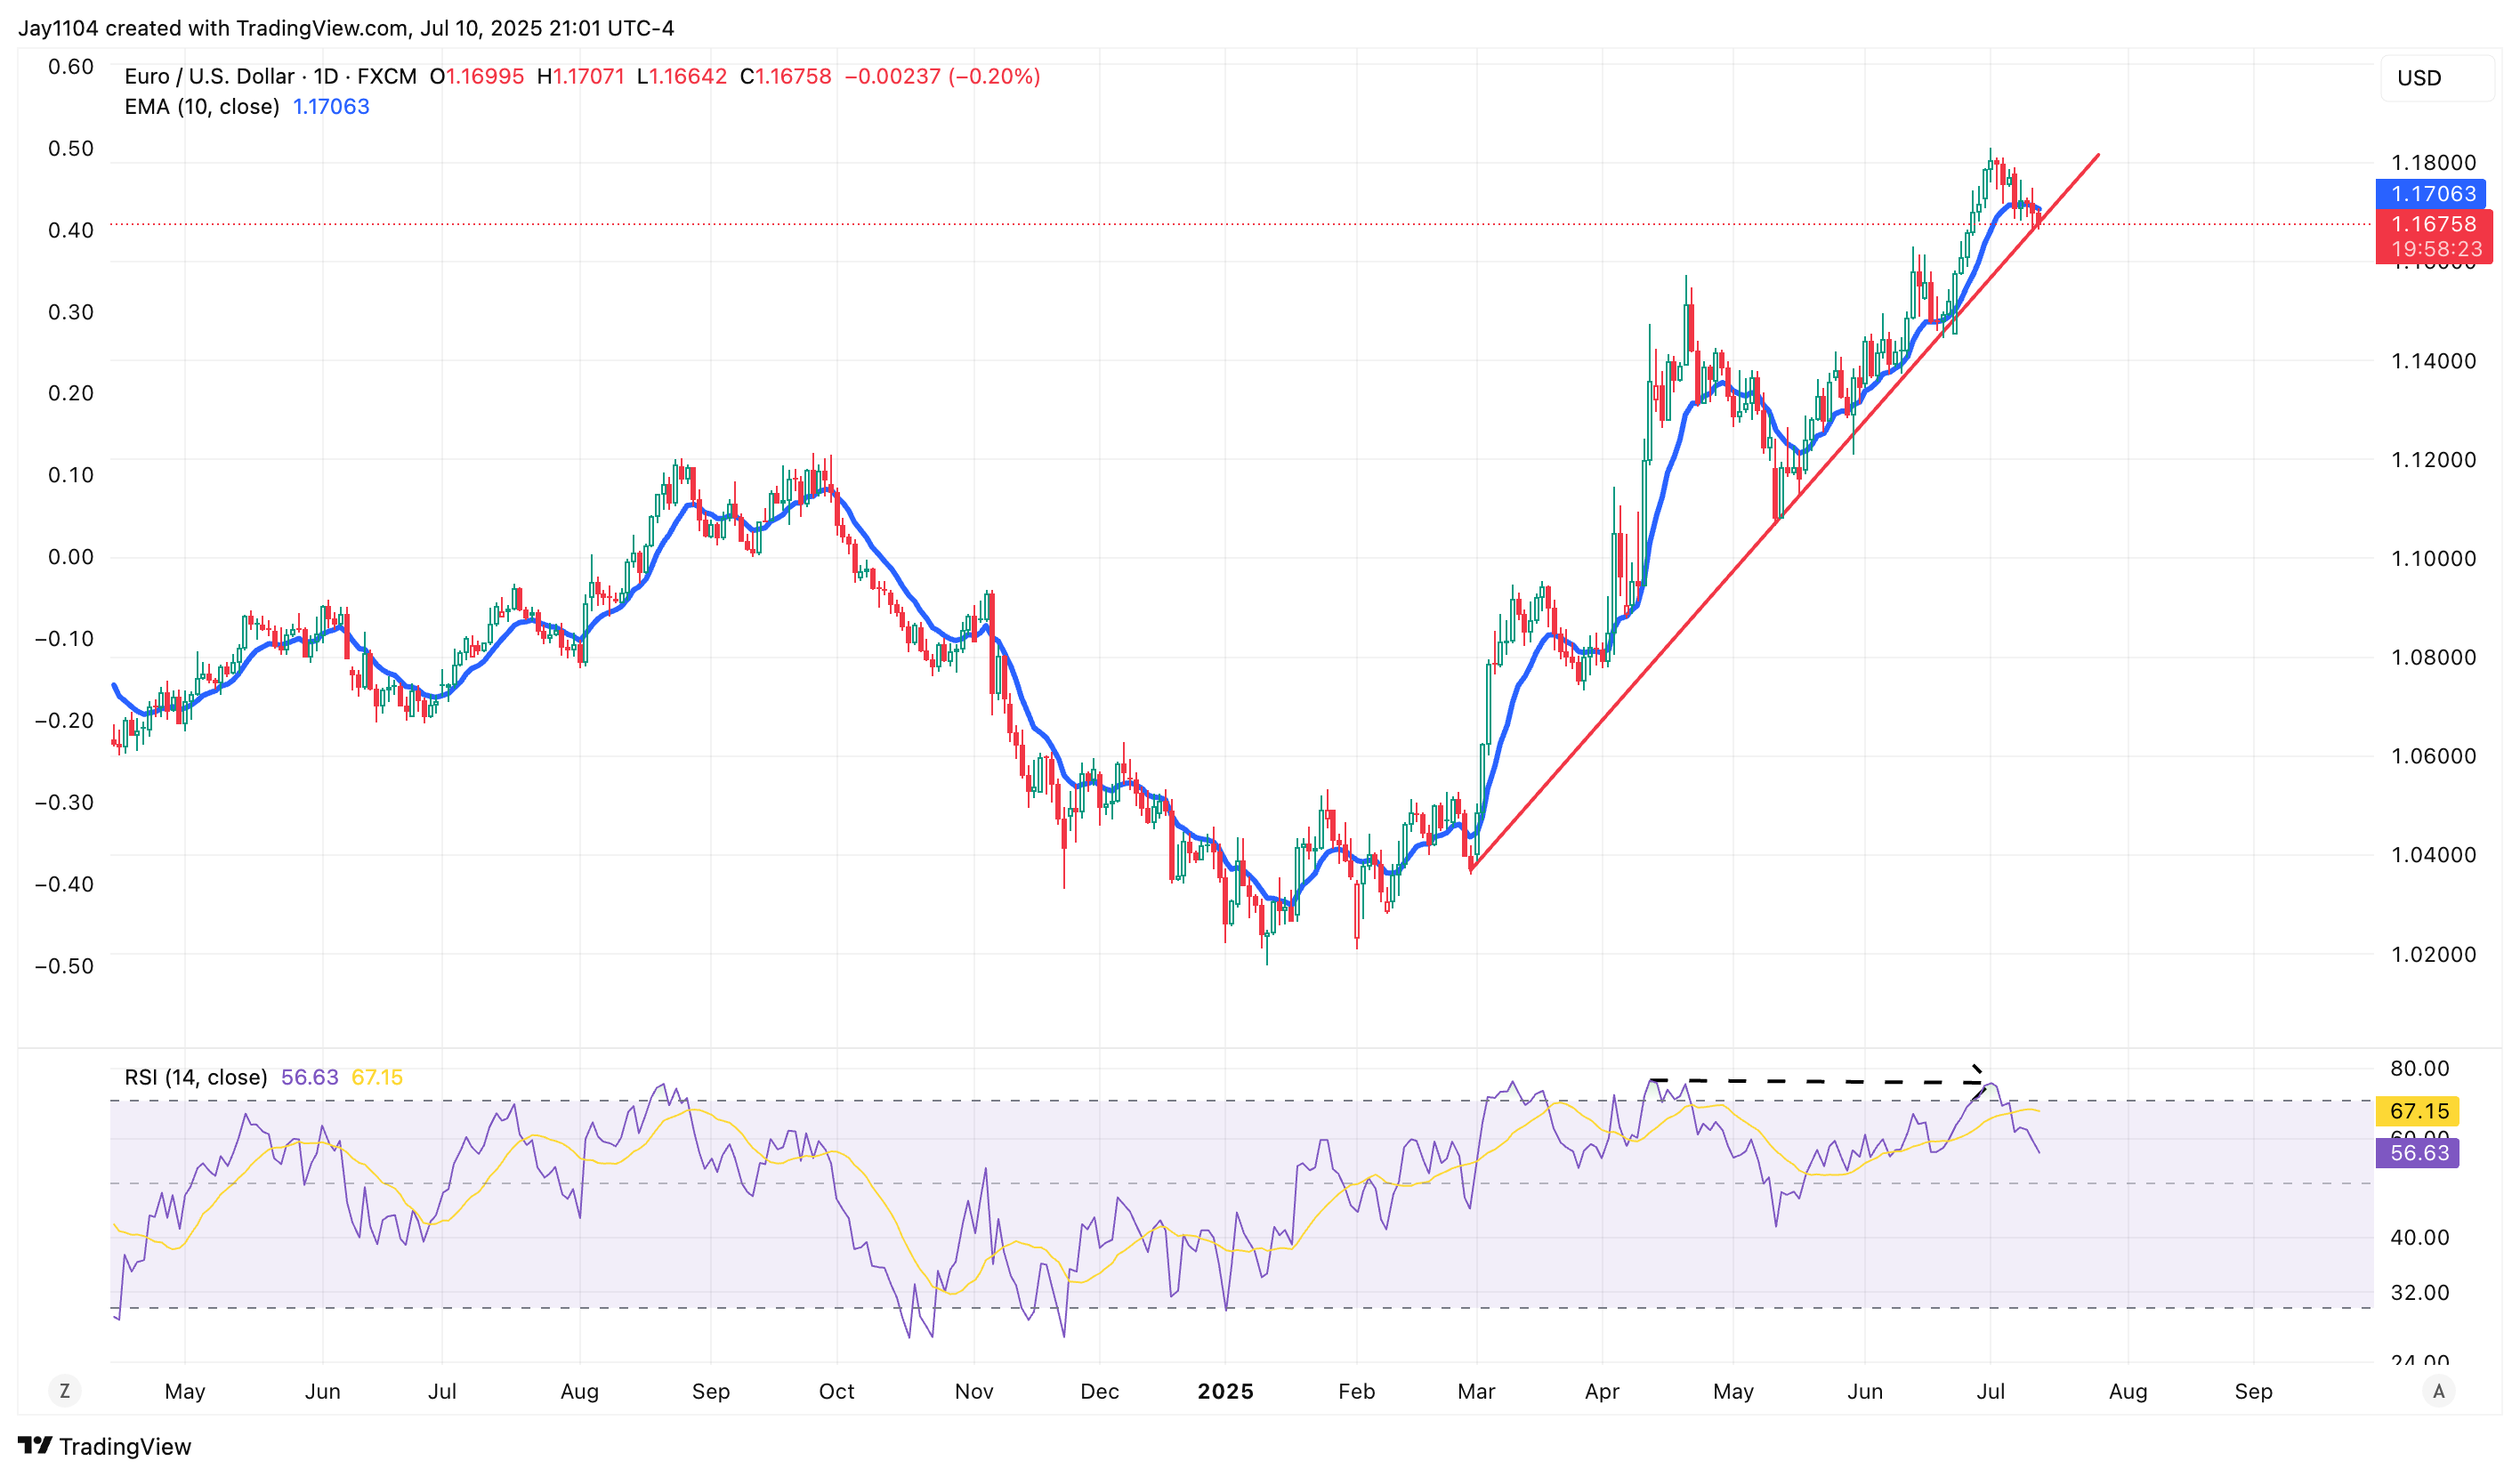
One thing that is beginning to evolve similarly to 2018 is the current dollar weakness, which was subsequently followed by a period of dollar strength. The charts today suggest that the dollar may be starting to turn higher again.
Although subtle, the Relative Strength Index (RSI) for the EURUSD recently formed a lower high, reaching 75.3 on July 1, after peaking at 76.1 on April 11. Meanwhile, the price chart made a higher high—a potential sign of bearish divergence. Currently, the 10-day exponential moving average has been serving as support for the euro; however, a break below this moving average would set up a critical test of the uptrend in place since the end of February. Breaking that trend line around 1.16 would indicate the euro’s strength is over, and the dollar is likely to return to dominance.
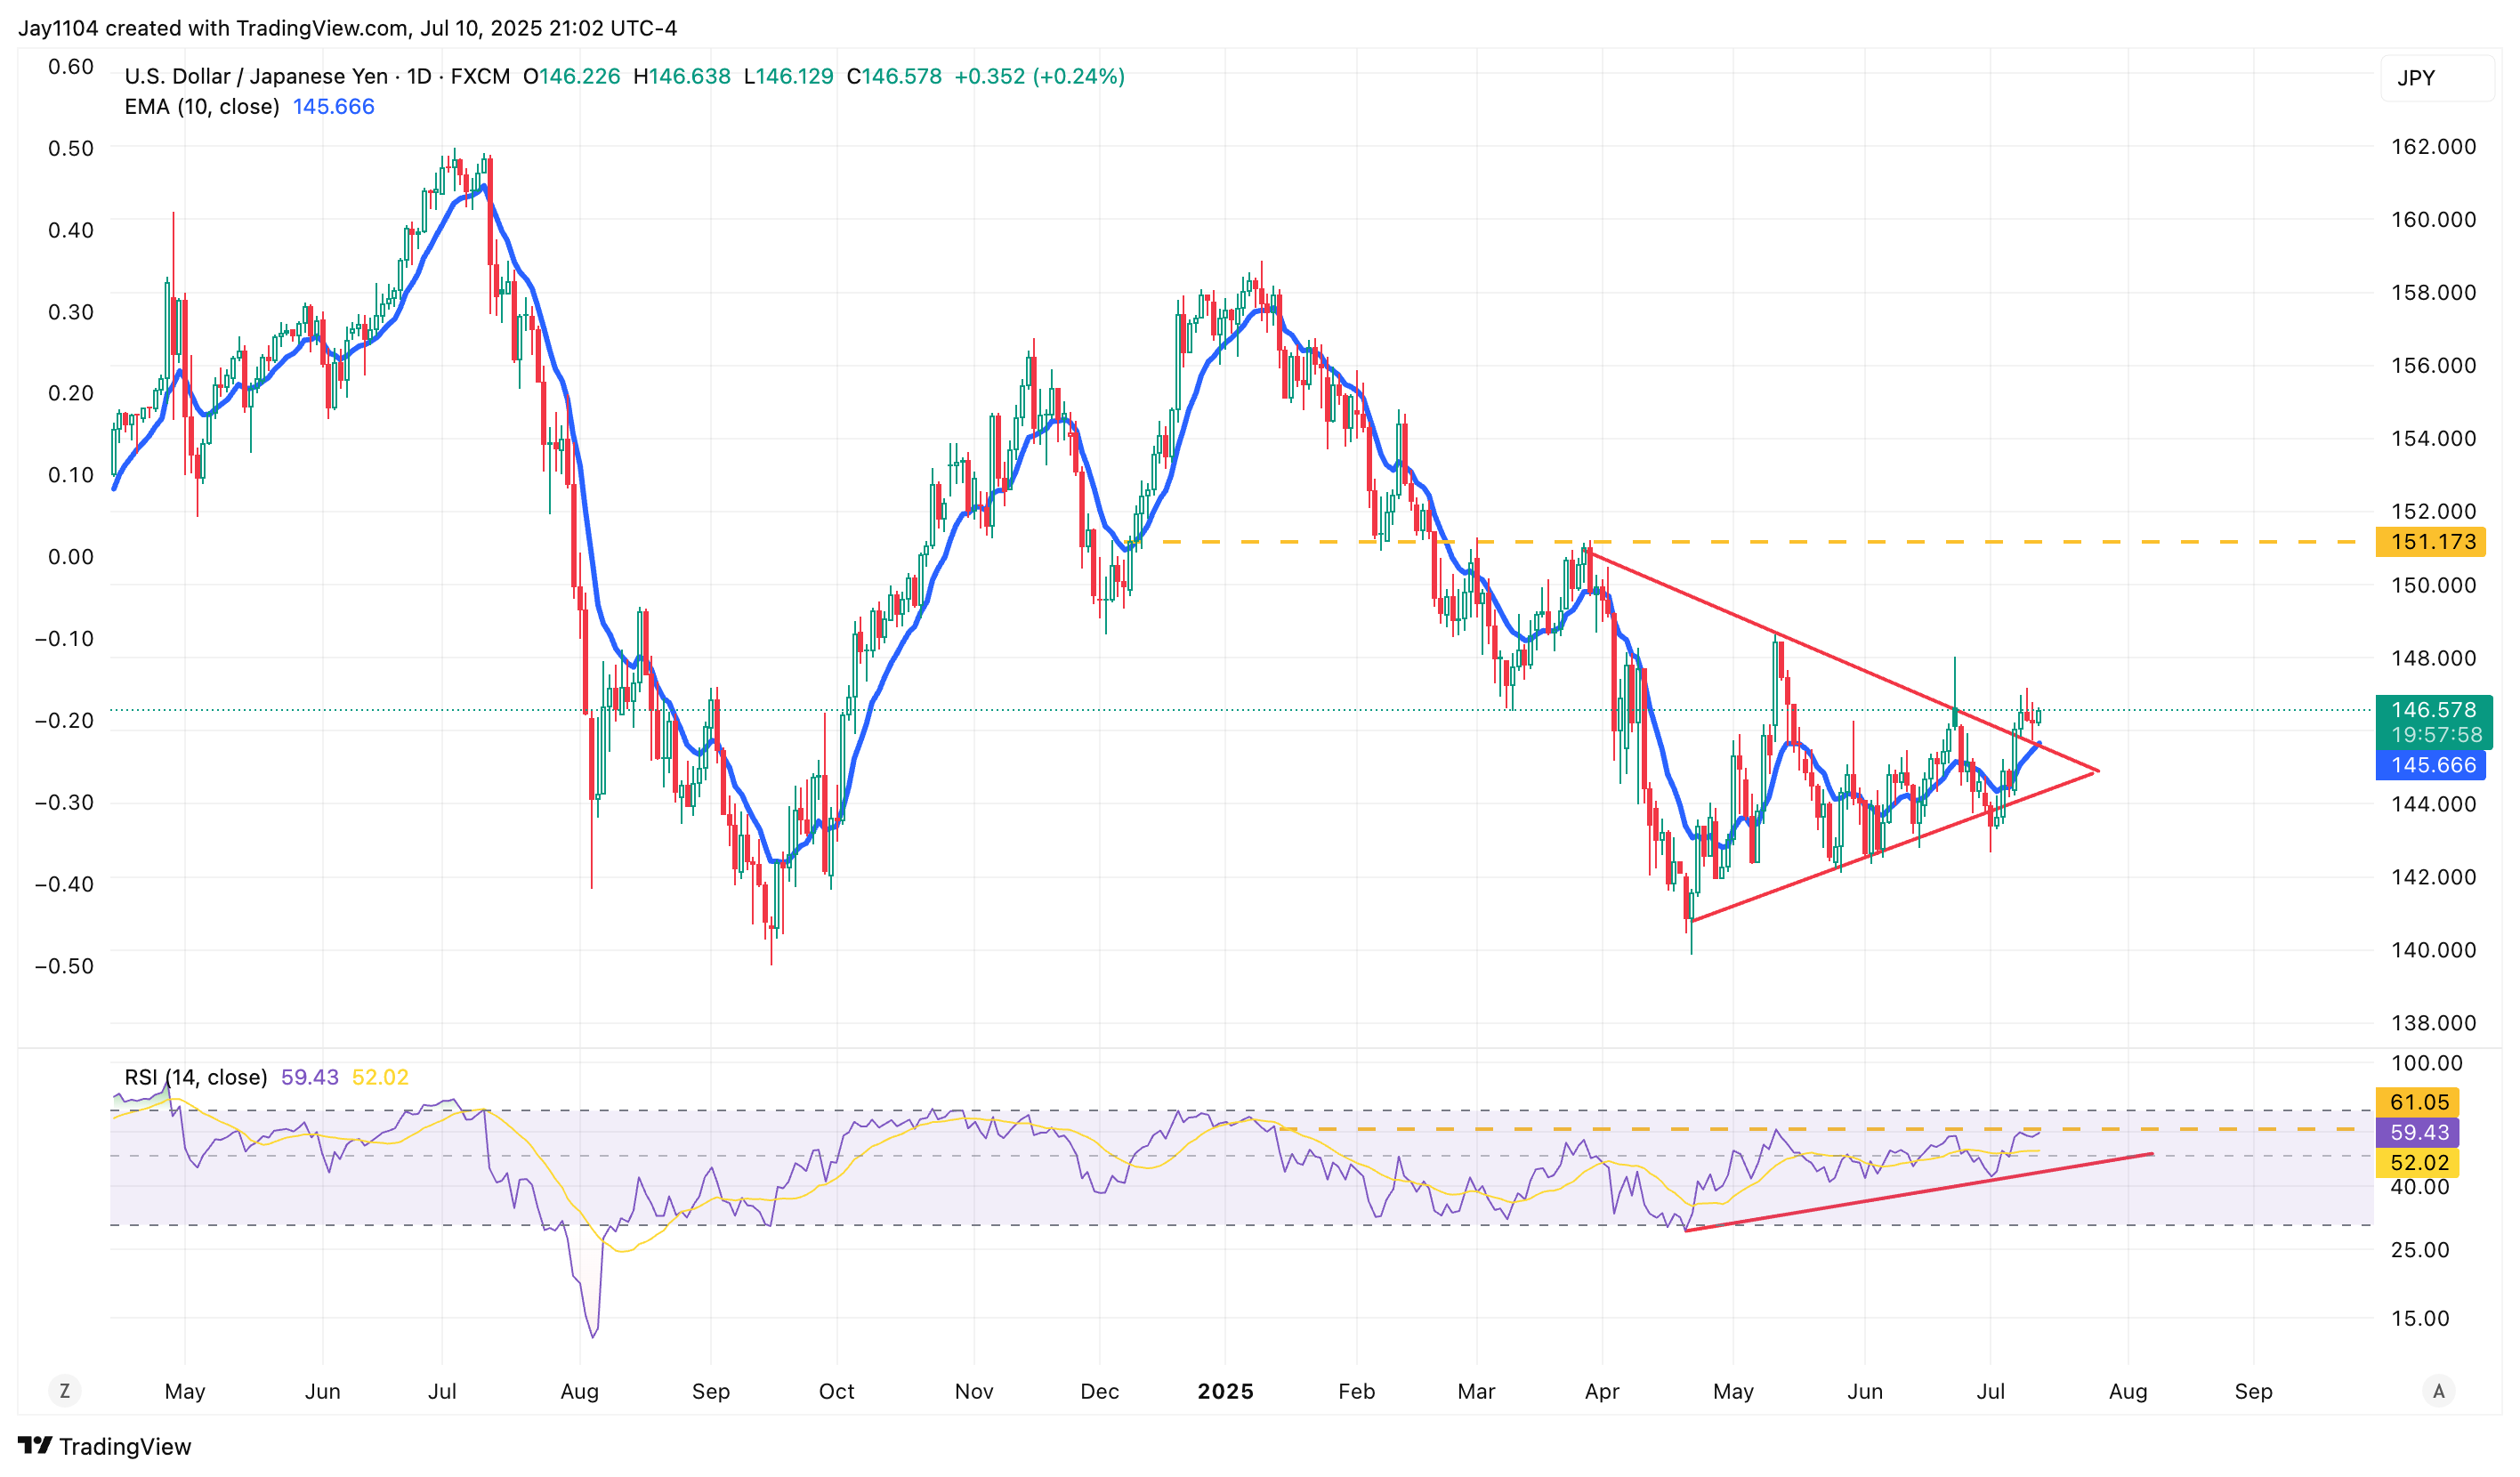
Something similar is happening in USD/JPY, with the yen showing signs of weakness as USD/JPY moves above a trendline forming a triangle pattern. This upward break could signal an early trend reversal, potentially driving USD/JPY back above 150.
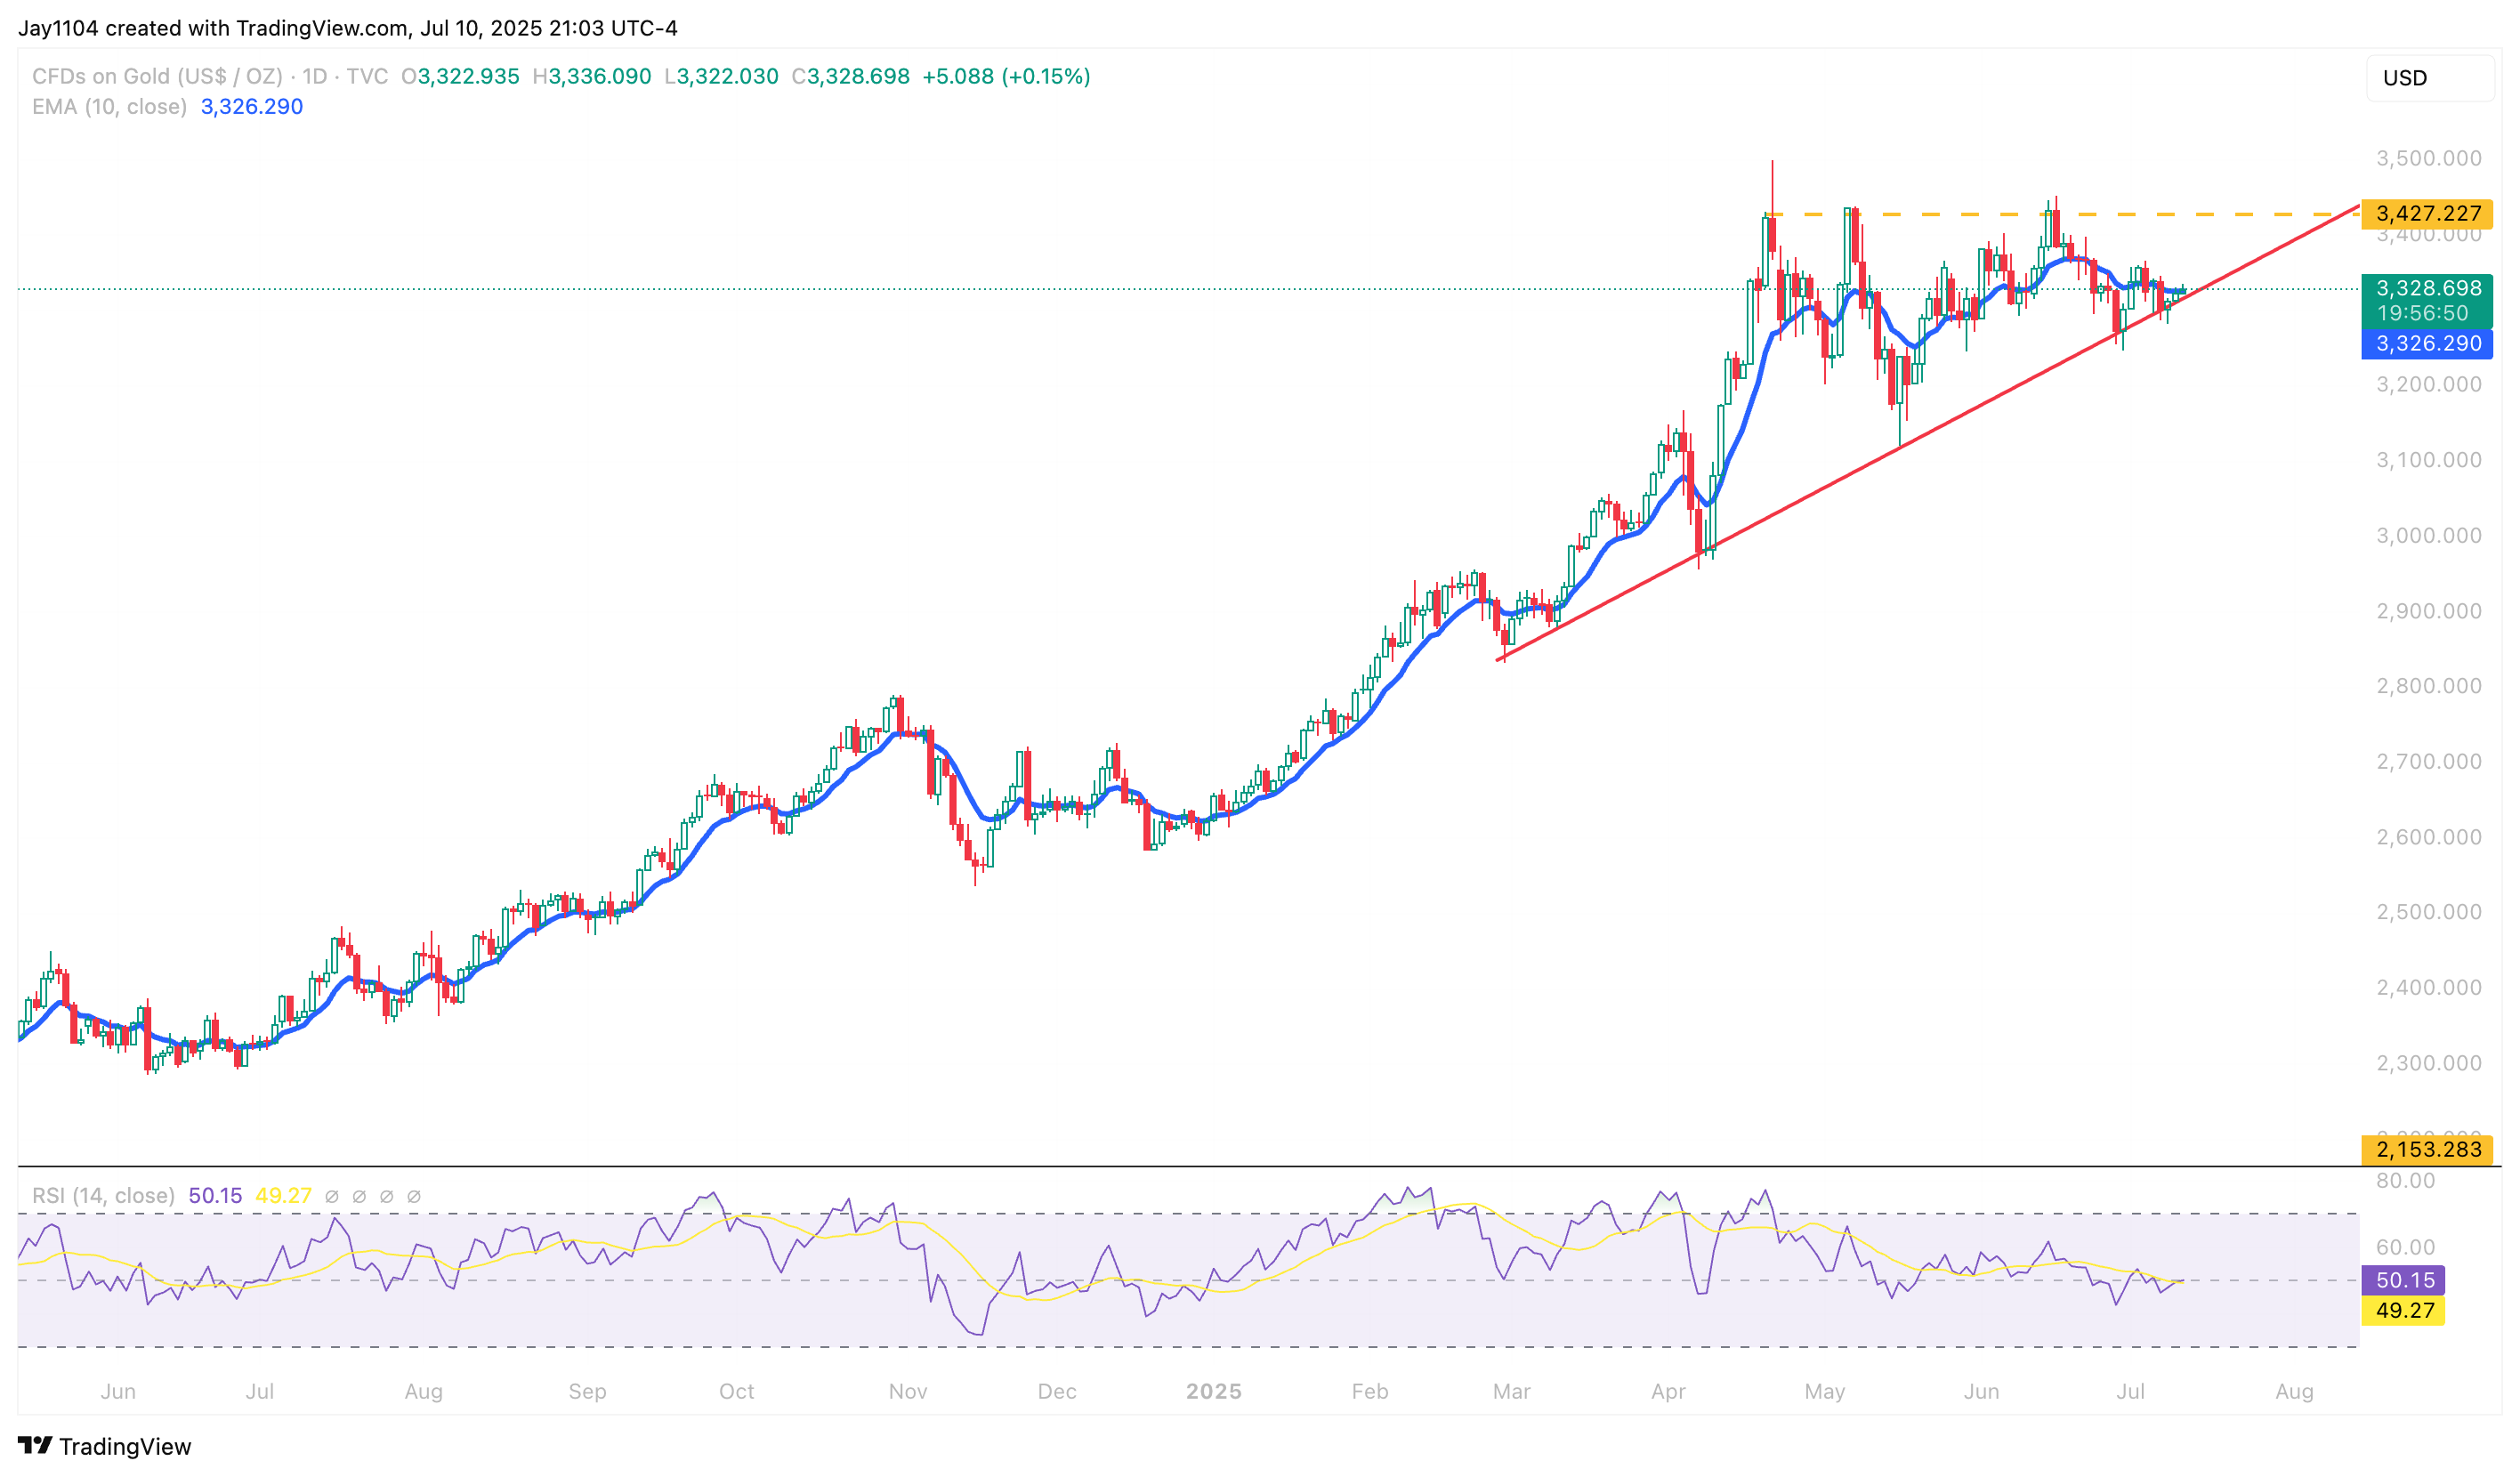
A resurgence in the dollar would also be bearish for gold. Given that gold has experienced fading momentum over recent weeks and, importantly, is now testing an uptrend dating back to late February, it suggests that gold could also trend lower in the second half of 2025.
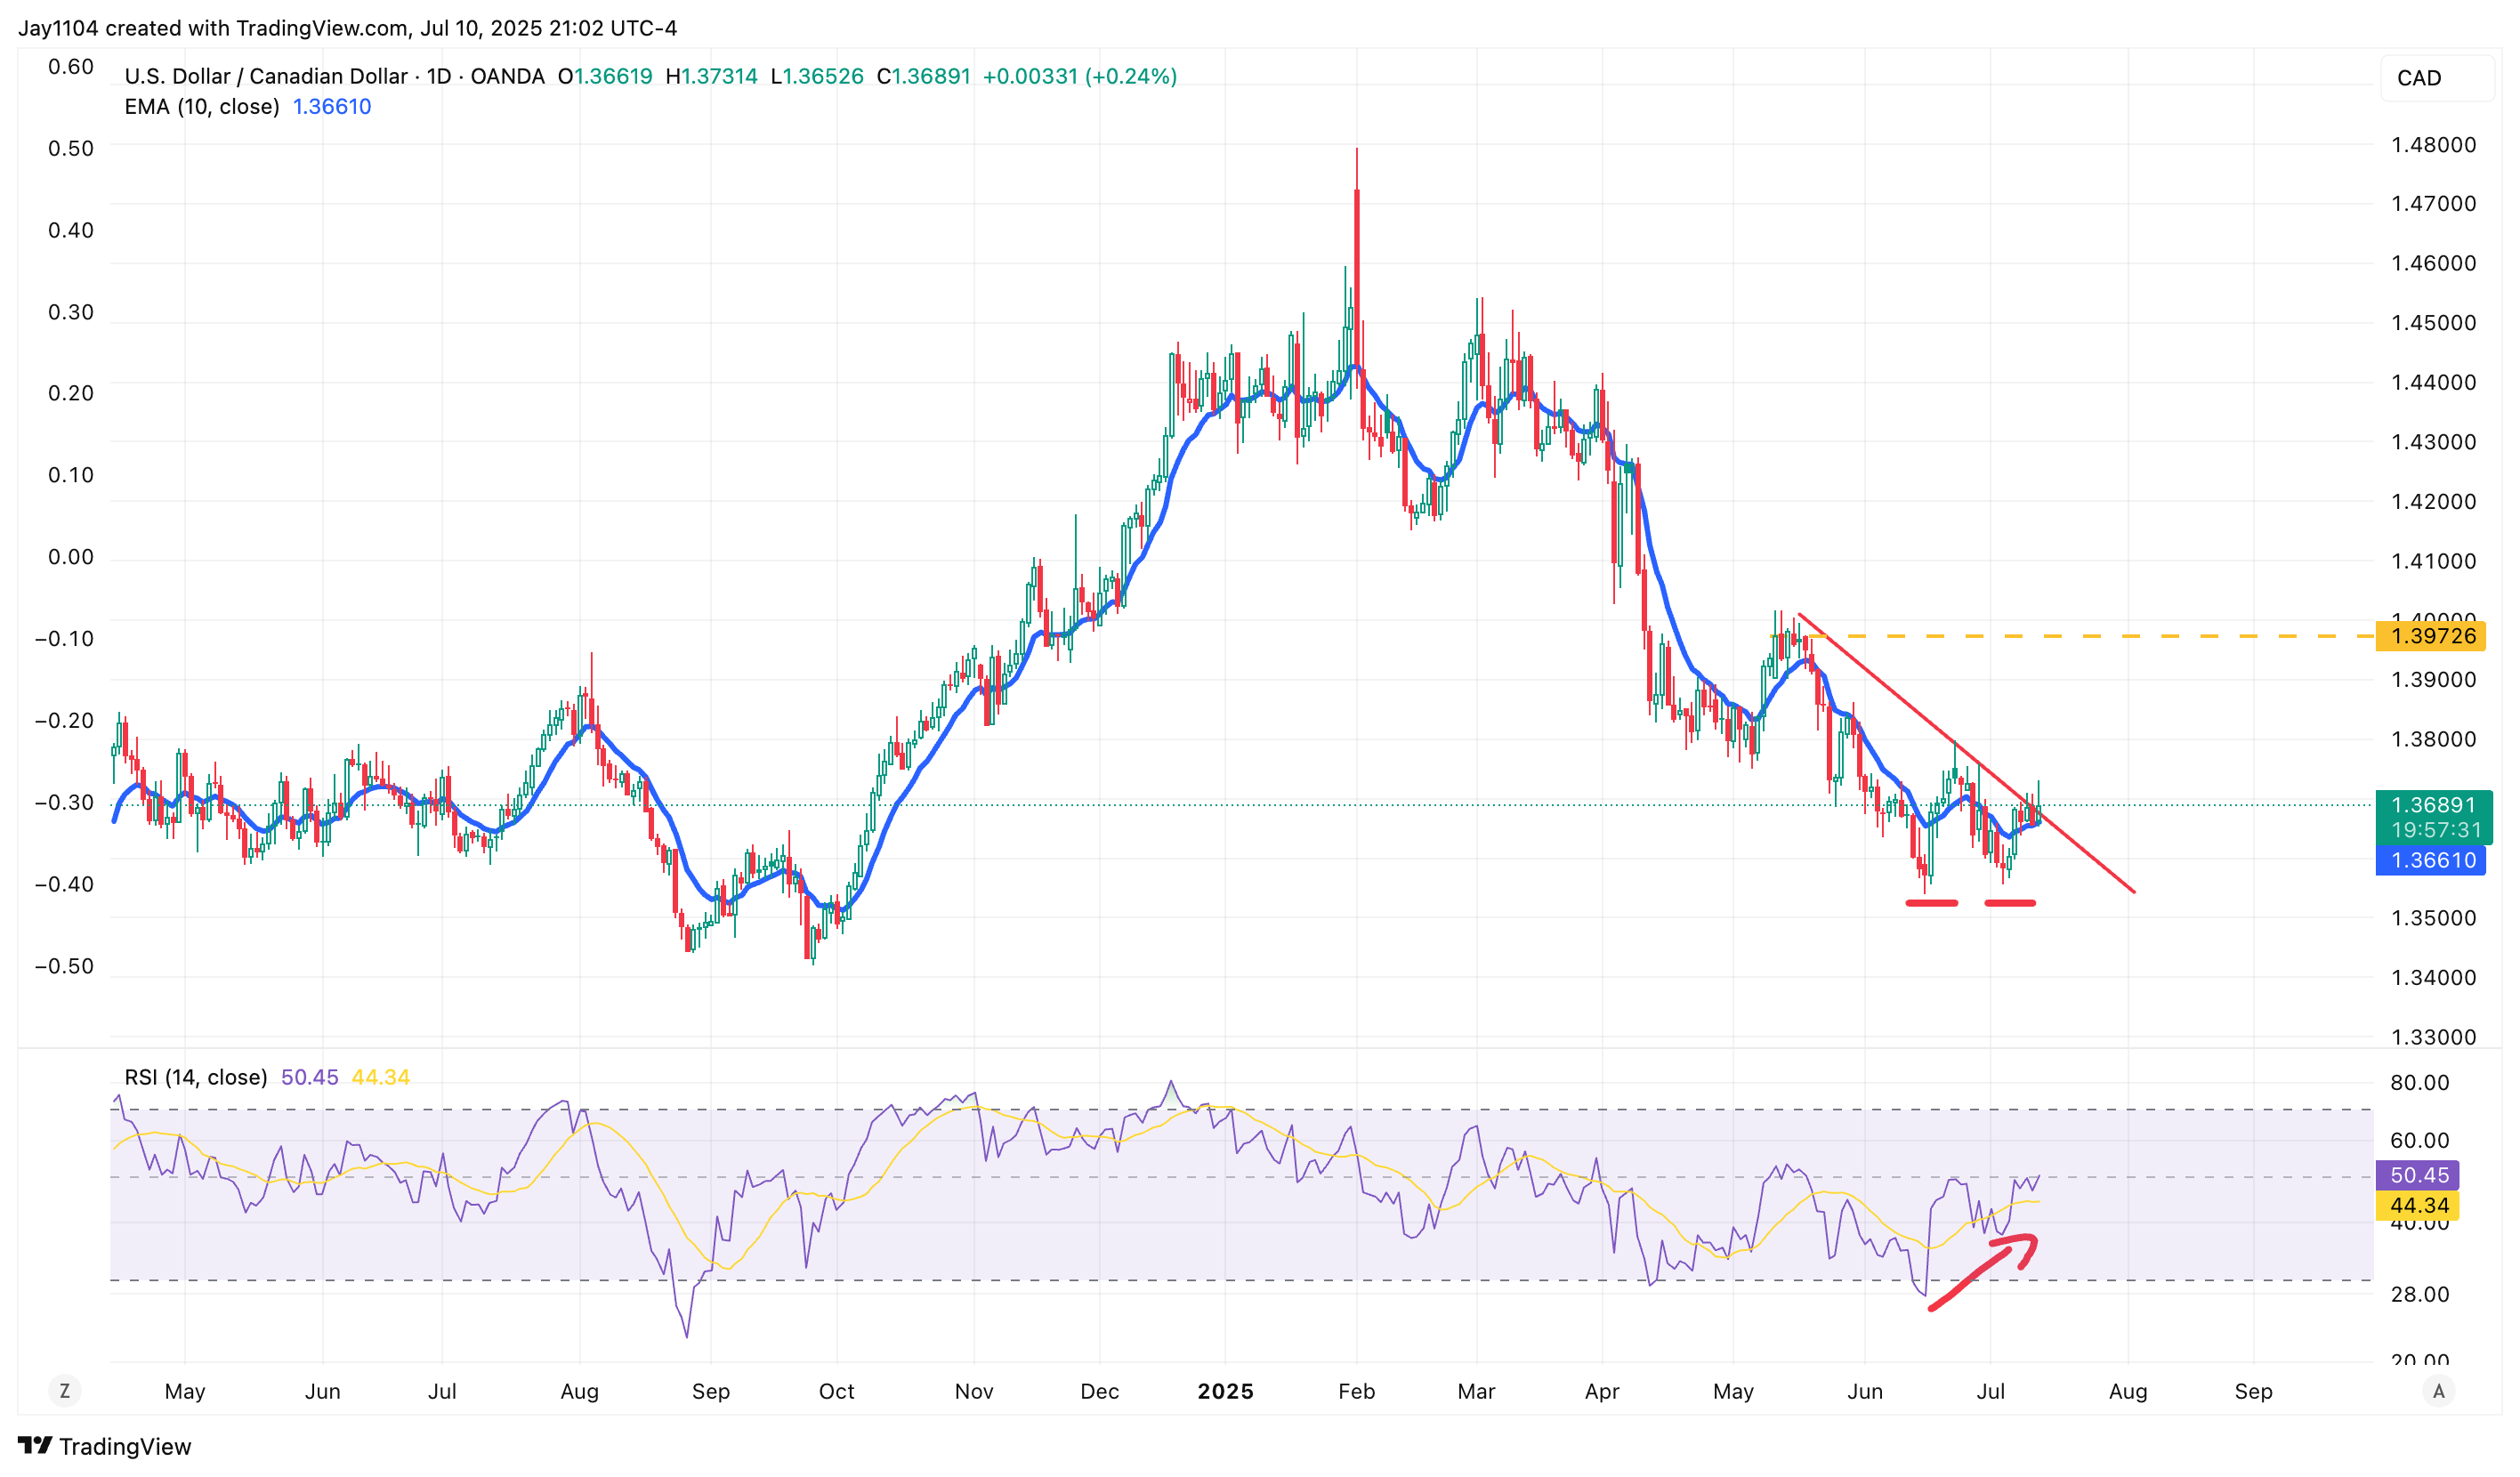
This is also clearly visible in USD/CAD, which shows an RSI trending higher and the potential formation of a double bottom on the price chart. Most importantly, USD/CAD is nearing a break of its current downtrend, and should that occur, the Canadian dollar would likely weaken materially against the US dollar, potentially moving towards 1.40.
With tariff rates and timelines often being a moving target, it’s clear that timing their exact impact – or determining if they’ll have an impact at all – is challenging. One thing, however, is sure: tariffs have been a topic President Trump has discussed for decades. It appears they’re here to stay, and their effects are yet to be fully realized.
Written by Michael J. Kramer, founder of Mott Capital Management.
Disclaimer: CMC Markets is an execution-only service provider. The material (whether or not it states any opinions) is for general information purposes only and does not take into account your personal circumstances or objectives. Nothing in this material is (or should be considered to be) financial, investment or other advice on which reliance should be placed.
No opinion given in the material constitutes a recommendation by CMC Markets or the author that any particular investment, security, transaction, or investment strategy is suitable for any specific person. The material has not been prepared in accordance with legal requirements designed to promote the independence of investment research. Although we are not specifically prevented from dealing before providing this material, we do not seek to take advantage of the material prior to its dissemination.
CMC Markets Canada Expands Platform Offering with Launch of MetaTrader 5
CMC Markets Canada launches MetaTrader 5, expanding platform choice for Canadian traders
Clients gain access to more than 1,100 instruments across shares, futures, indices, commodities and forex
Launch supports CMC Markets' strategy to deliver greater flexibility, choice and access across global markets

DAX still far from a bottom as US Treasury bonds flood the market
The DAX is still showing no signs of a bottom formation or a clear trend towards one. The risk remains that new lows below 18,800 could occur in the coming days. Key support is at 19,300; if this is breached, the index could plunge to the next significant support at 17,550.