Spread bets and CFDs are complex instruments and come with a high risk of losing money rapidly due to leverage.
68%
of retail investor accounts lose money when spread betting and/or trading CFDs with this provider.
You should consider whether you understand how spread bets, CFDs, OTC options or any of our other products work and whether you can afford to take the high risk of losing your money.
Ways to trade
Retail Trading
Equities trading
Spread betting
CFD trading
Options trading
Alpha
Price+
FX Active
Account comparison
Trading costs
Professional trading
CMC Pro
CMC Spectre
Institutional
Markets
Indices
Forex
Commodities
Shares
ETFs
Bonds
Share baskets
See all markets
Platforms
Web platform
CMC mobile app
MetaTrader 4
TradingView
See all platforms
Learn
Learn hub
News & analysis
About us
About us
Group
CMC careers
Support
Contact us
Log in
Start trading
Log in
Start trading
Market news & analysis
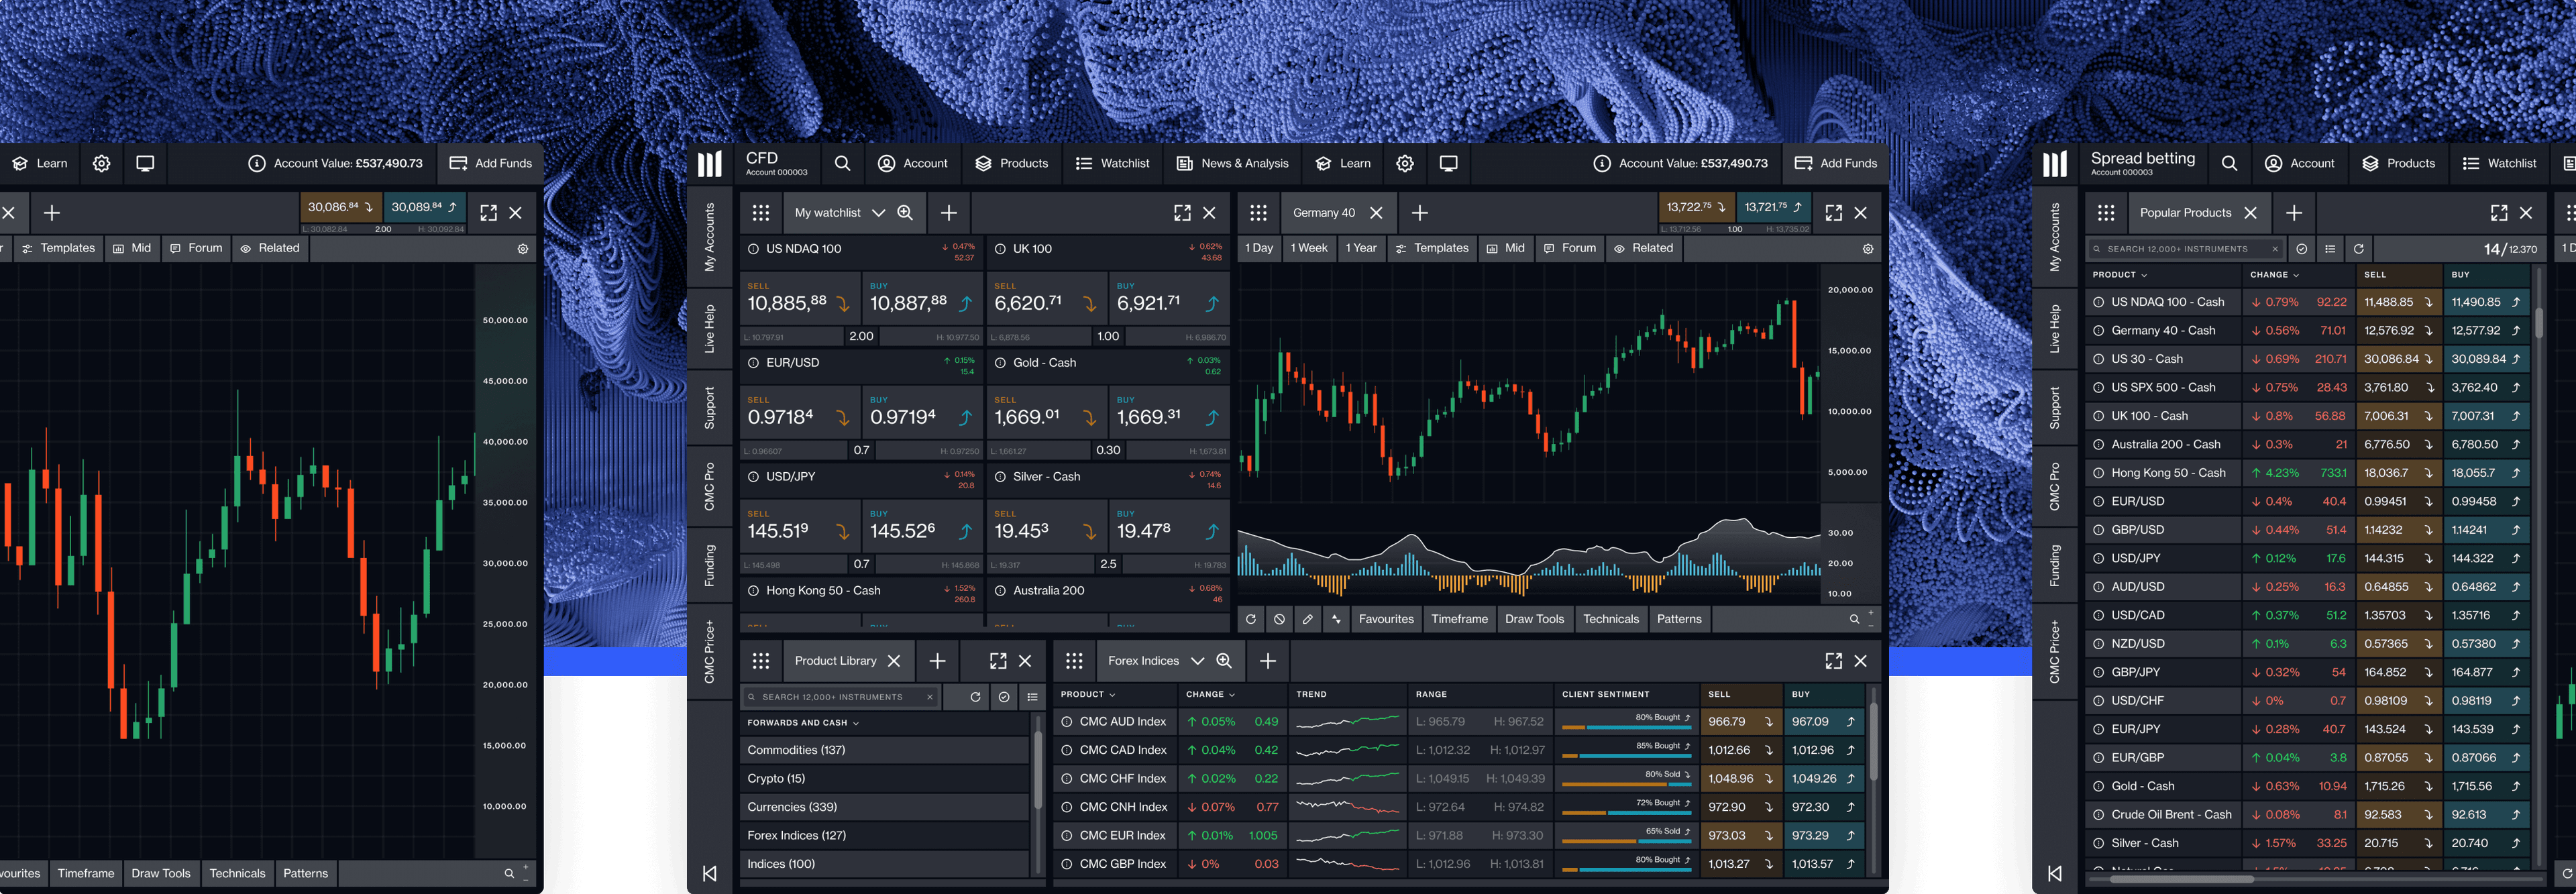
Spread Betting & CFD Trading
Ready to get started?
Open a demo account with
£10,000
of virtual funds, or open a live account.
Open a demo account
Create account
Loading...
Loading...