

The Nasdaq 100 is at an important support level around 27,000. A break below this level could set up a retest of the 5 November low of 26,300, when the index became oversold and fell below its lower Bollinger Band® as the relative strength index (RSI) dropped below 30. This time, however, a decline towards 26,300 is less likely to push the index into oversold territory, as it remains well above its lower Bollinger Band and the RSI is currently around 37.
Moving averages create resistance near 28,200
The 20-day moving average has been acting as resistance at 28,200. Additionally, the Nasdaq 100 has also fallen below its 200-day moving average, which is now acting as resistance around 28,175. If the index holds support at 27,100, it could move back towards that resistance area. Also, the 38.2% Fibonacci retracement level sits around 28,200, close to those key moving averages.
A rebound needs stronger momentum
With Nvidia’s results now out of the way, the Nasdaq 100 has scope to rebound towards this resistance area around 28,200. A break above on heavy volume, or a day or two of strong follow-through, could open the way for a region of 29,000 to 30,000, although overcoming that resistance may prove challenging.
An advance beyond it, however, may prove more difficult until there is clearer evidence of a change in trend and momentum, particularly as the RSI continues to trend lower.
Nasdaq 100, September 2025 – present
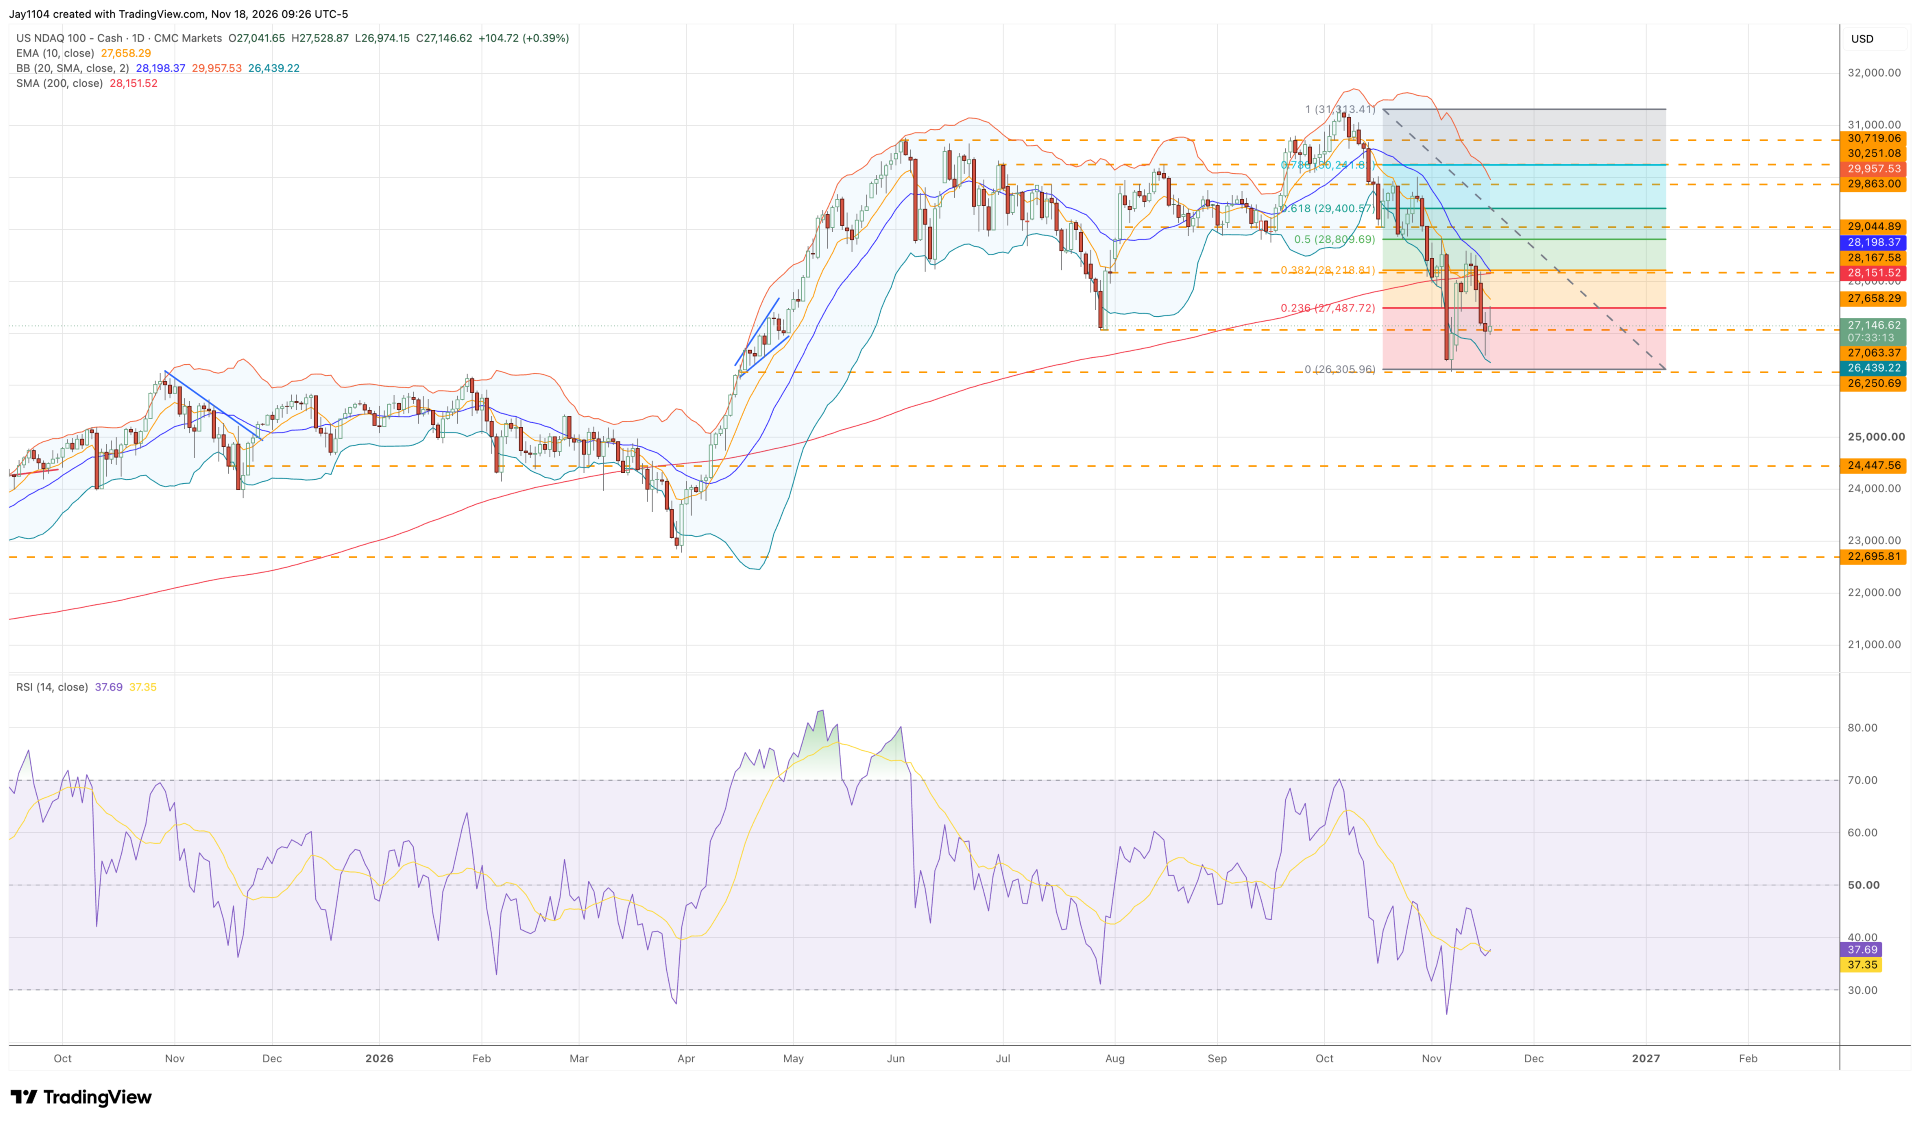
Source: TradingView, 18 November 2026