
Gold consolidates below key resistance
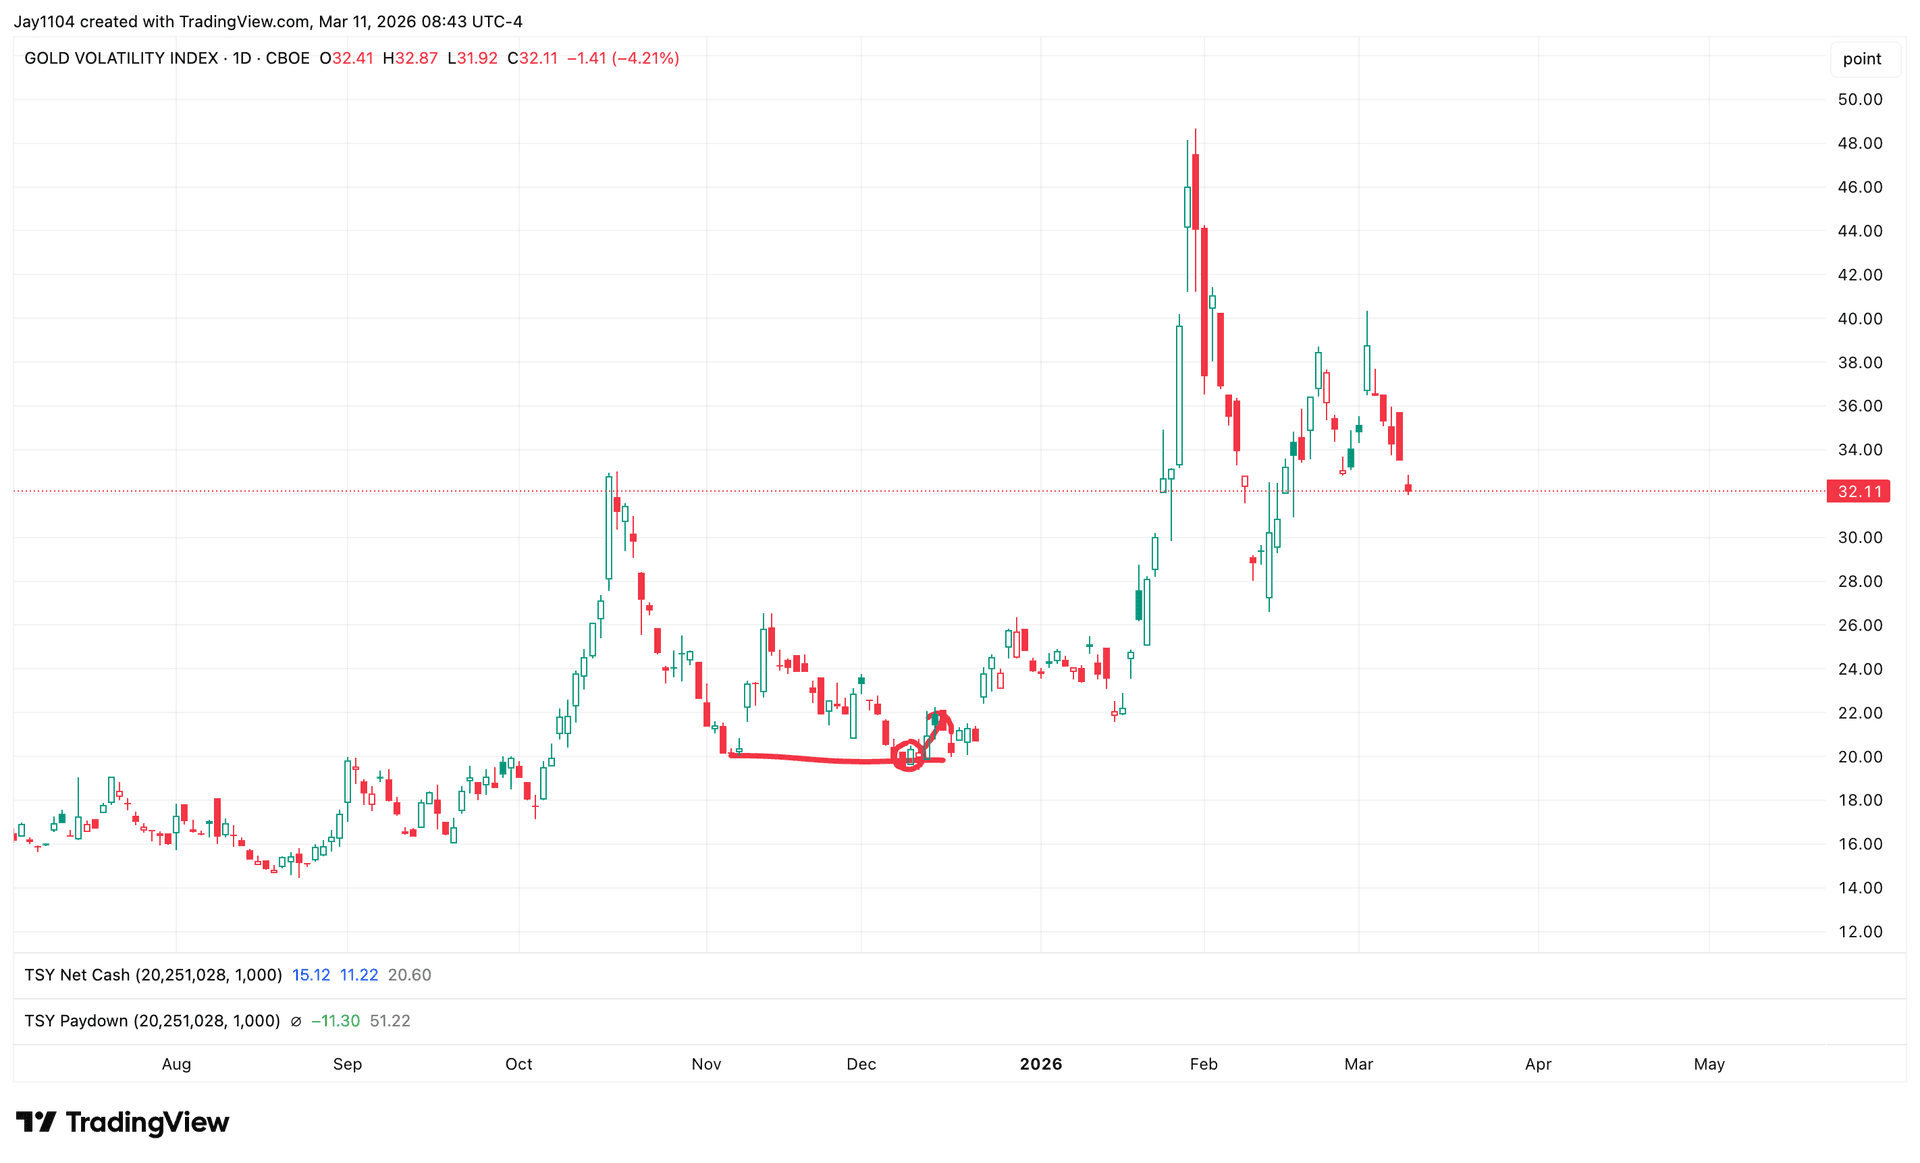
With oil capturing more recent attention, volatility in gold has significantly diminished, and it has been moving sideways, consolidating just below the $5,200 to $5,250 level. When examining gold on a more intraday basis, it seems likely to move lower towards the $4,950 area.
Bearish intraday patterns emerge
At least temporarily, on a one-hour chart, gold appears to be forming a rising wedge pattern. Looking further back, there could also be an argument that gold is forming a head and shoulders pattern on the intraday chart.
Therefore, there are two potentially bearish patterns in the shorter term that suggest gold could drift back towards the $4,960 region, and perhaps lower.
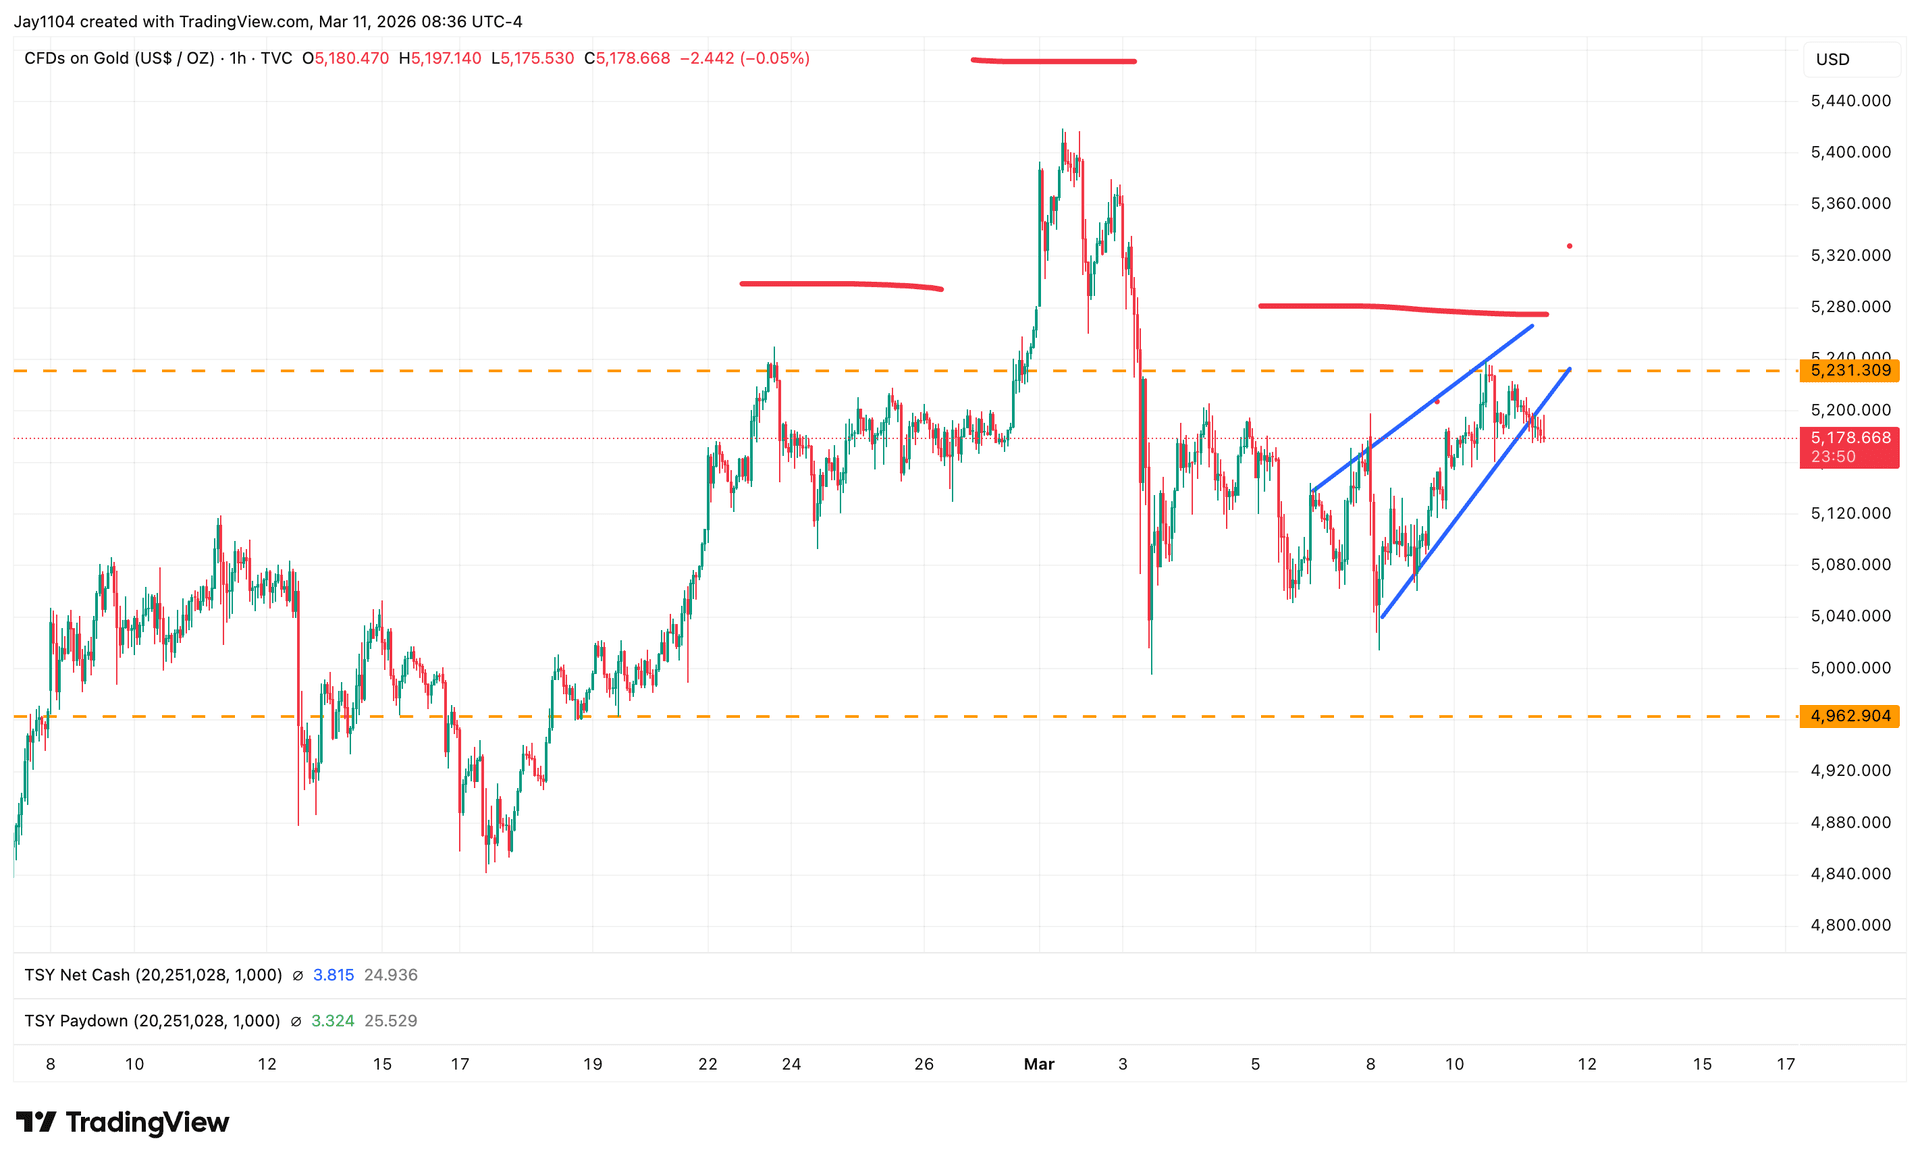
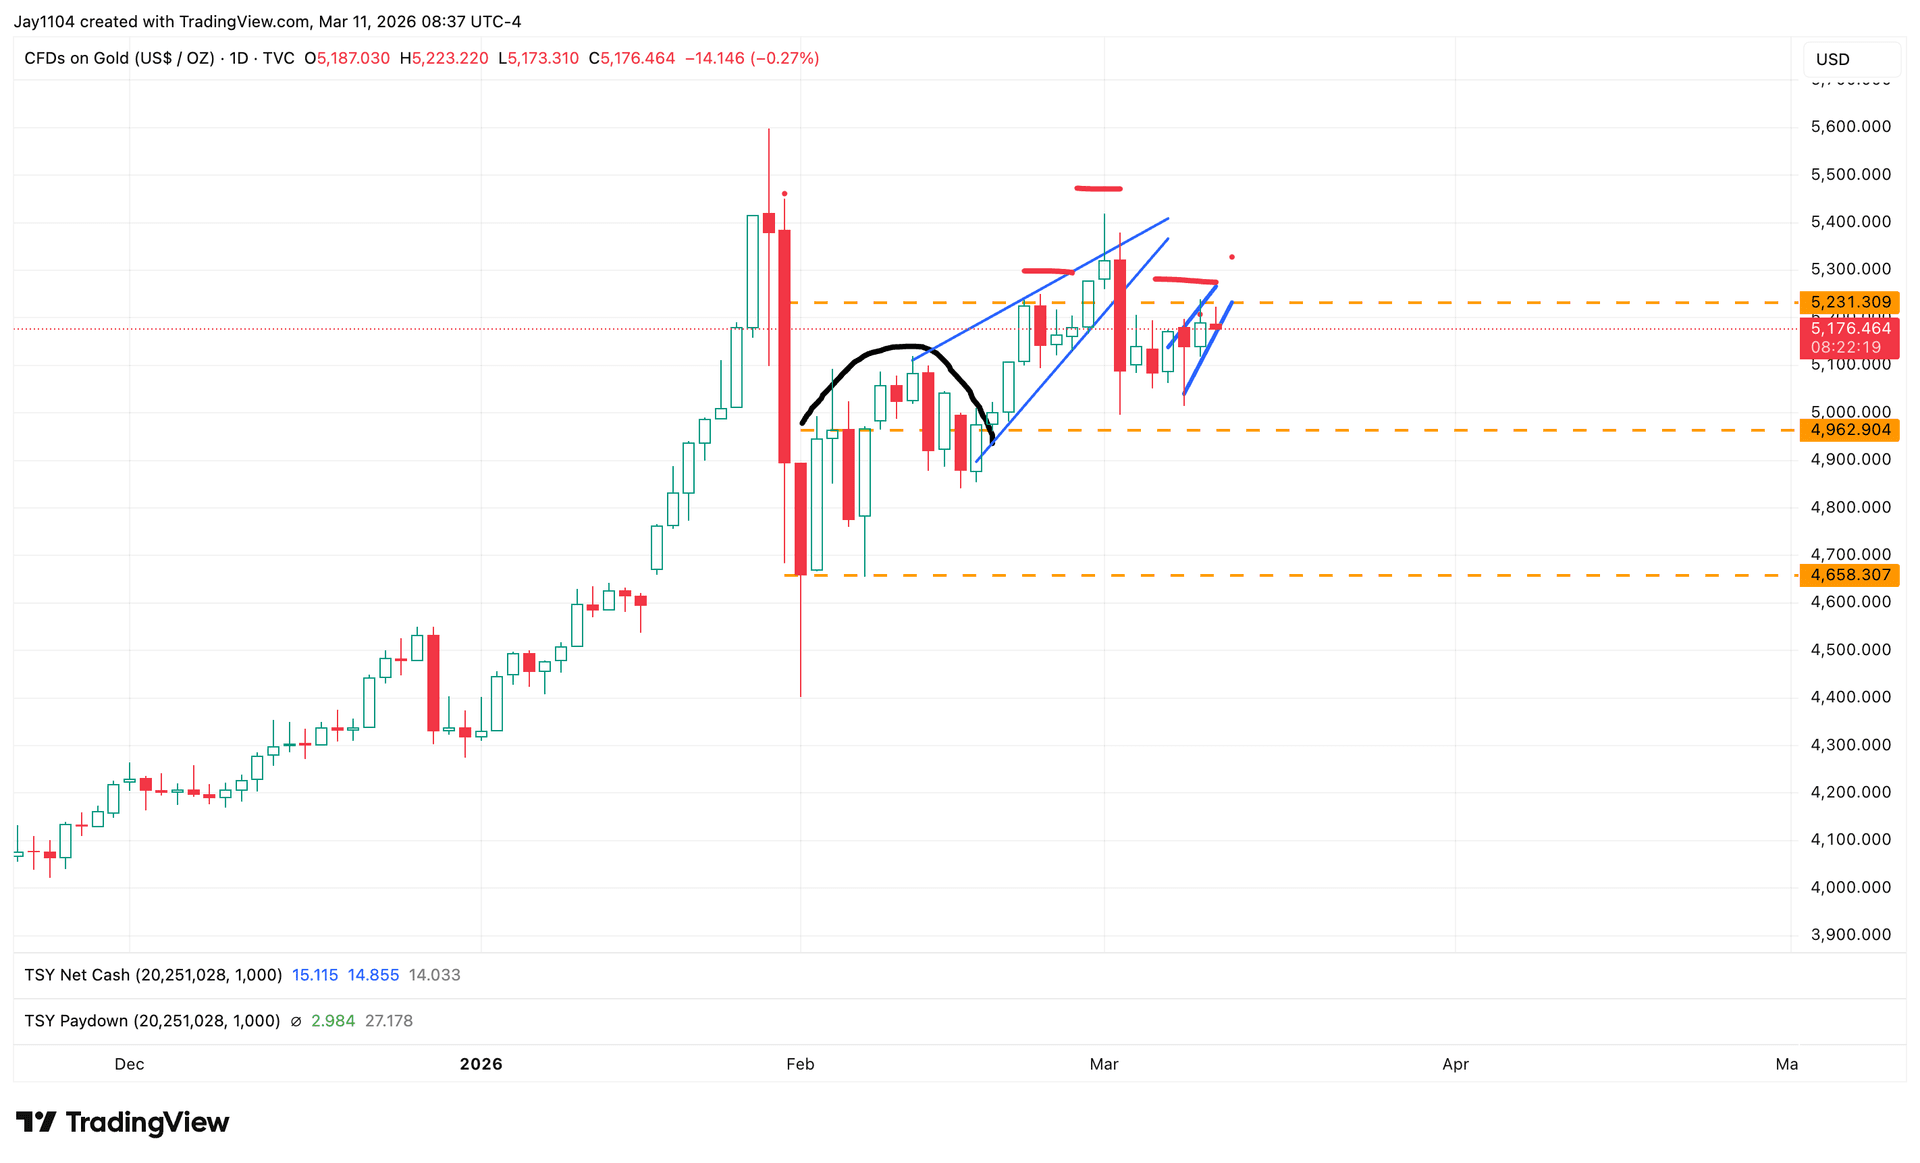
Source: TradingView, 11 March 2026
The daily chart shows a more bearish view; it appears that the precious metal has formed an inverse cup-and-handle pattern to the downside. This would suggest that gold may be heading lower from current levels, with $4,950 as a potential support level. However, gold may ultimately move even lower, potentially back towards $4,650.