
Brent pulls back towards short-term support
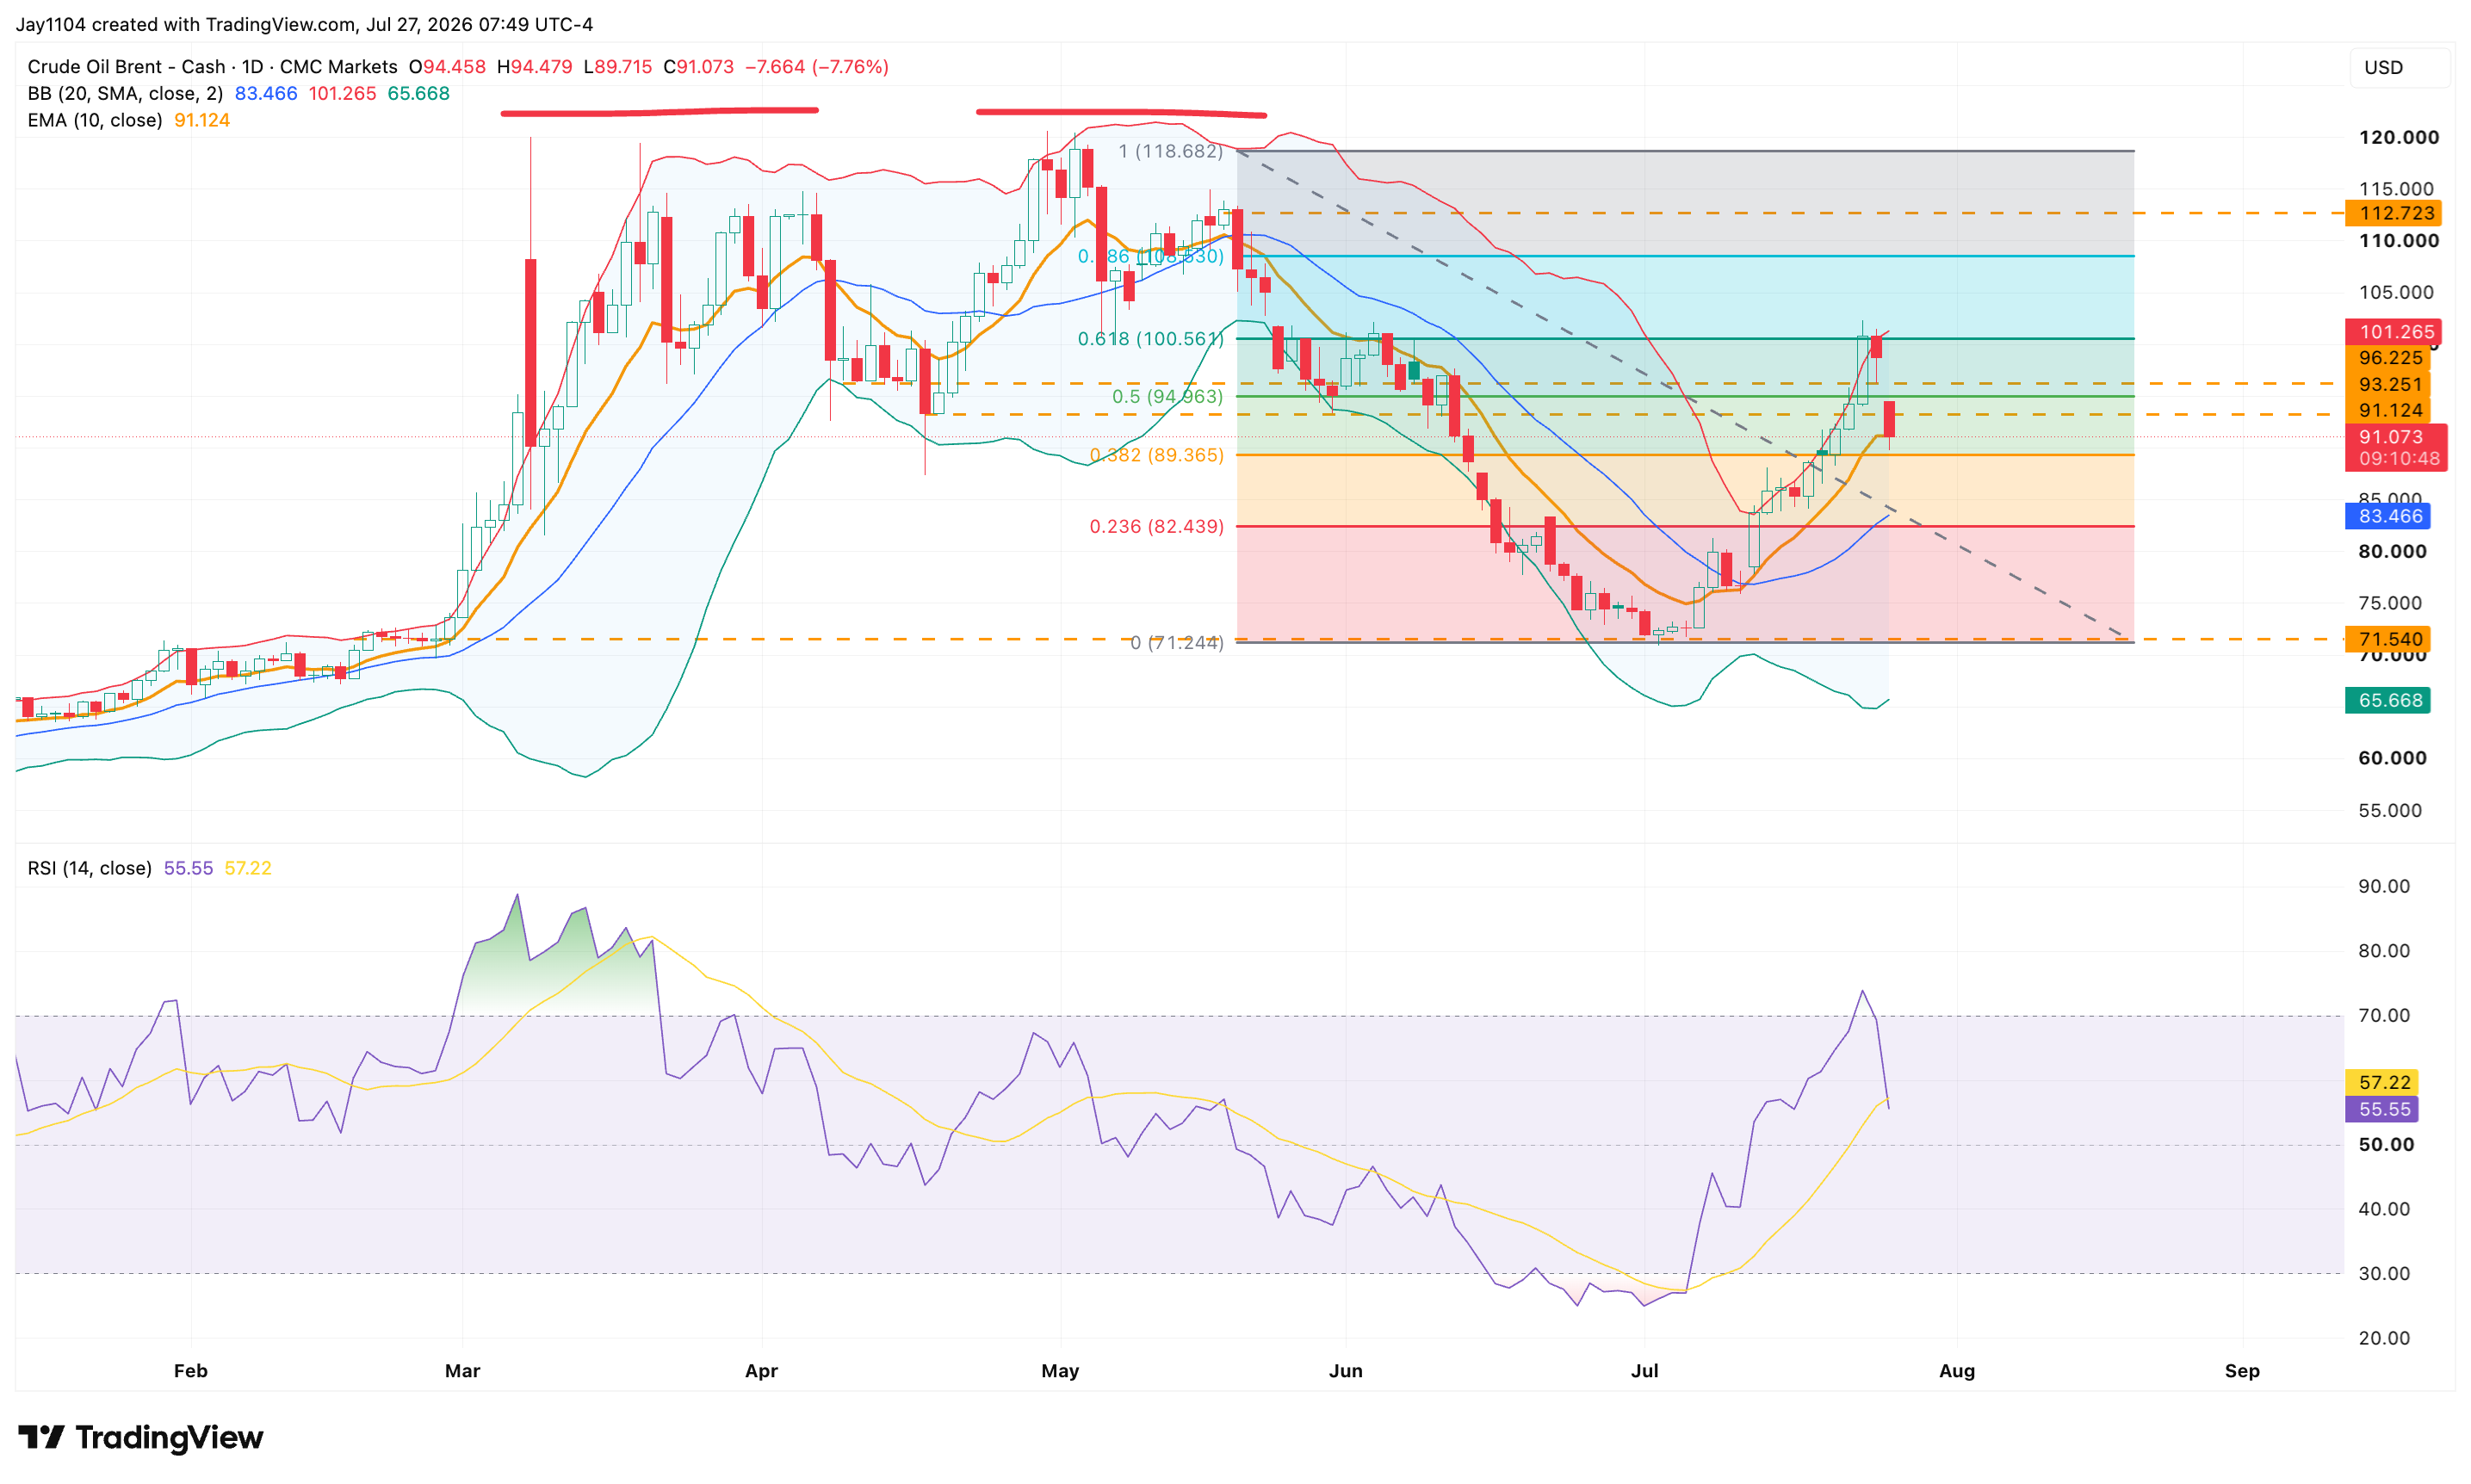
Brent crude prices have surged by more than 25% since mid-July and are now pulling back towards technical support at the 10-day exponential moving average. Brent had become overbought after rising above the upper Bollinger Band on 23 July, with its RSI climbing above 70. As a result, the current Brent pullback is consistent with technical analysis.
Fibonacci resistance capped the rally
Prices had also reached the 61.8% Fibonacci retracement level, measured from the 4 May peak to the lows recorded around 2 July. The 61.8% retracement is a key technical level and currently coincides with a broader area of resistance around $101 per barrel.
Brent crude oil, February – present
Sources: TradingView, Michael J Kramer
The 10-day EMA is the near-term line to watch
Brent is now testing the 10-day exponential moving average, which has historically served as a reliable level of support and resistance, particularly since mid-April. A break below the 10-day exponential moving average could push prices lower, with the next area of support around $83 a barrel. That level also coincides with the 20-day moving average and, perhaps more importantly, a break of that support might signal a change in trend.