
Gold retests downtrend resistance
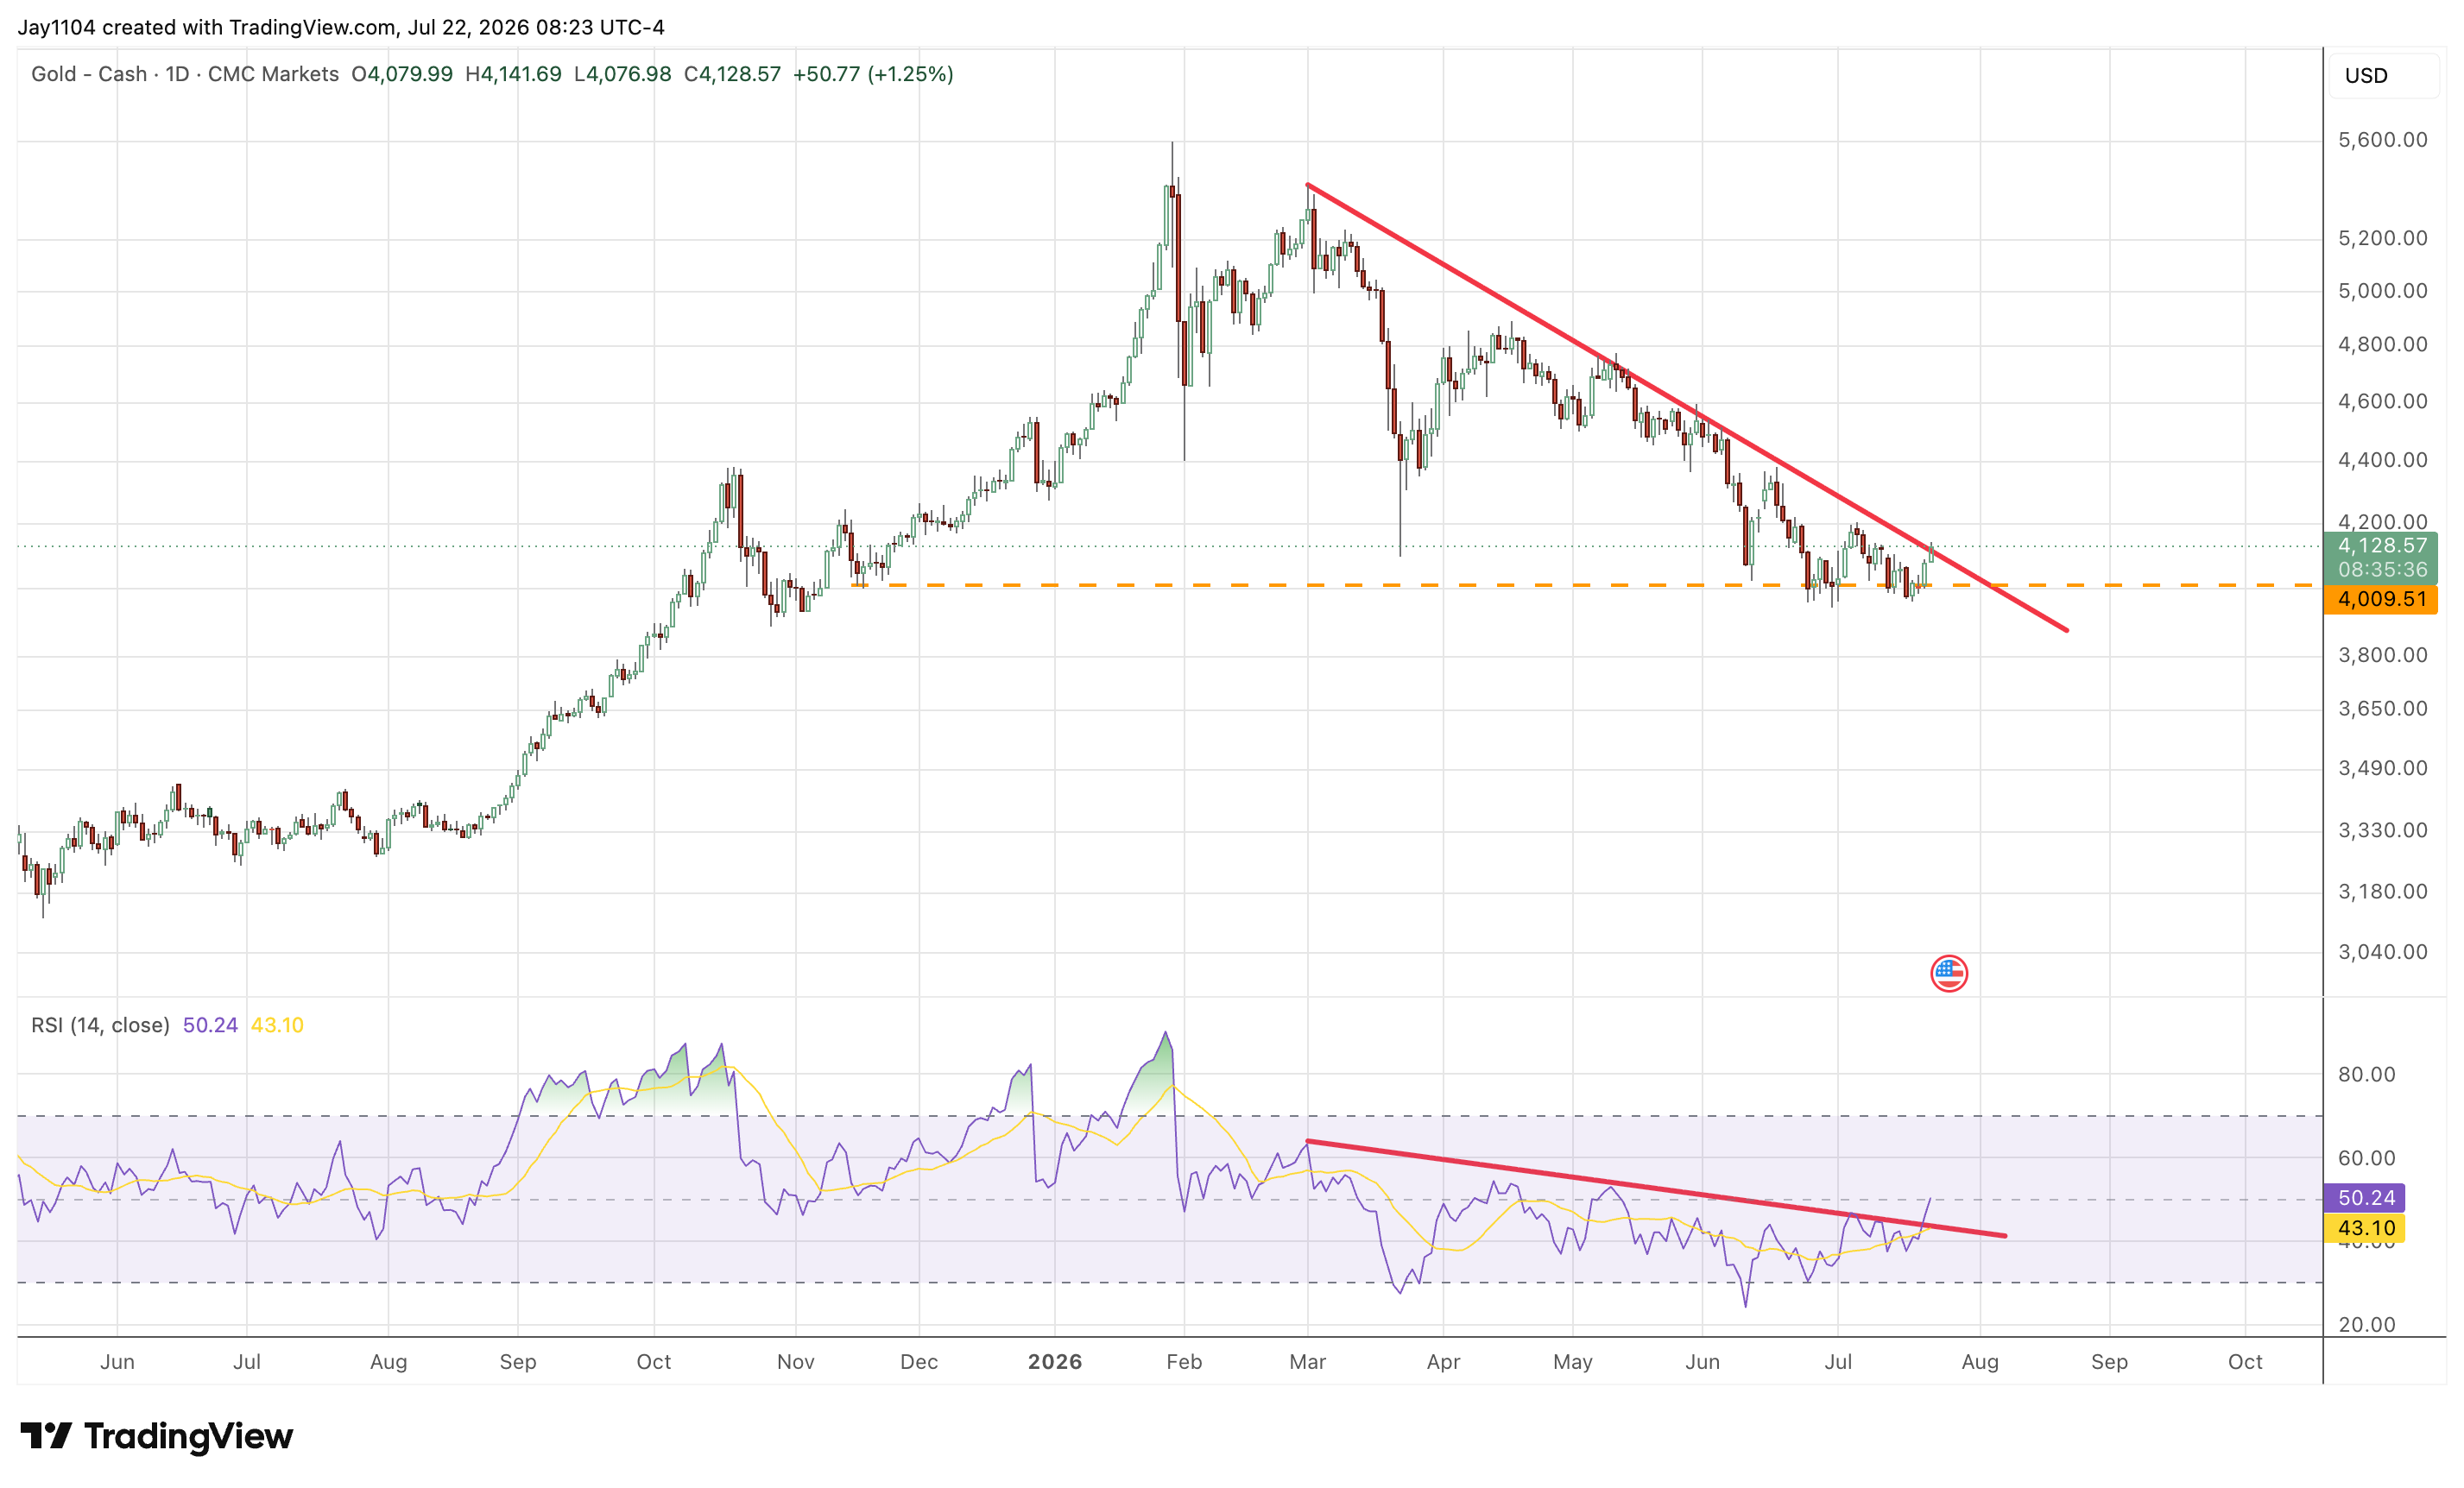
Gold has been in a downtrend since peaking in early March, testing the trendline several times in mid-May and early June but failing to produce a breakout. It is now approaching the trendline again, with resistance around $4,130.
A breakout above $4,130 would be a positive development and could pave the way for a move back towards $4,400.
Moving averages leave more to prove
Gold is still consolidating and has only recently moved slightly above both its 10-day exponential moving average and 20-day simple moving average. The 50-day simple moving average sits just ahead at around $4,250.
The trendline has been tested several times, but so far it has failed to produce a meaningful breakout. That keeps the current move in a testing phase rather than confirming a full technical shift.
Gold - Cash, 2025 to present
Sources: TradingView, Michael J Kramer.
Support and macro headwinds remain critical
Gold continues to hold support around $4,000, although the broader technical picture still resembles a descending triangle, a bearish technical pattern.
Fundamentals are also working against gold, with rising real yields and a strengthening potentially acting as a headwind for precious and industrial metals.