
Heikin Ashi
The Heikin Ashi — also spelled Heiken Ashi — is both a technical analysis indicator and a chart type, depending on how it is used. Traders that familiarise themselves with Heikin Ashi can use it to their advantage to help determine trends and trend reversals in a wide range of financial markets. This can be applied to different trading strategies also, such as day trading and swing trading.
Read on to discover how to use Heikin Ashi as part of your trading strategy with examples taken from our online trading platform, Next Generation.
What is the Heiken Ashi indicator?
Heikin Ashi translates to “average bar” in Japanese. The formula averages out the price movements of a typical candlestick chart. Because the Heikin Ashi is taking an average of the price movements, this chart type tends to show trends and trend reversals more clearly than standard candlestick charts.
Heikin Ashi is useful for short-term trading strategies, whether day trading or swing trading. It can be used in any market, including forex, stocks, commodities and indices. This chart type and indicator can help a trader to spot trends and stay in winning trades. However, before using it, traders must understand how it works, as the averaging of prices can also produce pitfalls.
Heikin Ashi candle patterns
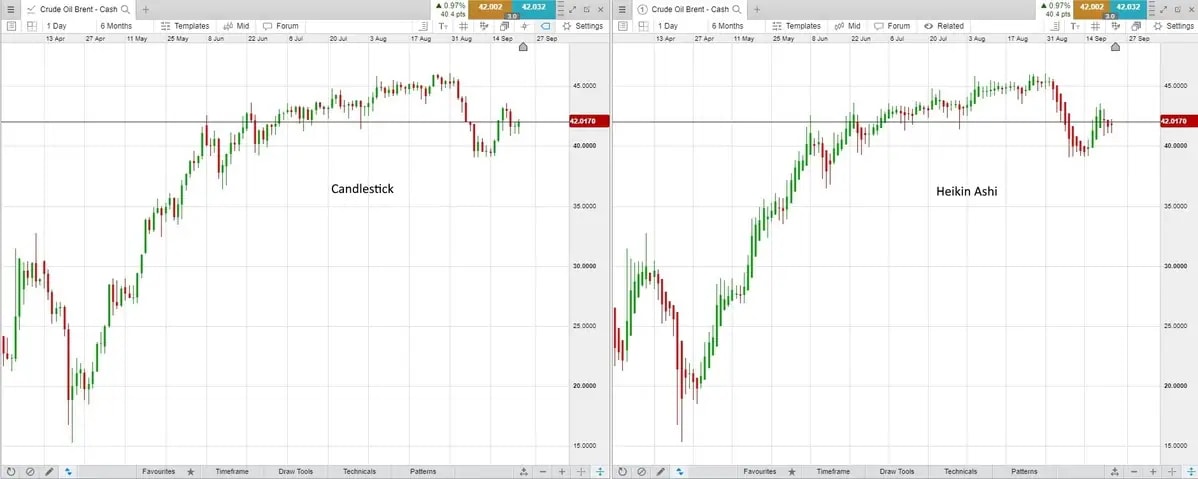
Heikin Ashi is a variation of a candlestick chart that is calculated in a different way. A traditional candlestick chart shows the opening and closing prices as the thick part of the candle (real body), and the high and low as the upper and lower shadows. These are the exact open, high, low, and close values for the asset during that timeframe. There is no manipulation of the data.
The Heikin Ashi also has a thick part called the “real body” and upper and lower shadows. The values used to create the open, high, low, and close (OHCL) for the Heikin Ashi candle are not OHLC values that the underlying asset had. The Heikin Ashi candles are instead based on average prices of both the current and prior timeframe. This is what makes Heikin Ashi charts smoother.
Below is an example of a chart of the same asset using both Heikin Ashi and standard candlesticks.
Renko vs Heiken Ashi
A Heikin Ashi chart takes an average of prices to create candles. Renko charts also smooth out price movements, but they use a different formula and have a different look.
A Renko chart is composed of bricks or boxes of a certain size. The size can be selected (such as $1 or 30 pips) or it can be based on the average true range. A new Renko box forms when the price of the underlying asset moves the required amount. For example, if the box size is $1 and the trader is using a five-minute Renko chart, a new box will form when the price moves up a dollar or more on a closing based on the five-minute chart. Renko bricks move and drop at 45-degree angles and are never directly beside each other. Therefore, it takes a $2 drop (or two chosen brick sizes) for the Renko chart to start moving down.
Renko charts are not based on time, only price movement, although time is still placed on the x-axis of the chart. One Renko brick could take multiple days to form, while on another day, many bricks may form, depending on how much price action there is.
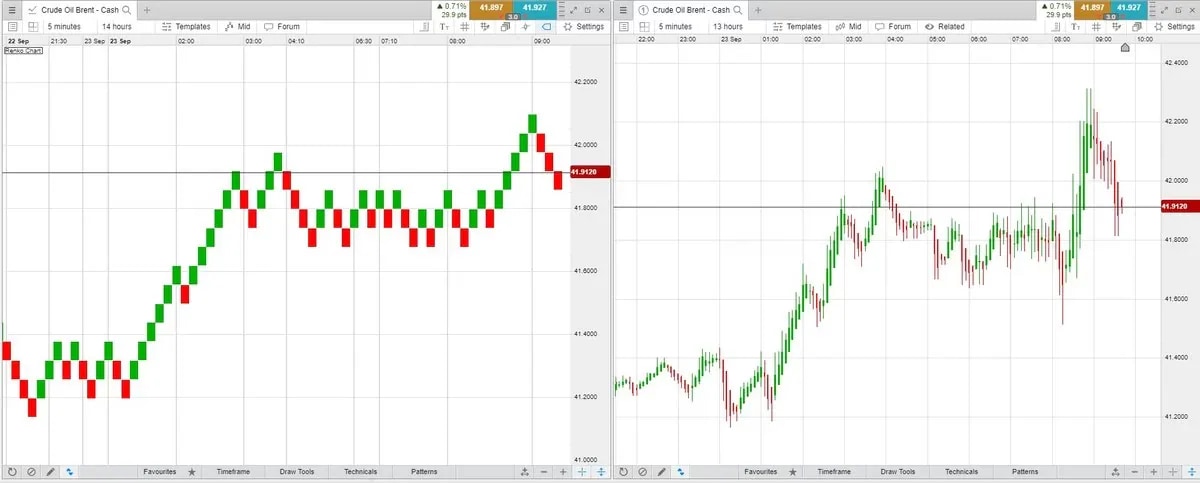
The following example chart for Brent Crude Oil shows approximately half a day of price history. The left chart is a Renko chart with a $0.06 brick size based on five-minute closing prices. The chart on the right is a Heikin Ashi chart.
Heikin Ashi calculation
Let’s look at how the Heiken Ashi (HA) chart is created. There are four distinct calculations for the open, close, high, and low of each Heikin Ashi candle.
The HA close is the average of the actual high, low, open, and close price for the time period for the asset.
(High + Low + Open + Close) / 4
The HA open is the average of the prior Heikin Ashi candle open and close.
(Prior HA Open + Prior HA Close) / 2
The HA candle high is the highest of three price levels
The current high price
The current HA open price
The current HA close price
The HA low is the lowest of three price levels
The current low price
The current HA open price
The current HA close price
How to use the Heiken Ashi indicator
While Heikin Ashi is a chart type, it is also a technical indicator as it is taking actual price levels of the underlying asset then converting those prices based on the Heikin Ashi formula.
Heikin Ashi price values will vary from those on a candlestick chart. The current price on a candlestick chart represents the most recent transaction or bid price, but the current price on a Heikin Ashi chart is the current calculation of the HA close price. These numbers can sometimes be drastically different.
Traders typically use Heiken Ashi to help to smooth out price data and see trading patterns such as trends and reversals better. However, the prices seen on the chart are often not tradable as the actual price of an asset could be different. It is a good idea to keep an eye on the actual price as well as the Heikin Ashi indicator to get the best of both worlds: real-time data as well as confirmation and analysis.
Heiken Ashi moving average strategy
The Heikin Ashi provides its own trade signals by alerting traders when the price is changing direction. It does this by changing colour and direction, from red to green or green to red. Green candles show buying pressure (bullish trend), while red candles show selling pressure (bearish trend). Adding in a moving average indicator can help to filter these signals, so trades are only taken in the more dominant trend direction.
A 50-period simple moving average (SMA) is added to the following silver daily chart, along with a 12-period SMA. As you can see, there are some smooth trends but also some choppy periods which are ignored by the simple moving average line.
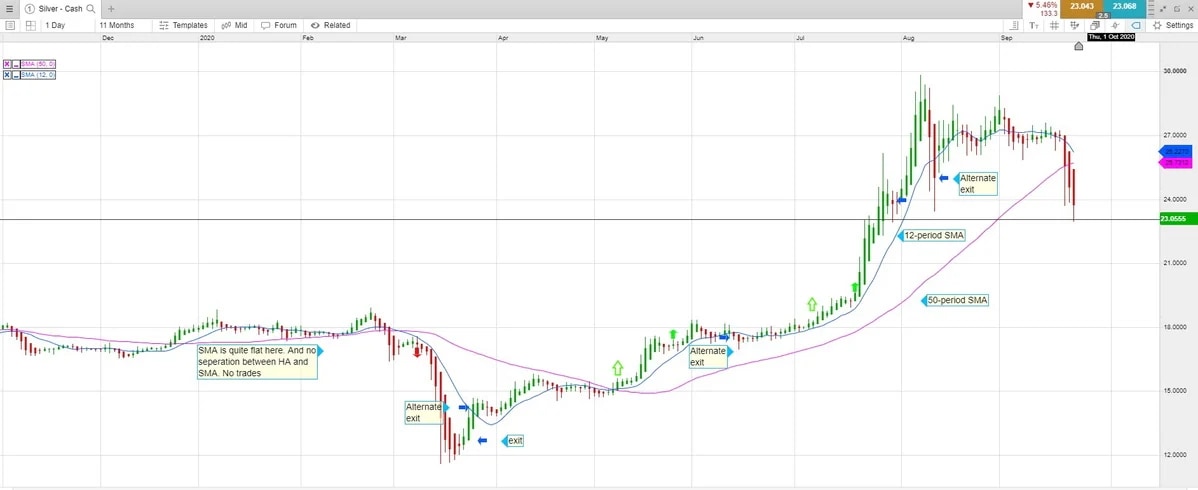
Some simple rules could have helped capture profits during trending times:
Only buy when HA has turned from red to green within the last few candles and the HA is above the 50-SMA (with space between the HA and SMA) and the SMA is angled upward.
Heikin Ashi must also be above the 12-period SMA with separation.
Exit trades when the HA turns from green to red.
An alternative is to exit when the HA has a close below a shorter SMA, such as the 12-period.
Only short when the HA has turned from green to red in the last few candles and the HA is below the SMA (with space between) and the SMA is angled down.
Heikin Ashi must also be below the 12-period SMA with separation.
Exit trades when the HA turns to green from being red.
An alternative is to exit when the HA has a close above a shorter SMA, such as the 12-period.
Using the Heikin Ashi in swing trading
Heikin Ashi charts can be used on any timeframe. The calculation is applied to the chosen time frame. Swing traders typically look at hourly, four-hour, or daily charts. The possible strategy discussed above could be applied to stocks, forex, commodities or stock indexes. Let’s look at another example, this time using an hourly chart of a stock index. If an asset is volatile, traders could look for separation between the Heikin Ashi candles and SMAs. If the asset isn’t as volatile, like a stock index, then separation becomes less important because it will not occur as often.
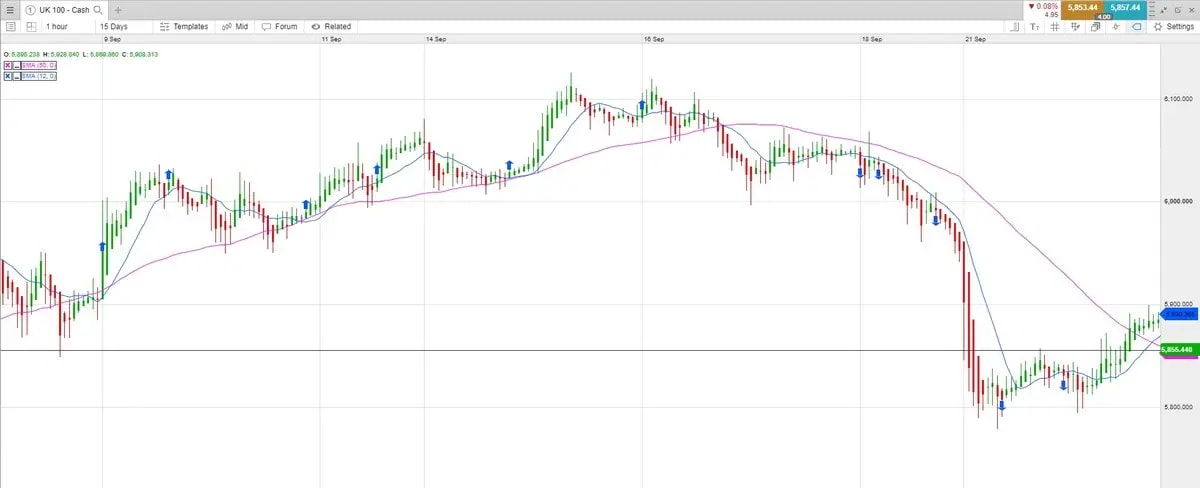
The chart above shows potential entry points. Not all produced a big profit and some instead produced small losses. There were also some large profit trades using the exit techniques of the HA turning colour or the HA crossing and closing on the other side of the shorter SMA.
Scalping with Heikin Ashi
Scalping is a short-term trading strategy where the trader is quickly getting in and out of trades, often multiple times each day. Scalping in forex is the common market to use this strategy for. While Heikin Ashi charts can be used on any timeframe, scalping with Heikin Ashi can cause some issues because the HA charts do not show the exact asset price at this moment. The HA charts are calculated based on a formula. When making fast-paced trades, every penny, pip, or tick counts, so knowing the exact price is important.
Heiken Ashi reversal patterns
Short-term trend reversal patterns occur when the Heikin Ashi chart turns from red to green or green to red. Larger reversal patterns can be more reliable. Heikin Ashi reversal patterns are the same as candlestick reversal chart patterns, such as head and shoulders, rounded bottoms, and triple and double tops and bottoms.
When a reversal pattern occurs, it can be traded just like a candlestick version. Alternatively, you could use a moving average exit, such as the one described earlier, and exit when the price travels through a moving average (such as the 50-period) in the opposite direction of the trade. Here is a head and shoulders reversal on a four-hour USD/CAD chart.
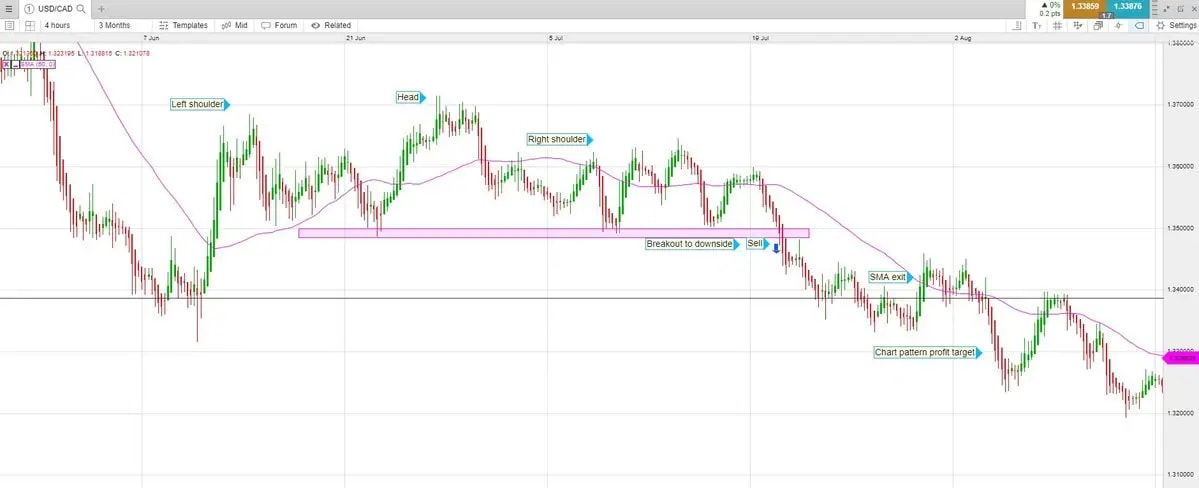
A short entry is taken when the price breaks below the head and shoulders reversal pattern. The trade is exited when the price crosses above the 50-period SMA or when the price reaches the profit target for a head and shoulders pattern. The estimated target for a head and shoulders is the height of the pattern (approximately 1.37 — 1.35) subtracted from the breakout point (near 1.35) for a target near 1.33.
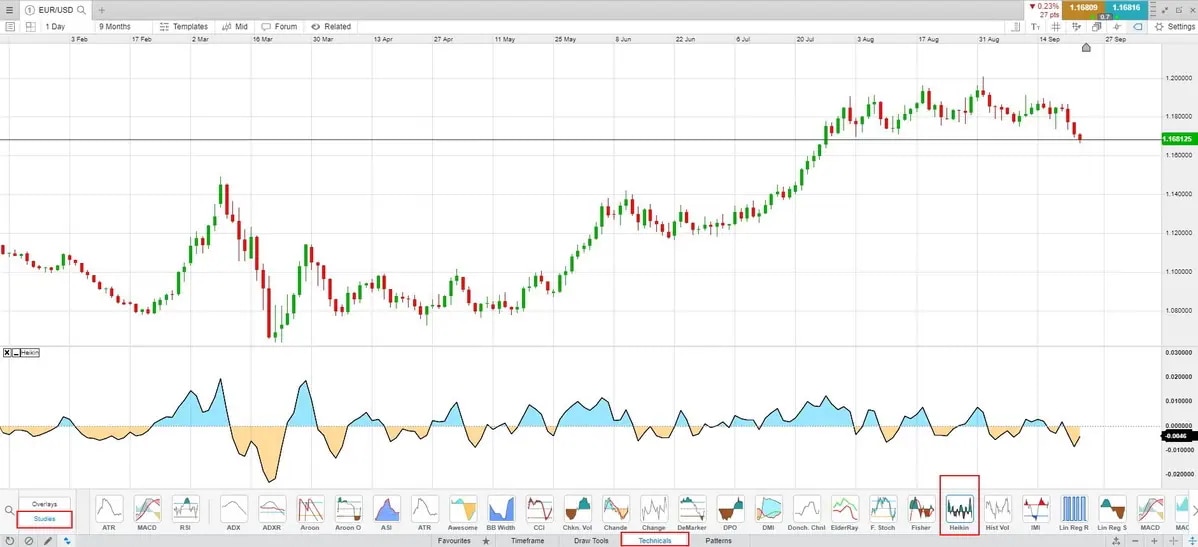
Heiken Ashi difference indicator
Candlestick charts work well when adding a Heikin Ashi indicator to the chart. The Heikin Ashi indicator drops below zero when the HA chart turns red or starts moving down. The indicator moves above zero when the HA chart turns green or starts rising. Our Next Generation platform offers the Heiken Ashi indicator to combine with candlestick charts, or any other chart that you prefer. Register for a live account here to test the capabilities of web-based trading.
Heikin Ashi indicator for MT4
We also offer MetaTrader 4 software through our platform, which comes with a wide range of technical and customised indicators for each trading strategy. By default, MT4 does not offer Heikin Ashi charts or indicators; however, there are thousands of user-created indicators available for download within the platform. Open an MT4 account now to get started.
When installing these products, please keep in mind that they were created by other MT4 users and not users from our own platform, and have therefore not been vetted for reliability, accuracy, or profitability.
Is the Heikin Ashi indicator reliable?
Heikin Ashi charts and indicators can smooth-out price fluctuations, which makes trends easier to spot and trade. However, when a Heikin Ashi trade signal occurs, the actual price may be quite different to what the latest HA close is showing. This could make some trade signals obsolete. For example, if a Heikin Ashi signal says to buy a stock at $5, but the price gapped higher and is already trading at $7. The difference between the trade signal and actual price may be too large and thus negate the profitability of a potential trade.
Since HA charts are based on average price movements, it also makes them hard to use for setting stop-loss levels. In the strategy examples, a trailing stop-loss was used with the moving average, or a change in colour on the HA chart. These can work but the risk is unknown at the start of the trade. To control the risk with a fixed stop-loss level, referring to a normal candlestick chart is required. This way, the stop-loss can be set based on the price levels and patterns the price actually made, not an HA average, which distorts where the price has actually been.
Similar to any other technical indicator, traders need to understand how Heikin Ashi works, along with its benefits and pitfalls, before being able to utilise it effectively in trading.
Disclaimer: CMC Markets is an execution-only service provider. The material (whether or not it states any opinions) is for general information purposes only, and does not take into account your personal circumstances or objectives. Nothing in this material is (or should be considered to be) financial, investment or other advice on which reliance should be placed. No opinion given in the material constitutes a recommendation by CMC Markets or the author that any particular investment, security, transaction or investment strategy is suitable for any specific person. The material has not been prepared in accordance with legal requirements designed to promote the independence of investment research. Although we are not specifically prevented from dealing before providing this material, we do not seek to take advantage of the material prior to its dissemination.

