What is implied volatility?
Understanding volatility in financial markets
Volatility, in its simplest sense, describes how much and how quickly prices change. When traders ask what is volatility in trading, they typically want to know how turbulent a market or instrument has been, or might become.
Market volatility centres on the degree of price fluctuation. A stock that swings 2% daily is more volatile than one that moves 0.5%. Volatility itself is neither good nor bad. It simply measures uncertainty and the potential range of outcomes.
High volatility often signals uncertainty. Markets tend to become more volatile around economic announcements, geopolitical events or company-specific news. Low volatility periods, by contrast, suggest relative calm and narrower expected price ranges.
Historical volatility vs implied volatility
Historical volatility, sometimes called realised volatility, measures how much an asset’s price has actually moved over a past period. It is calculated using standard deviation of past returns, typically over 20 or 30 trading days.
Implied volatility, on the other hand, is forward-looking. It represents what the market collectively expects volatility to be in the future, as reflected in options prices. Think of it this way: historical volatility tells you where the road has been bumpy; implied volatility tells you how bumpy drivers expect the road ahead to be.
The two often diverge. Implied volatility can spike before an earnings release even if the stock has been calm for months. Past volatility is not a reliable indicator of future volatility, which is precisely why the market’s forward estimate can differ substantially from historical readings.
How implied volatility is calculated
Implied volatility is not observed directly. Instead, it is derived by working backwards from an option’s market price using a pricing model.
The process begins with the known inputs: the current price of the underlying asset, the option’s strike price, time to expiration, prevailing interest rates and any expected dividends. With these values and the option’s actual trading price, a mathematical model solves for the volatility figure that would produce that price. This solved value is the implied volatility.
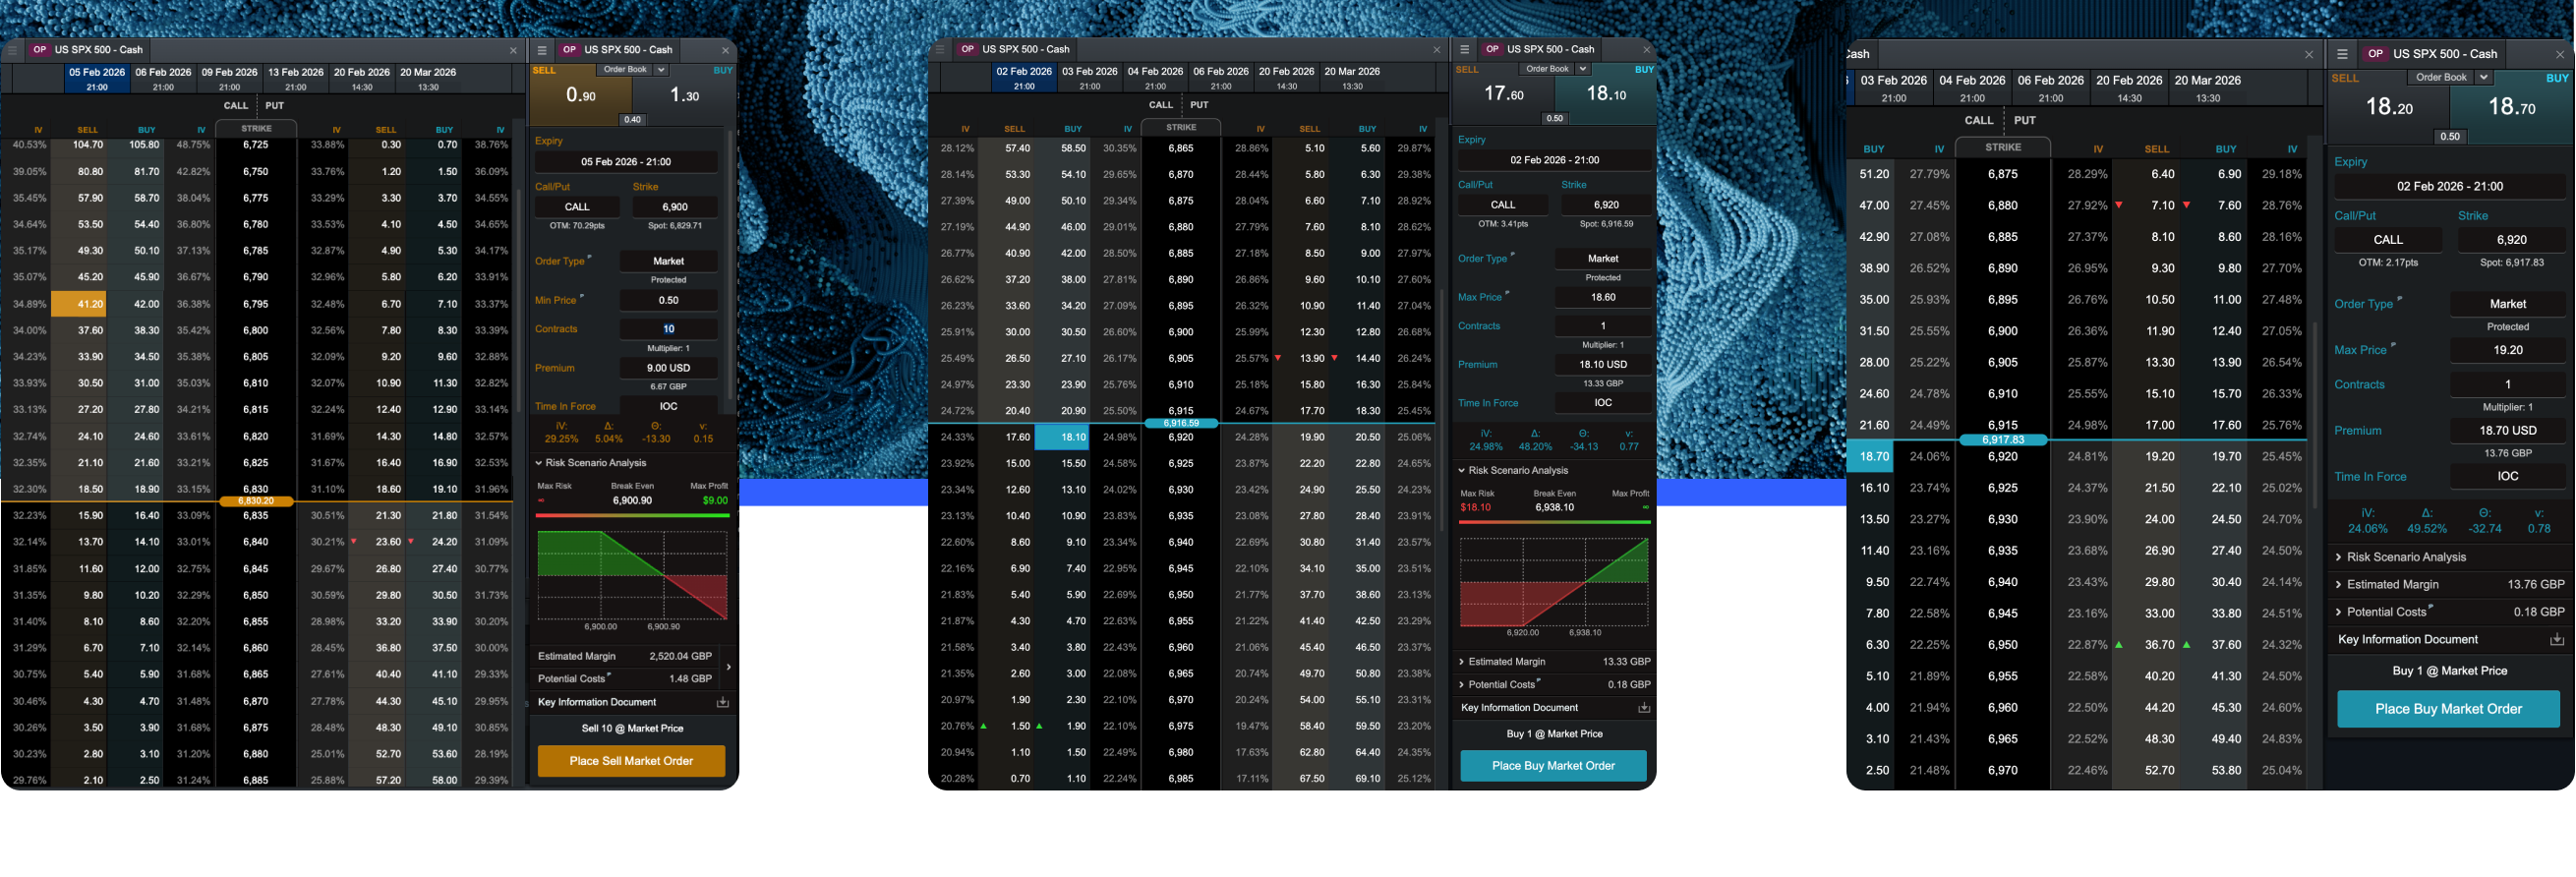
An implied volatility calculator automates this process. Many brokers and data platforms provide IV figures alongside option quotes, sparing you the manual computation.
The role of option pricing models
The Black-Scholes model, developed in the early 1970s, remains the most referenced framework for pricing European-style options. It assumes that underlying prices follow a random walk with constant volatility and that markets are frictionless. The implied volatility formula embedded within Black-Scholes cannot be solved algebraically for volatility, so numerical methods are used to iterate toward the correct figure.
Other models exist. The binomial model handles American-style options, which can be exercised before expiration. More advanced approaches account for features Black-Scholes ignores, such as changing volatility over time or price jumps.
Regardless of which model is used, the principle is the same. Given all other known factors, the implied volatility is the missing variable that aligns the model’s theoretical price with the option’s market price.
Why implied volatility matters for options traders
Options prices consist of two components: intrinsic value and time value. Intrinsic value is straightforward, reflecting how much the option would be worth if exercised immediately. Time value captures everything else, including the probability that the option could become more valuable before expiration. Implied volatility is a major driver of that time value.
When implied volatility rises, option premiums increase, all else being equal. When implied volatility falls, premiums decline. This relationship holds for both calls and puts.
Consider a hypothetical scenario. Suppose a stock trades at £100 and a one-month call option with a strike of £100 costs £3. If implied volatility rises sharply due to an upcoming product launch, that same option might rise to £4.50, even if the stock price remains unchanged. The market is pricing in a wider range of possible outcomes.
This dynamic means that buying options when implied volatility is elevated can be costly. The underlying asset must move further, or faster, simply to offset the premium paid. Conversely, selling options during high implied volatility periods may generate higher premiums, though this carries its own substantial risks, including potentially unlimited losses on naked short positions.
Factors that influence implied volatility
Several forces push implied volatility higher or lower.
Scheduled events are a primary driver. Earnings announcements, central bank meetings, regulatory decisions and economic data releases all create uncertainty about near-term price direction. Implied volatility typically rises in the days leading up to such events and often falls sharply afterwards, a phenomenon sometimes called volatility crush.
Market sentiment also plays a role. Fear tends to inflate implied volatility. During broader market stress, IV across many assets rises simultaneously as traders seek protection. Calm, steadily rising markets often see subdued implied volatility.
Supply and demand for options themselves matter. Heavy demand for protective puts can push up IV even if the underlying asset has not moved materially. Similarly, large option block trades by institutional investors can shift IV readings.
Liquidity conditions, time to expiration and proximity of the strike price to the current asset price all influence implied volatility levels as well. Options with longer expirations generally carry higher IV because more can happen over extended periods.
Reading and interpreting IV levels
Understanding volatility in finance becomes practical when you can interpret IV readings in context.
A single IV number means little on its own. An IV of 30% might be elevated for a utility stock but subdued for a volatile technology firm. Context matters.
Traders often compare current IV to its historical range for that asset. If current IV sits in the upper tenth of its 12-month range, options are relatively expensive compared to recent history. If IV sits in the lower tenth, options are relatively cheap. This comparison helps frame expectations but does not guarantee future outcomes.
Implied volatility tells you nothing about direction. High volatility meaning in this context is that the market expects large moves, but those moves could be up, down or both over time. Relying on IV to predict whether prices will rise or fall is a misuse of the measure.
Limitations and risks of relying on implied volatility
Implied volatility is a useful gauge of market expectations, but it has clear limitations.
First, IV is an estimate, not a forecast. Markets frequently misjudge how much an asset will actually move. Realised volatility can end up higher or lower than implied volatility suggested. Past volatility is not a reliable indicator of future volatility, and neither is implied volatility a reliable predictor.
Second, IV can change rapidly. A calm morning can turn into a volatile afternoon if unexpected news breaks. Traders holding options positions can see values shift dramatically based on IV movements alone, even without any change in the underlying asset’s price.
Third, high implied volatility does not mean an option is a bad purchase, nor does low IV mean it is a bargain. Whether an option proves worthwhile depends on how actual price movements compare to the volatility priced in at the time of purchase, a fact known only in hindsight.
Fourth, relying on IV as a trading edge without understanding the broader context can lead to losses. The options market is competitive, and implied volatility reflects the collective views of sophisticated participants. There is no guarantee that understanding IV will lead to profits, and substantial losses are possible.
Key takeaways
Implied volatility is a forward-looking measure derived from current option prices, reflecting the market’s expectation of future price fluctuations.
It differs from historical volatility, which measures past price movements.
Option pricing models, such as Black-Scholes, are used to extract IV from market prices.
Higher IV increases option premiums; lower IV reduces them.
Scheduled events, market sentiment and option supply and demand all influence IV.
IV indicates expected magnitude of moves, not direction.
Past volatility and implied volatility are not reliable predictors of future volatility or asset direction.
Options are complex instruments with a high risk of loss. Ensure you understand the risks before trading.
Historical volatility measures how much an asset’s price has actually fluctuated over a past period, using recorded price data. Implied volatility is forward-looking and reflects the market’s current expectation of future fluctuations, derived from option prices. The two can diverge significantly, particularly around anticipated events.
Implied volatility is calculated by taking an option’s market price and using a pricing model, such as Black-Scholes, to solve for the volatility figure that produces that price. Because the formula cannot be rearranged to isolate volatility directly, numerical methods iterate until the model price matches the market price.
Uncertainty increases before significant announcements because the outcome and market reaction are unknown. Traders buying options for protection or speculation drive up demand, which raises option premiums and, consequently, implied volatility. Once the event passes and uncertainty resolves, IV typically falls.
High IV means the market expects larger price swings, so option premiums are elevated to reflect that expected movement. Low IV means smaller expected swings and lower premiums. Neither reading guarantees that actual moves will match expectations, and options can still lose value regardless of IV levels.
No. Implied volatility indicates the expected magnitude of price changes, not the direction. A stock with high IV could move sharply up, sharply down or remain flat. IV is a market estimate, not a forecast, and realised volatility often differs from what was implied.
Disclaimer: CMC Markets is an execution-only service provider. The material (whether or not it states any opinions) is for general information purposes only, and does not take into account your personal circumstances or objectives. Nothing in this material is (or should be considered to be) financial, investment or other advice on which reliance should be placed. No opinion given in the material constitutes a recommendation by CMC Markets or the author that any particular investment, security, transaction or investment strategy is suitable for any specific person. The material has not been prepared in accordance with legal requirements designed to promote the independence of investment research. Although we are not specifically prevented from dealing before providing this material, we do not seek to take advantage of the material prior to its dissemination.