USD/JPY is nearing a potential breakout above ¥160 following a hotter-than-expected US consumer price index (CPI) report on 11 November. The exchange rate is currently above ¥159, marking the upper end of the trading range since late September. USD/JPY also appears to be breaking out of a bullish continuation pattern, which could be either a cup and handle or a bull flag. In either case, the pattern suggests that the exchange rate could move higher.
Bullish patterns point towards ¥164
If the breakout holds and momentum continues to build, projections based on the two bullish technical patterns suggest that USD/JPY could return to the highs seen in late July, around ¥164. That would likely put additional pressure on the Bank of Japan to raise interest rates at its next policy meeting in December. It may also prompt government officials to talk about intervention again to curb any further rise in USD/JPY, which would signal that the yen is weakening against the dollar.
RSI and moving average support momentum
The relative strength index (RSI) is also breaking out of its own resistance zone, crossing above 58 and suggesting momentum is building. With the RSI currently at 61, there appears to be plenty of room for momentum to build and for USD/JPY to rise further before the RSI crosses above 70 and signals overbought conditions. The exchange rate is also breaking above its 200-day moving average, another bullish sign.
A failed breakout could put ¥157 back in focus
If the breakout fails, USD/JPY would likely fall back towards support around ¥157, at the lower end of the trading range.
USD/JPY price and RSI
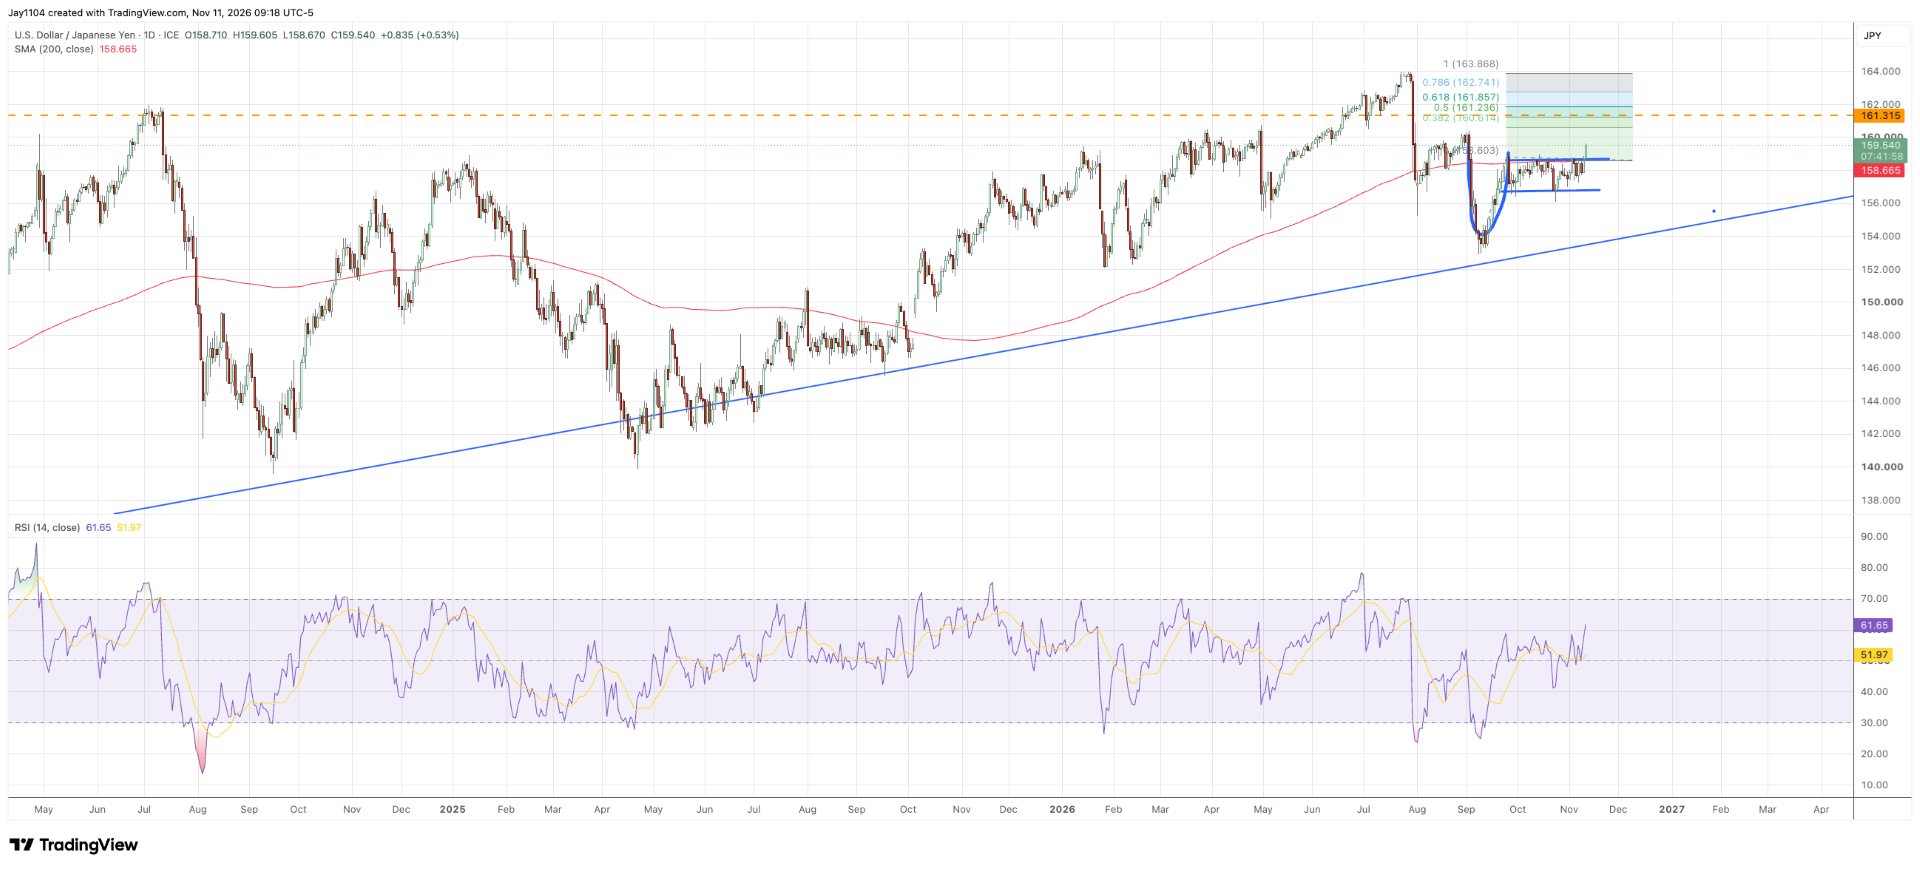
Source: TradingView, 11 November 2026