
USD/JPY has pushed through the July 2024 highs
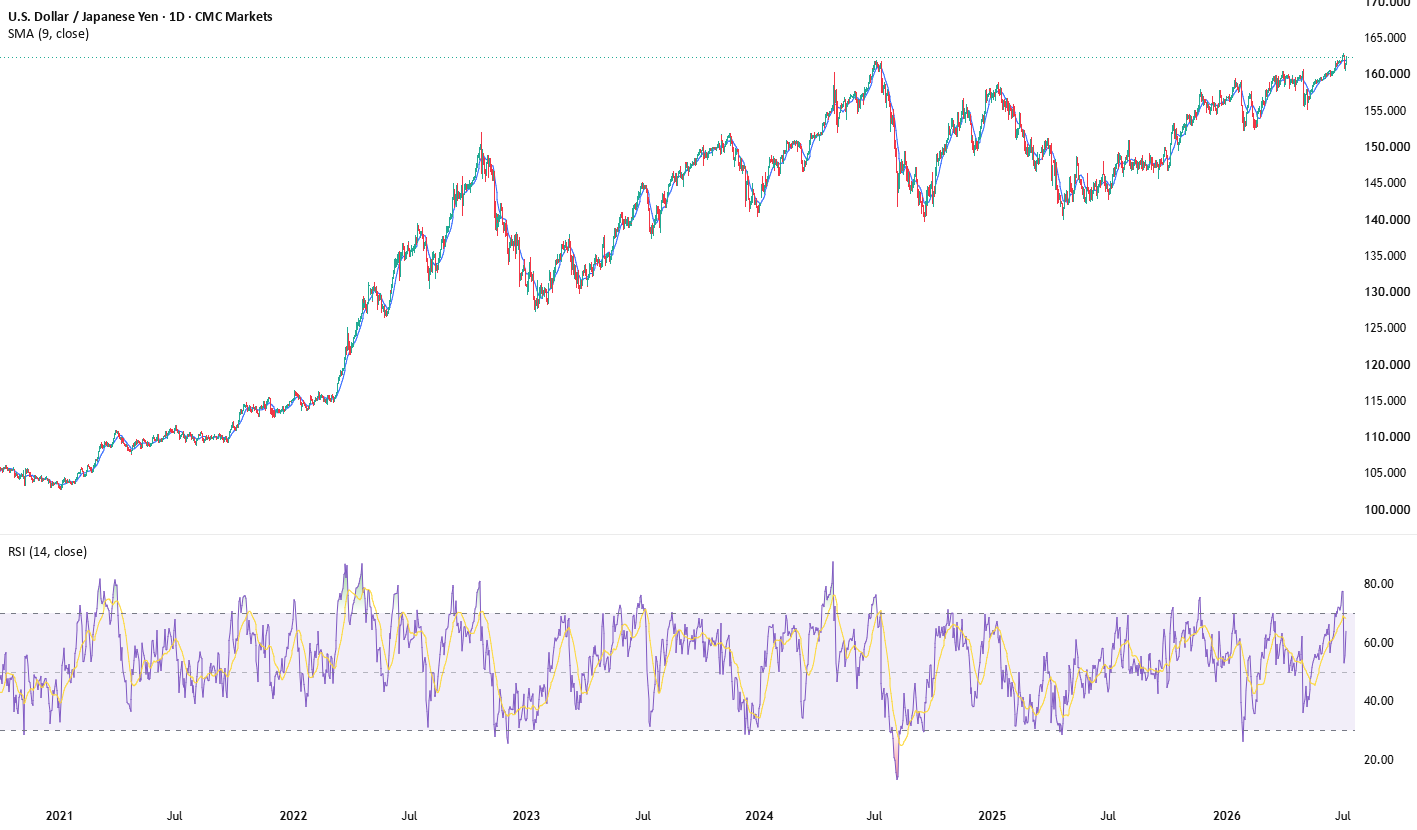
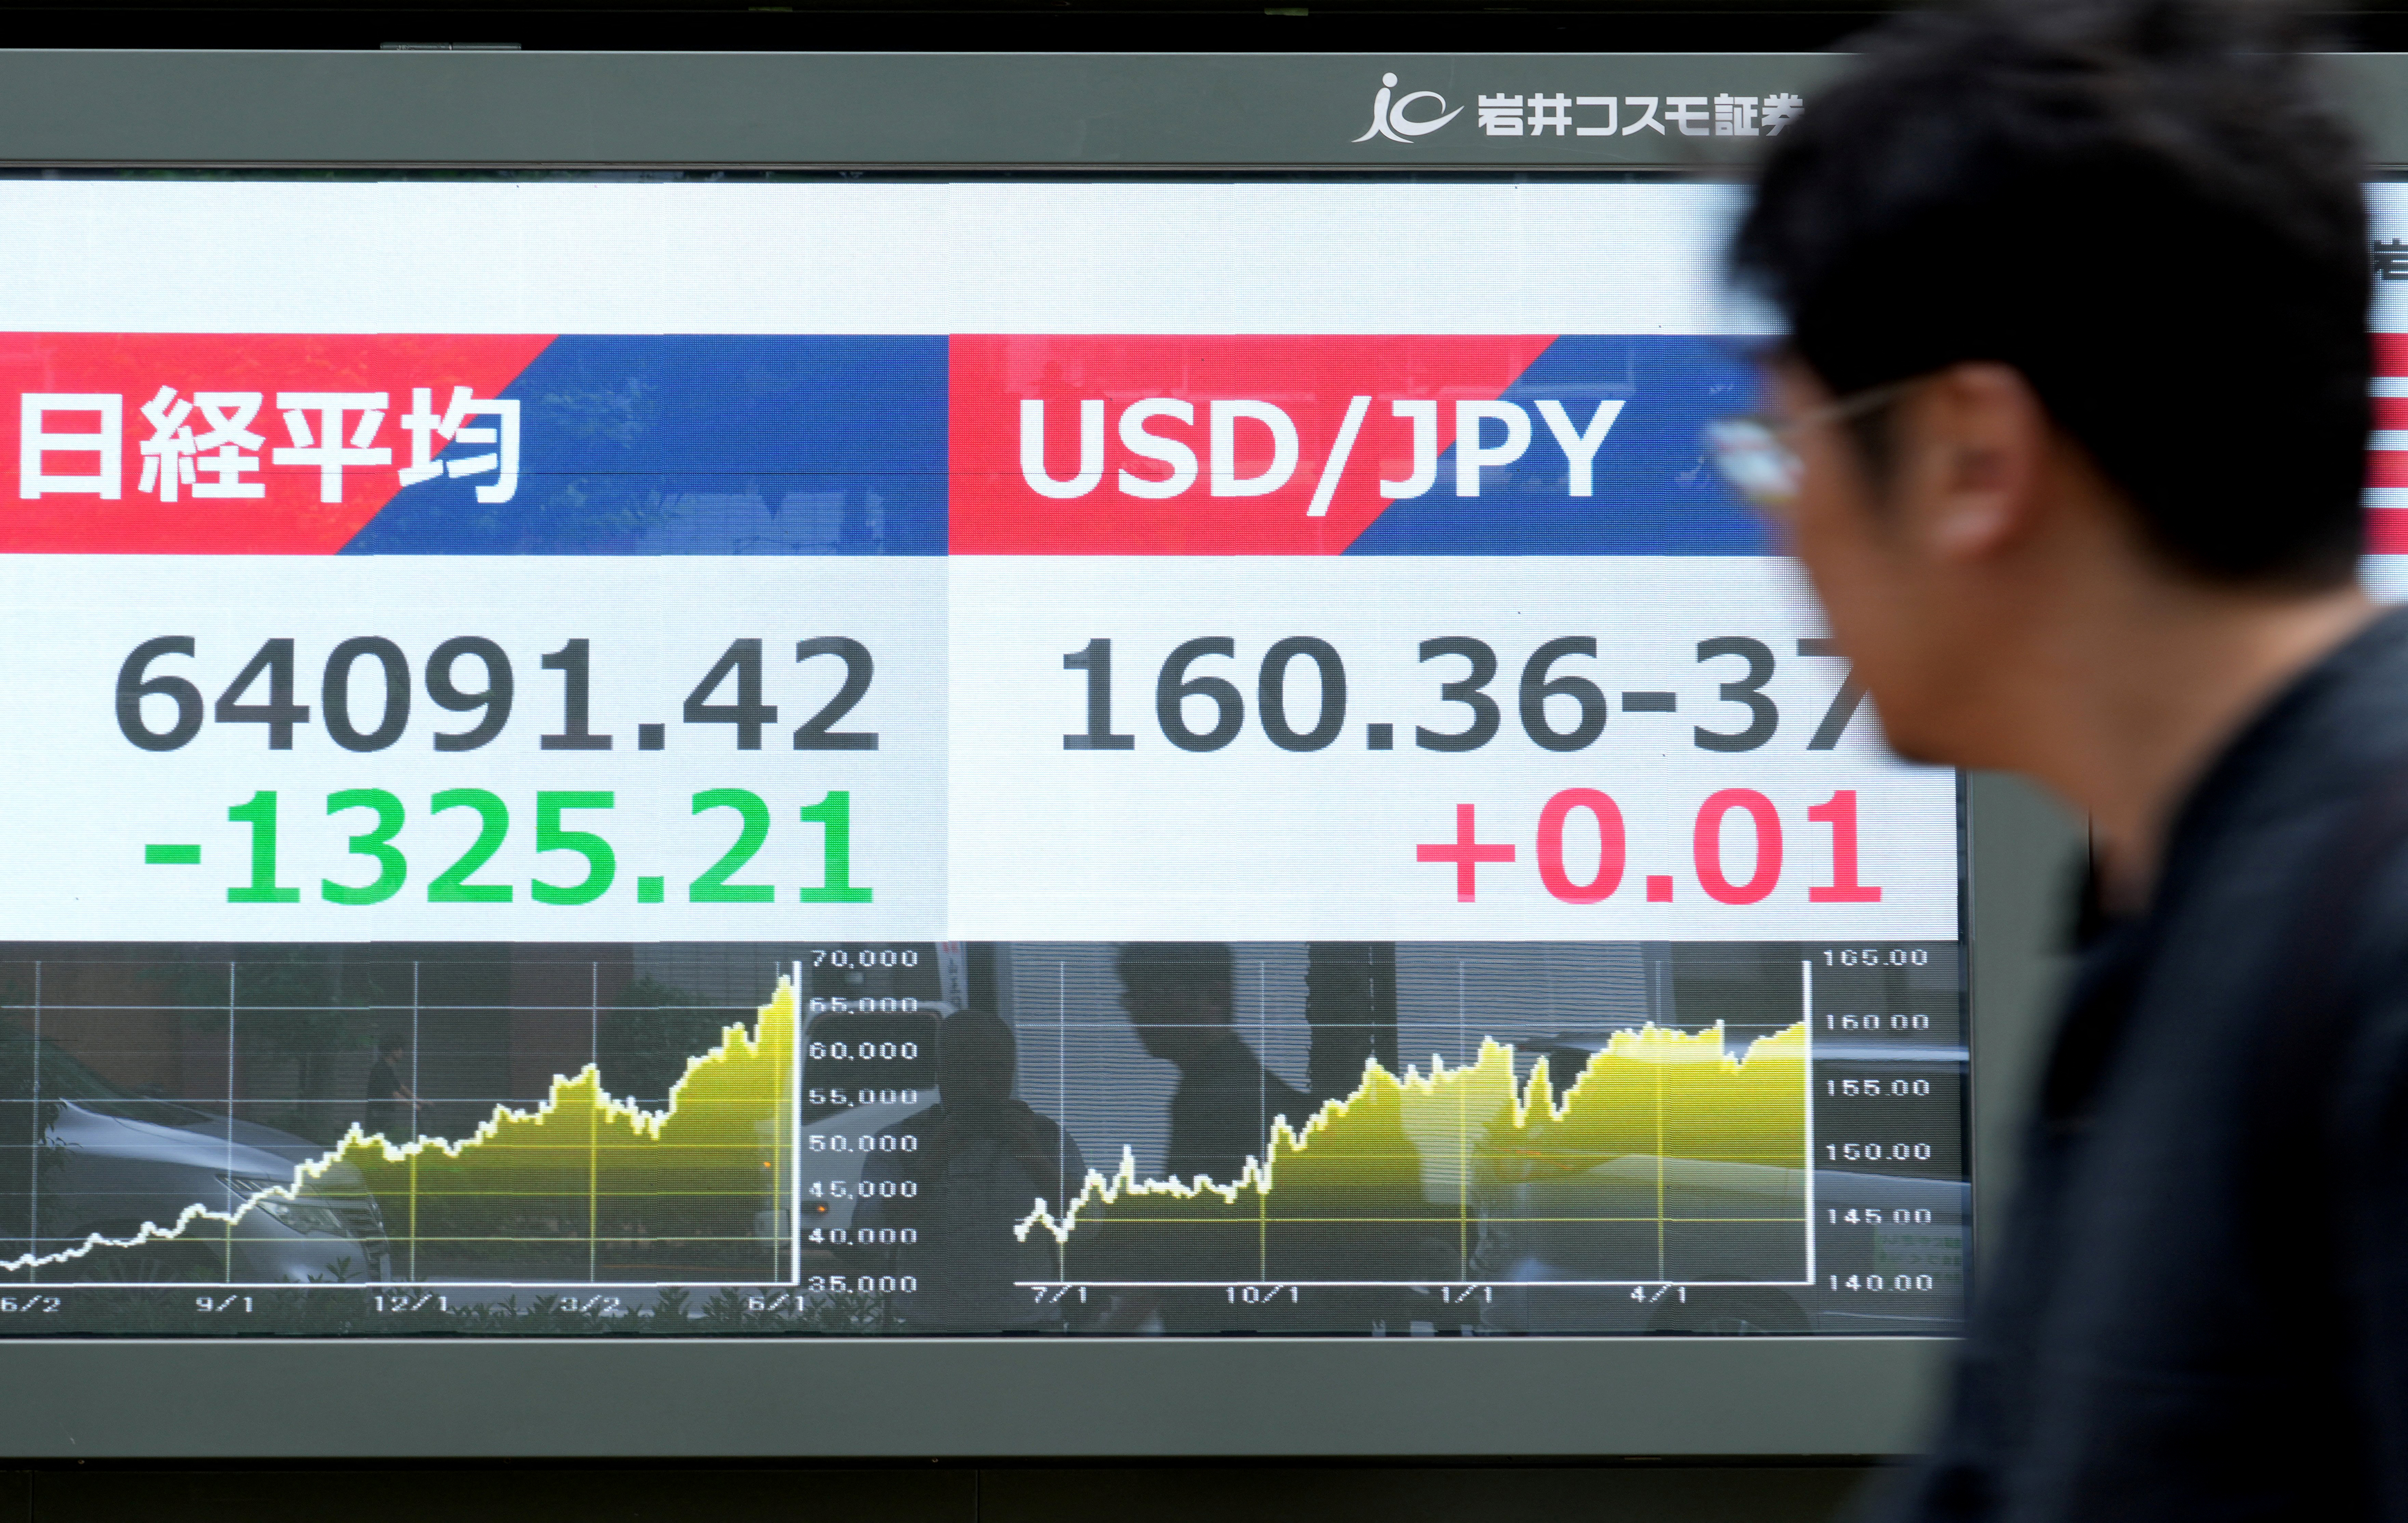
USD/JPY has climbed above the highs reached in July 2024 and is now trading near 162.30, according to the TradingView analysis. That breakout matters because it removes a resistance area that had already been associated with heightened intervention sensitivity from Japanese policymakers.
With that ceiling now breached, the next technical level in focus comes in around 164.50. The source notes that this area was last seen in November 1986, which underlines how far the yen has already weakened against the dollar.
The weekly chart still points to bullish momentum
The weekly chart remains the clearest way to read the move. The prior resistance zone around 161.95 has given way, while the relative strength index is running near 65.40 and still below the conventional overbought threshold of 70.
That combination suggests momentum remains firm without yet looking exhausted. In other words, the breakout is not only about price clearing an old high - the supporting momentum picture still leaves room for the move to extend.
Longer-term chart patterns imply the move could be bigger still
The source also highlights two longer-term technical structures on the weekly chart: an ascending triangle and an inverse head-and-shoulders pattern. Taken together, those formations suggest the latest move may be part of a broader breakout rather than a brief overshoot above resistance.
If that interpretation holds, the longer-run upside targets become much more ambitious. TradingView notes that such a breakout could eventually leave levels like 180 or even 200 in play, which would imply a materially weaker yen over time.