X

Select the account you'd like to open

Stochastic indicator

The stochastic oscillator, also known as stochastic indicator, is a popular trading indicator that is useful for predicting trend reversals. It also focuses on price momentum and can be used to identify overbought and oversold levels in shares, indices​, currencies and many other investment assets.

The stochastic oscillator measures the momentum of price movements. Momentum is the rate of acceleration in price movement. The idea behind the stochastic indicator is that the momentum of an instrument’s price will often change before the price movement of the instrument actually changes direction. As a result, the indicator can be used to predict trend reversals.

The stochastic indicator can be used by experienced traders and those learning technical analysis. With the help of other technical analysis​​ tools such as moving averages, trendlines and support and resistance levels, the stochastic oscillator can help to improve trading accuracy and identify profitable entry and exit points.

See inside our platform

Get tight spreads, no hidden fees and access to 12,000 instruments.

Stochastic indicator formula

The stochastic indicator is calculated using the following formula:

%K = 100(C - L14) / (H14 - L14)

where:

C = the instrument’s most recent closing price

L14 = the instrument’s lowest price of the 14-day period

H14 = the instrument’s highest price of the 14-day period

How does the stochastic indicator work?

The indicator works by focusing on the location of an instrument’s closing price in relation to the high-low range of the price over a set number of past periods. Typically, 14 previous periods are used. By comparing the closing price to previous price movements, the indicator attempts to predict price reversal points.

The stochastic indicator is a two-line indicator that can be applied to any chart. It fluctuates between 0 and 100. The indicator shows how the current price compares to the highest and lowest price levels over a predetermined past period. The previous period usually consists of 14 individual periods. For example, on a weekly chart, this will be 14 weeks. On an hourly chart, this will be 14 hours.

When the stochastic indicator is applied, a white line will appear below the chart. This white line is the %K line. There will also be a red line on the chart, which is the three-period moving average of %K. This is referred to as %D.

  • When the stochastic indicator is at a high level, it means the instrument’s price closed near the top of the 14-period range. When the indicator is at a low level, it signals the price closed near the bottom of the 14-period range.
  • The general rule for the stochastic indicator is that in an upward-trending​​ market, prices will close near the high. In contrast, in a downward-trending market, prices will close near the low. If the closing price slips away from the high or low, it signals that momentum​​ is slowing.
  • The stochastic indicator can be used to identify overbought and oversold readings. It can also predict trend reversals. There are a variety of strategies that traders use with the indicator.
  • The indicator is most effective in broad trading ranges or slow-moving trends.

How to read the stochastic indicator

The stochastic indicator is scaled between 0 and 100.

  • A reading above 80 indicates that the instrument is trading near the top of its high-low range. A reading below 20 signals that the instrument is trading near the bottom of its high-low range.
  • Readings above 50 indicate the instrument is trading within the upper portion of the trading range. Readings below 50 signal that the instrument is trading in the lower portion of the trading range.
  • When the stochastic lines are above 80, the indicator signals that the instrument is overbought. When the stochastic lines are below 20, it signals that the instrument is oversold.
  • Overbought and oversold levels are useful for predicting trend reversals.
  • If the stochastic indicator falls from above 80 to below 50, it indicates that the price is moving lower. If the indicator moves from below 20 to above 50, it signals the price is moving higher.
  • Traders also look for divergence. This is when the trendline​​​​​ of the stochastic and the trendline of the price move away from each other. This indicates that a price trend is weakening and may soon reverse.
Join a trading community committed to your success

Stochastic oscillator example

This example compares closing price with price range over a given time period to identify overbought and oversold situations.

This momentum indicator works on the basic assumptions that in an uptrend, today’s closing price is likely to be close to the highest recent close price, and that in a downtrend, today’s closing price is likely to be close to the lowest recent close price.

Stochastic oscillators display two lines: %K, and %D. The %K line compares the lowest low and the highest high of a given period to define a price range, then displays the last closing price as a percentage of this range. The %D line is a moving average of %K.

These two lines are shown on a scale of 1 to 100 with key trigger levels shown at 20 and 80. These lines are represented by a blue and an orange line. Any action outside these lines is considered to be particularly significant.

A stochastic study is useful when monitoring fast markets. However, its speed means that it should be used in conjunction with other indicators to confirm any signals, such as a stochastic RSI. If you want a more conservative equivalent, use the slow stochastic.

As with moving averages, when the two stochastic lines (%K and %D) cross, a signal is generated. If the white %K line crosses below the red %D line, a possible sell signal is generated. If the red %D line crosses below the white %K line, a possible buy signal is generated. These crossovers may appear anywhere on the study, but signals above the lines at 20 and 80 are considered to be stronger.

When the stochastic %K line crosses the 80 line, the product is considered to be overbought. When it crosses the 20 line, the product is considered to be oversold. However, in a strongly trending market the line may remain in this region for some time, so some traders consider the line moving back out of this zone as the confirmation of the end of a trend.

How to use the stochastic oscillator

Stochastic overbought/oversold strategy

In a basic overbought/oversold strategy, traders can use the stochastic indicator to identify trade exit and entry points.

Generally, traders look to place a buy trade when an instrument is oversold. A buy signal is often given when the stochastic indicator has been below 20 and then rises above 20. In contrast, traders look to place a sell trade when an instrument is overbought. A sell signal is often given when the stochastic indicator has been above 80 and then falls below 80.

However, overbought and oversold labels can be misleading. An instrument won’t necessarily fall in price just because it is overbought. Similarly, an instrument won’t automatically rise in price just because it is oversold. Overbought and oversold simply mean the price is trading near the top or bottom of the range. These conditions can last for a while.

Stochastic divergence strategy

Another popular trading strategy using the stochastic indicator is a divergence strategy. In this strategy, traders will look to see if an instrument’s price is making new highs or lows, while the stochastic indicator isn’t. This can signal that the trend may be about to reverse.

A bullish divergence occurs when an instrument’s price makes a lower low, but the stochastic indicator touches a higher low. This signals that selling pressure has decreased and a reversal upwards could be about to occur. A bearish divergence occurs when an instrument’s price makes a higher high, but the stochastic indicator hits a lower high. This signals that upward momentum has slowed and a reversal downward could be about to take place.

An important point in relation to the divergence strategy is that trades should not be made until divergence is confirmed by an actual turnaround in the price. An instrument’s price can continue to rise or fall for a long time, even while divergence is occurring.

Stochastic crossover

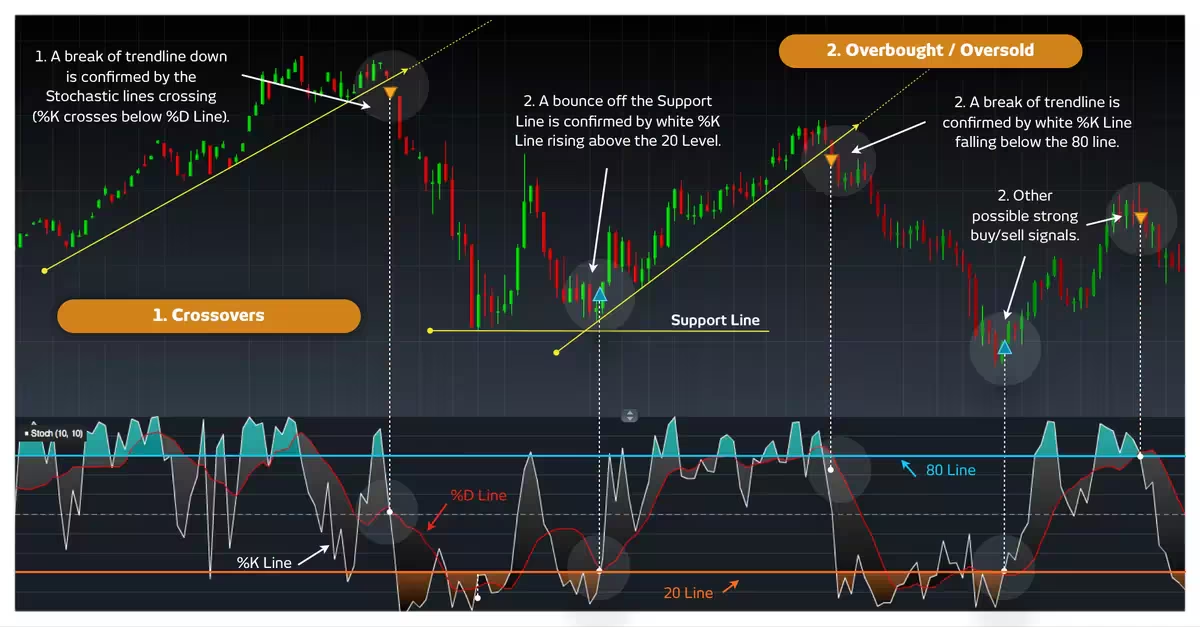
The stochastic crossover is another popular strategy used by traders. This occurs when the two lines cross in an overbought or oversold region.

When an increasing %K line crosses above the %D line in an oversold region, it is generating a buy signal. When a decreasing %K line crosses below the %D line in an overbought region, this is a sell signal. These signals tend to be more reliable in a range-bound market. They are less reliable in a trending market.

In a trend-following strategy, traders will monitor the stochastic indicator to ensure that it stays crossed in one direction. This shows that the trend is still valid.

Stochastic bull/bear strategy

Lastly, another popular use of the stochastic indicator is identifying bull and bear trade setups. A bull trade setup occurs when the stochastic indicator makes a higher high, but the instrument’s price makes a lower high. This indicates that momentum is increasing and the instrument’s price could move higher. Traders often look to buy after a brief price pullback in which the stochastic indicator has dropped below 50 on the pullback and then moved higher again. A bear trade setup occurs when the stochastic indicator makes a lower low, but the instrument’s price makes a higher low. This signals that selling pressure is increasing and the instrument’s price could move lower. Traders often look to place a sell trade after a brief rebound in the price.

Traders should be aware that the stochastic indicator does have limitations. It is not a foolproof technical analysis tool. The indicator can often generate false signals. During choppy market conditions, this can happen frequently.

Powerful trading on the go

Seamlessly open and close trades, track your progress and set up alerts

Summary

In conclusion, the stochastic indicator is a useful technical analysis tool that can be used to identify overbought and oversold instruments. When combined with other indicators, the stochastic indicator can help a trader identify trend reversals, support and resistance levels​​​, and potential entry and exit points. Price formations such as wedges and triangles and trendlines also work well with stochastic indicators. For example, the trader could monitor an established trend with a valid trend line and wait for the price to break the trend with confirmation from the stochastic indicator.