What is the awesome oscillator?
The awesome oscillator is a type of technical indicator that was invented by Bill Williams as a method for trading stocks, forex and commodities. He also developed the accelerator oscillator, which works in a similar way to the awesome oscillator. These days, the indicator can be used for all financial markets, including those mentioned above. Many timeframes can be used to set the awesome oscillator, whether this be minutes (extreme short-term), hours (short-term), days (medium-term) or months (long-term).
Awesome oscillator calculation
Our online trading platform calculates the awesome oscillator formula automatically when it is applied to a price chart; however, it is still useful to have knowledge of its raw formula. The awesome oscillator looks at the last five bars on a candlestick chart in comparison with the previous 34. The value is then calculated by the difference in simple moving average (SMA) over these two timeframes. The awesome oscillator formula is as follows:
Median price = (High price of a session + low price of a session) ÷ 2
Awesome oscillator = 5 period simple moving average (median price) – 34 period simple moving average (median price)
How to read the awesome oscillator
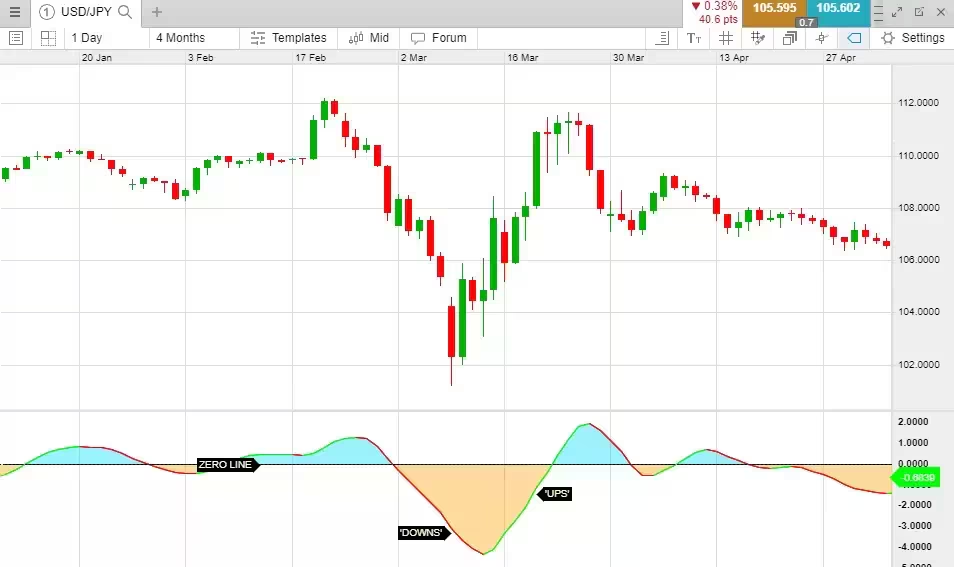
On many trading platforms, the awesome oscillator consists of green and red bars or lines. Green bars represent ‘ups’, where the awesome oscillator’s value is greater than the previous bar, and the red bars represent ‘downs’, where the value is lower than the previous bar. There is a zero line in the centre and the bars are plotted based on the calculation of the two moving averages. The below image is from our Next Generation trading platform, where green and red lines are outlined to show ups and downs on a price chart.
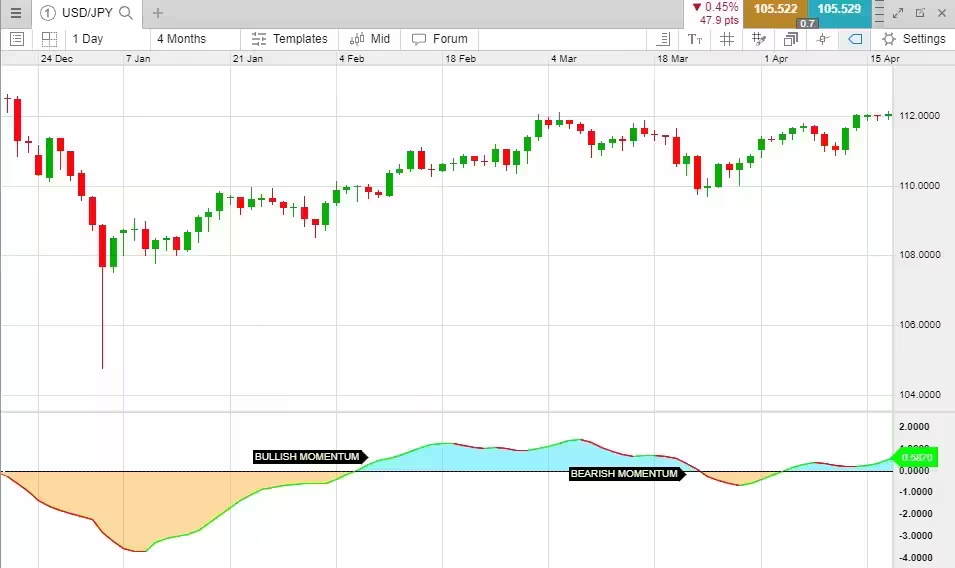
Traders can use signal lines to interpret which way the market is moving. If the awesome oscillator crosses above the zero line, this signals bullish momentum, but if it crosses below the zero line, this signals a bearish momentum. This can easily change, so the awesome oscillator aims to detect whether a trend is continuing or starting to reverse. The below chart shows how green lines indicate bullish momentum and red lines indicate bearish momentum on a .