
Published: Friday, 13 March 2026 at 12:10 (UK) Welcome to Michael Kramer’s pick of the key market events to look out for in the week beginning Monday 16 March. Central bank interest rate meetings will dominate the week ahead, particularly as the recent rise in oil prices sparks fears of a spike in inflation. The US Federal Reserve’s rate-setting meeting is likely to be the main focus for global markets, but the European Central Bank, the Bank of Japan and the Bank of England are also scheduled to meet. Meanwhile, US earnings season is drawing to a close, but Micron’s results will still attract attention given their relevance to the AI trade. In the UK, Thursday’s BoE rate decision will be preceded by the latest labour market data, which could be of note for sterling traders as growth in Britain’s economy remains sluggish.
Micron Technology Q2 earnings
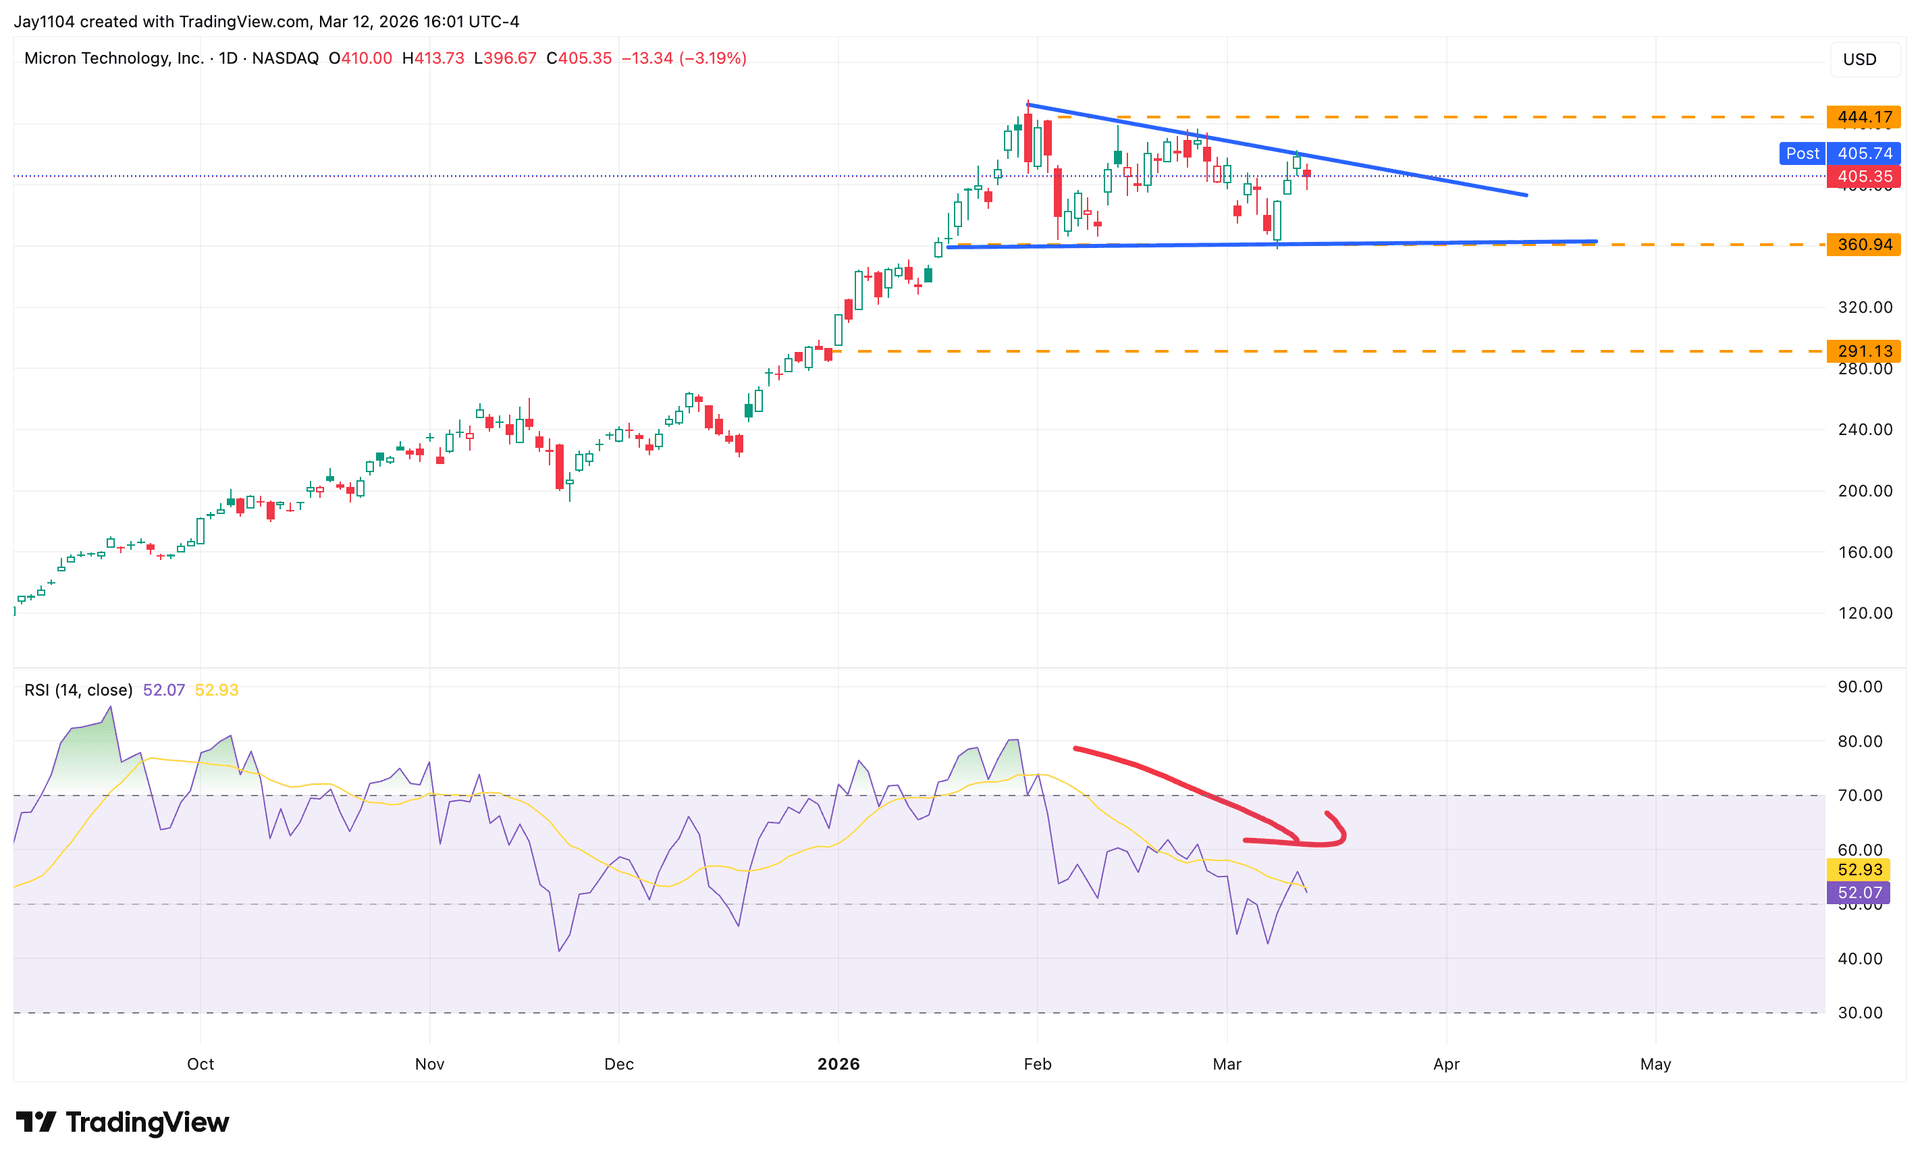
Wednesday 18 March Micron is expected to report that second-quarter earnings and revenue more than doubled year-on-year to $8.73 a share and $19.1bn, respectively, based on analysts’ estimates. The Nasdaq-listed memory chip maker’s gross margin is projected to expand to 67.3%, up from 56.9% in the previous quarter. Guidance will also be closely watched. Analysts currently expect third-quarter revenue to rise to $22.1bn, with gross margin set to increase to 69.1%. The options market implies that shares of Micron – up 28.5% this year at $405.35, as at Thursday’s close – could move 10% in either direction following the Q2 results. Micron appears to be positioned bullishly ahead of the results, with implied volatility near 100% and likely to increase further for options expiring on Friday 20 March. Once the company’s results are released on Wednesday, call premiums could unwind, and hedging flows may turn negative, potentially weighing on the shares. In terms of the key levels to watch, the options market points to resistance near $430 and support around $390. Technical analysis suggests that the trading range may be somewhat wider, with resistance near $445 and support around $360. Since the end of January, the stock has been trending lower and appears to be forming a descending triangle, typically a bearish chart pattern that can signal the continuation of a downtrend. Momentum indicators, including the relative strength index (RSI), have also been weakening. A break below $360 might open the way to a deeper decline towards $290 over the medium to long term.