
Exhaustion formations in the bullish trend
The falls in US indices last Friday triggered bearish engulfing patterns on the weekly charts. These formations point to fatigue in the previous bullish trend and have pushed daily price oscillators lower against their signals. In many cases, bearish divergences have also appeared and overbought levels remain elevated.
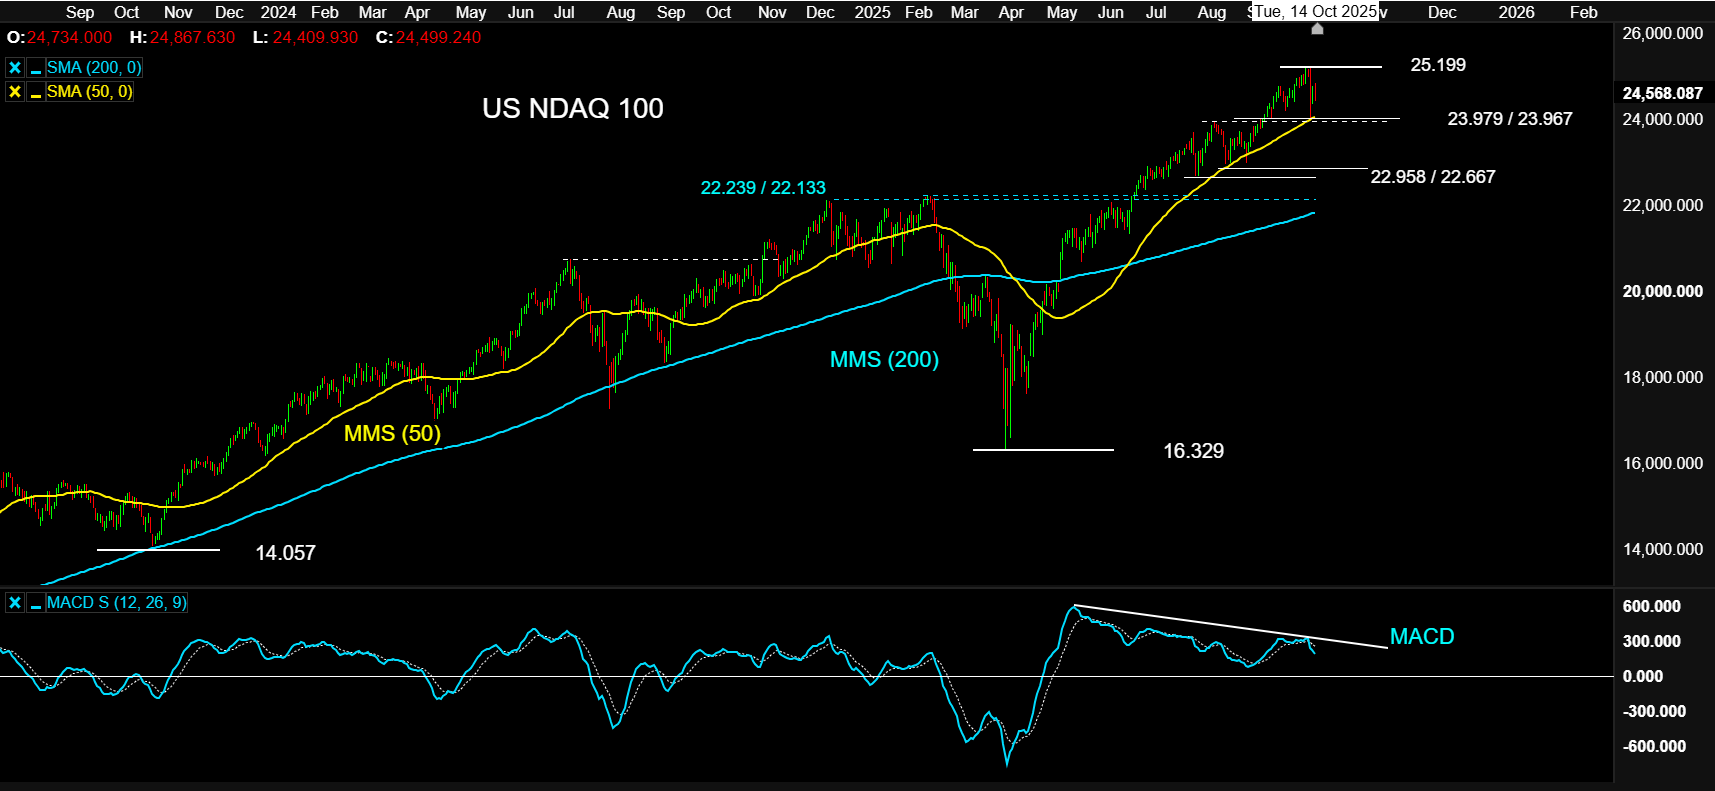
US NDAQ 100 on a daily chart with MACD, extracted from Next Generation on 14 October 2025
For now, pullback to the SMA (50) and August 2025 highs
Friday's fall was broad, although it was somewhat magnified because the market had become used to very narrow trading ranges. Even so, the indices have so far found support at the first reasonably meaningful support levels.
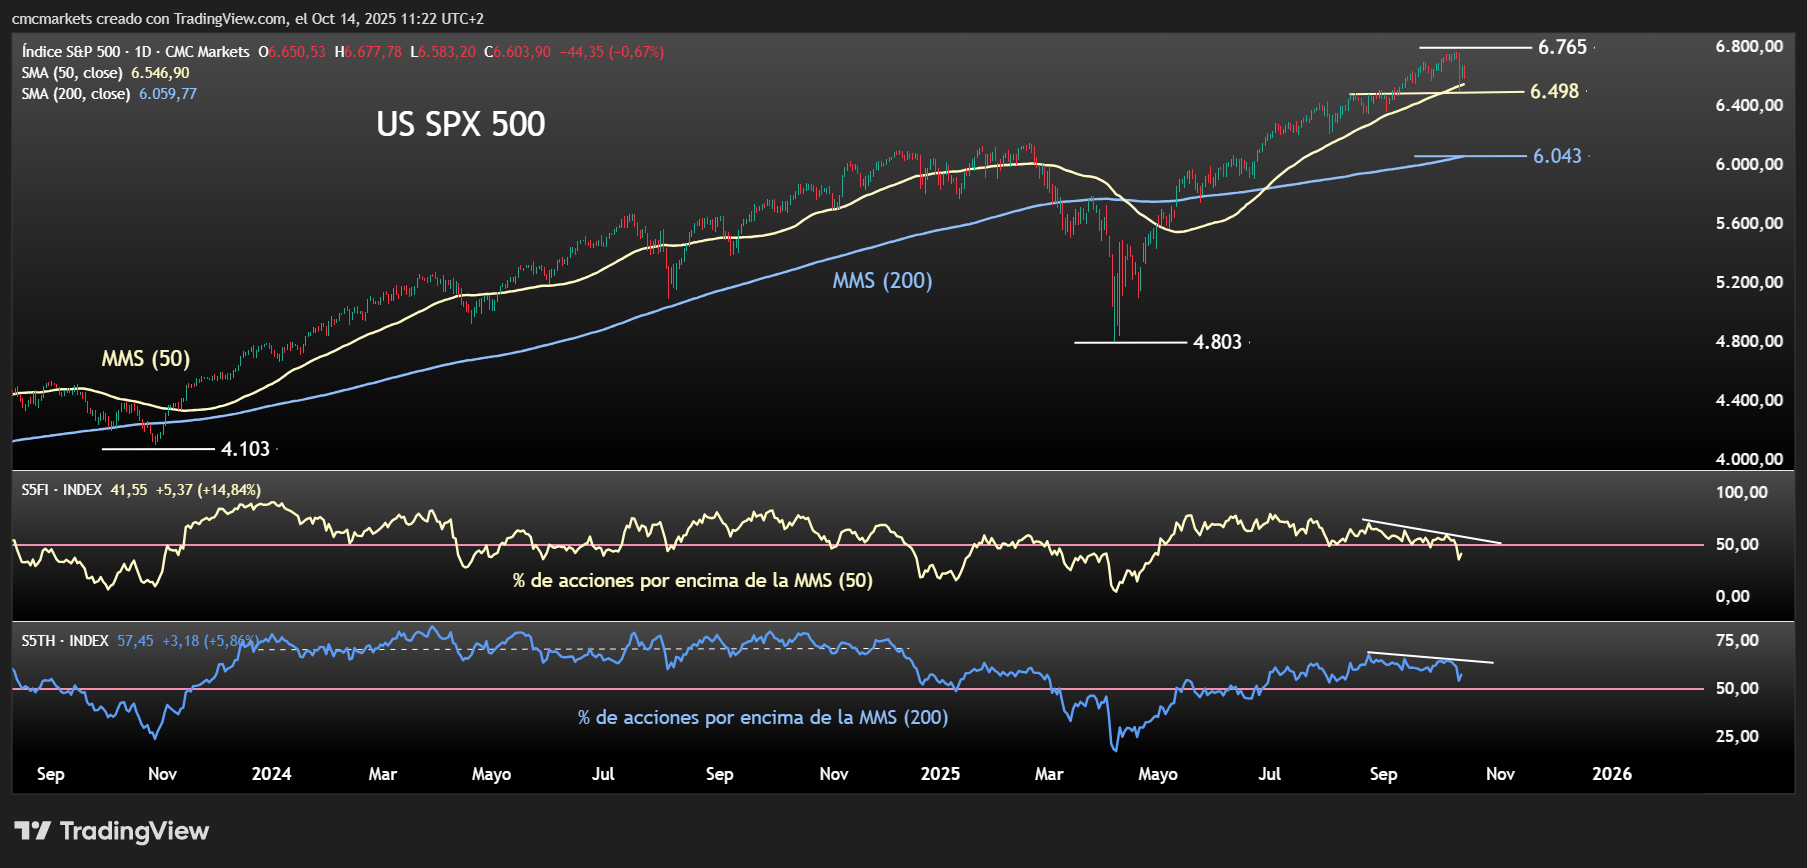
The SMA (50) and the August 2025 highs, previous resistance levels that have now become support, have managed to halt the falls in the US NDAQ 100, US SPX 500 and US 30. As long as these supports hold, the correction may still be interpreted as a pullback towards important levels.
That pullback may tempt some traders to rejoin the underlying bullish trend from a short-term perspective. It is a familiar pattern from recent months, especially for traders drawn in by the TACO trade and fear of missing out (FOMO).
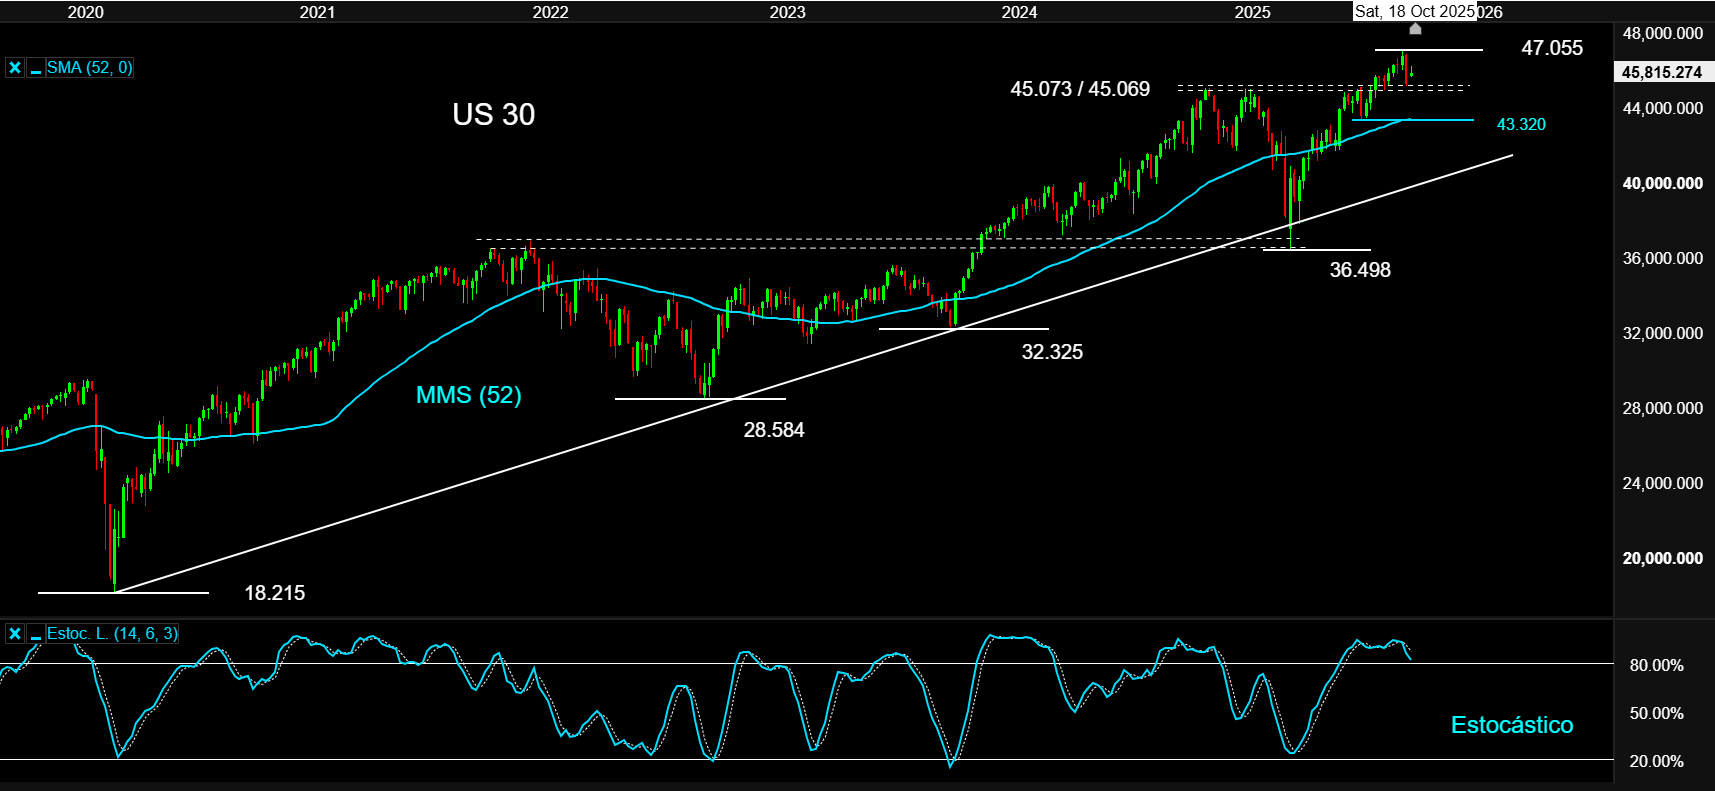
US 30 on a weekly chart with stochastic, extracted from Next Generation on 14 October 2025